

 PDF
PDF Citation
 Print
Print


INTRODUCTION
Breast cancer is the most common cancer among women worldwide and it is the main leading cause of cancer death in women [1]. Age, gender, benign breast tumors, early menopause, late menarche, hormone therapy, chest radiation exposure, alcohol consumption, diethylstilbestrol use, genetic risk factors, postmenopausal obesity, first pregnancy after the age of 30 years, not breastfeeding, and environmental risk factors are the risk factors for breast cancer [2]. Variations in the degree of gene expression, epigenetic changes, and polymorphisms all have a role in the genetics of breast cancer (DNA sequence 3 alterations).
A growing body of epidemiological evidence suggests an inverse association between vitamin D levels and breast cancer risk, yet the results are still mixed [34]. Vitamin D receptor (VDR) is a ligand-dependent transcription factor in the nuclear receptor superfamily [5]. When it binds to its ligand, calcitriol (1α, 1,25 dihydroxyvitamin D), VDR translocates into the nucleus and binds to the vitamin D response element, activating the transcription of numerous target genes [5] involved in a myriad of cellular functions and processes, and impaired vitamin D activities have been widely implicated in human cancer [67]. In 1979, VDR was first identified in a breast cancer cell line, and was later identified in many breast cancer cell lines and the majority of human breast tumor tissues examined [8]. VDR knockout mice have higher rates of preneoplastic mammary lesions than wild-type mice [8], and treatment with a vitamin D analogue prevents the development of carcinogen-induced mammary tumors [9] by inhibiting cellular proliferation, promoting differentiation, and inducing apoptosis [1011].
Herein, we first assessed the expression pattern of VDR in human breast cancer by bioinformatics analysis. Then, we analyzed the prognostic significance of VDR expression in breast cancer. Finally, we explored several potential mechanisms of VDR action in breast cancer by analysis of co-expressed genes and assessment of its correlation with parental genes. These findings improve our understanding of VDR ’s roles and mechanisms in human breast cancer.
METHODS
Public bioinformatics platform
The authors used various public bioinformatics database platforms as follows. The study was approved by the Institutional Review Board committee of Konkuk University Medical Center (No. 20220902).
Oncomine database analysis
The Oncomine database (https://www.oncomine.org/resource/login.html) is a web-based data mining platform that incorporates 264 independent datasets and aims to collect, standardize, analyze, and deliver transcriptomic cancer data for biomedical research [12]. An online tumor microarray database was used to determine the expression levels of VDR in breast cancer. The expression fold change of VDR in clinical cancer specimens compared to normal controls was obtained as the following parameters: P-value of 1e-4, fold change of 2, and gene ranking in the top 10%. The co-expression profile of the VDR gene in breast cancer was assessed and displayed as a heat map.
GEPIA analysis
The GEPIA (Gene Expression Profiling Interactive Analysis; http://gepia.cancer-pku.cn/detail.php) is a web server for analyzing the RNA sequencing expression data of 9,736 tumors and 8,587 normal samples from the TCGA (The Cancer Genome Atlas) and the GTEx (Genotype-Tissue Expression) projects, using a standard processing pipeline. The GEPIA-provided box plot tool was used for tumor/normal differential expression analysis of VDR in different cancers [13].
UALCAN analysis
UALCAN (http://ualcan.path.uab.edu/) is an effective website for online analysis and mining of cancer data [14]. It is mainly based on the analysis of relevant cancer data in the TCGA database. It can help us to perform biomarker identification, expression profiling, survival analysis, etc., of related genes. We can query other databases for related information through the links provided.
Kaplan-Meier plotter analysis
The Kaplan-Meier plotter (https://kmplot.com/analysis/) is a web-based tool used to analyze the impact of various genes on the survival of cancer patients [15]. We used this tool to analyze the correlations between the expression of VDR and the survival of patients with breast cancers.
bc-GenExMiner ver. 4.2 analysis
bc-GenExMiner (breast cancer Gene-Expression Miner) ver. 4.2 (http://bcgenex.centregauducheau.fr/BC-GEM/GEM-Accueil.php?js=1) was used to analyze the relationship between LEP expression and clinicopathological parameters in breast cancer patients [16].
GEO data profiles
From National Center for Biotechnology Information (NCBI)-GEO (Gene Expression Omnibus; https://www.ncbi.nlm.nih.gov/gds/), 2 gene expression datasets (GSE27155, GSE35570) were downloaded and analyzed on the GPL570 platform (Affymetrix Human Genome U133 Plus 2.0 array, Thermo Fisher Scientific, Inc., Waltham, MA, USA).
Functional enrichment analysis
To characterize the functional roles of the differentially expressed genes (DEGs), the functional enrichment analysis web tool WebGestalt (WEB-based Gene SeT AnaLysis Toolkit; http://www.webgestalt.org/) was used for gene ontology (GO) enrichment analysis of molecular function (MF), biological process (BP), and cellular component (CC) with a cutoff of P < 0.05. WebGestalt was also used to explore Kyoto Encyclopedia of Genes and Genomes (KEGG) pathways to understand the signaling pathways in which DEGs are involved [17].
Construction of a protein-protein interaction network and hub gene analysis
STRING database (https://string-db.org/) [18] is an online tool that provides information on hypothetical gene function, interrogates gene lists, and ranks genes based on functional evaluations. It contains a large set of functional association data, including protein and gene interactions, pathways, and co-expression data. We applied the STRING database analysis tool to predict protein-protein interactions (PPIs) using VDR as a query. The prediction output is in the form of a network that shows the relationships between genes in the list, where nodes symbolize genes and links represent networks. Cytoscape (ver. 3.6.1 [18]) software (http://www.cytoscape.org/) was used to visualize and analyze the PPI network. Hub genes in the network were subsequently identified using the Cytoscape plugin cytoHubba [19].
UCSC cancer genomics browser analysis
The heat map and correlation between VDR in the same patient cohort were analyzed by data mining in TCGA-breast cancer using the UCSC (the University of California, Santa Cruz) Xena browser (https://xena.ucsc.edu/) [20]. Subsequently, the methylation status of VDR was also examined using the UCSC Xena browser.
Statistical analysis
Expression data were extracted from the Oncomine, cBioPortal (https://www.cbioportal.org), and GEPIA databases. The P-values of <0.05 were considered significant. Methylation data were extracted from TCGA UCSC Xena browser, and the box plot was retrieved from UALCAN web. The unpaired t-test was used to determine the P-values, where P < 0.05 was considered significant (*P < 0.05, **P < 0.01, ***P < 0.001, and ****P < 0.0001). Survival curves were extracted from the Kaplan-Meier scanner, Kaplan-Meier plotter. All survival results are displayed with P-values obtained using the log-rank test. Log-rank P-values < 0.05 were considered significant.
RESULTS
VDR expression in human breast cancer
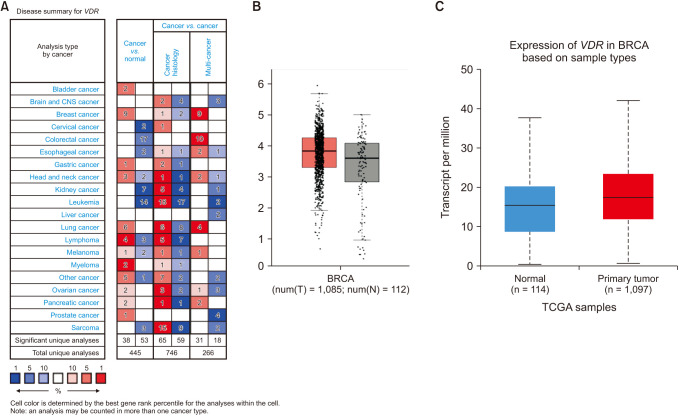
The Oncomine database was used to compare the messenger RNA (mRNA) levels of VDR in breast cancer tissues and normal tissues. The results showed that in comparison to their expression levels in normal tissues, VDR was overexpressed in breast cancer tissues (P < 0.01) (Fig. 1A). To further evaluate the differential expression of VDR , we compared their expression levels in the TCGA database using the platforms of GEPIA and UALCAN. The results showed that the expression of VDR in breast cancer tissues is significantly higher than in normal tissues (P < 0.01) (Fig. 1B, C).
Prognostic value of VDR expression in breast cancer patients
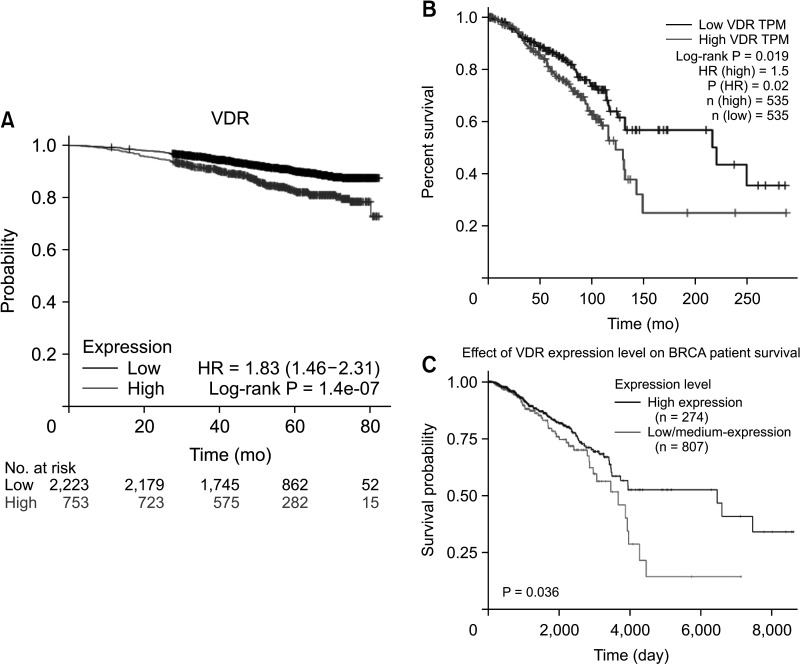
As shown in Fig. 2, the prognostic value of VDR expression in breast cancer was analyzed using the Kaplan-Meier plotter, GEPIA, and UALCAN platforms. The results of the Kaplan-Meier plotter analysis indicated that overexpression of VDR was significantly associated with worse overall survival (OS) in breast cancer (P < 0.001) (Fig. 2A). Analysis of the relationship between VDR expression and OS in breast cancer patients by GEPIA and UALCAN platforms showed that overexpression of VDR was related to poor prognosis (P < 0.05) (Fig. 2B, C).
Prognostic analysis of molecular subtypes
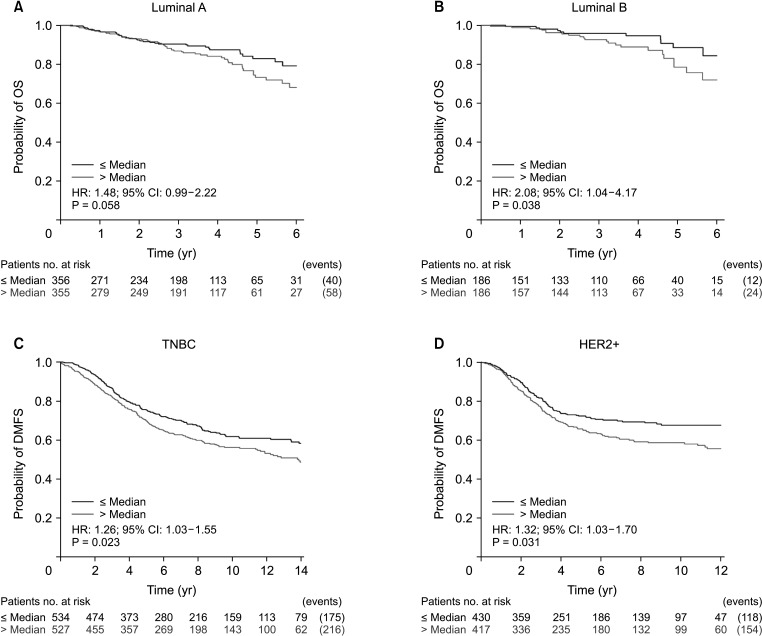
We plotted the Kaplan-Meier survival curves for molecular subtypes using the web-based curator. In the luminal A, luminal B, triple-negative breast cancer (TNBC), and human epidermal growth factor receptor 2 (HER2) subtypes of breast cancer, lower VDR expression of VDR was associated with worse prognosis (Fig. 3). This association was statistically significant. This analysis found that high expression of VDR in these molecular subtypes of breast cancer is associated with unfavorable prognostic factors and a high risk of breast cancer death. Hence, high VDR expression is a negative prognostic factor.
Screening for differentially expressed genes in the NCBI-GEO and TCGA datasets
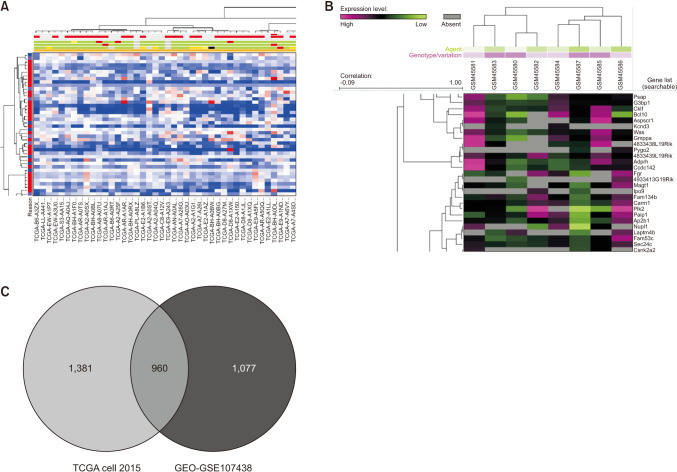
Identifying the co-expressed genes would improve the understanding of potential functions of VDR in breast cancer. Thus, the co-expressed genes of VDR were predicted by using TCGA database and GEO database (Fig. 4A, B); and, finally identified 960 DEGs (Fig. 4C). With the cutoff criteria of P < 0.01 and |logFC| > 1.5, we identified 423 DEGs from TCGA and GEO using 2 datasets (GSE27155, GSE35570). The 960 DEGs common between the GEO and TCGA databases were further used for pathway enrichment analysis.
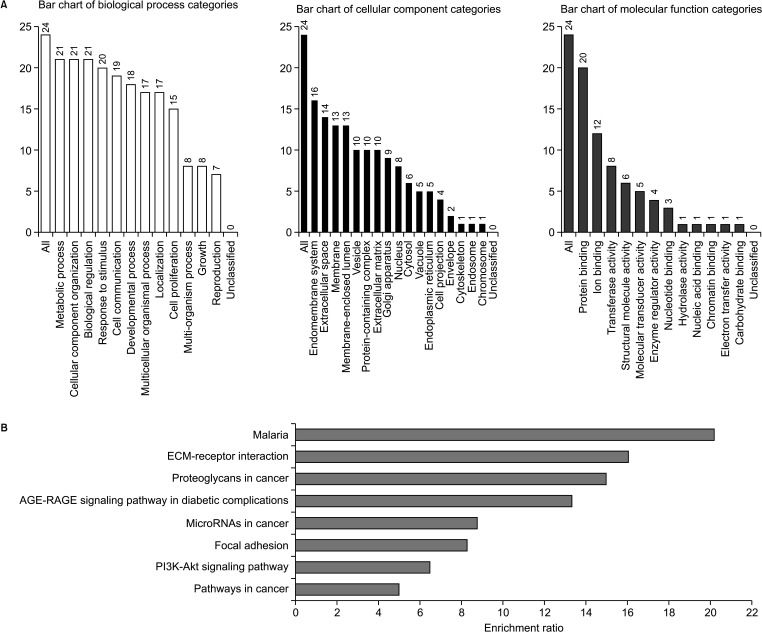
Functional analysis of gene ontology and pathways
A gene involved in a signaling pathway is normally co-expressed with other genes; thus, various genes collectively play a significant role in human cancer. Here, we identified genes whose expression correlates with that of VDR in breast cancers. We performed GO analysis of candidate DEGs using an online database. The DEGs were classified into the BP, CC, and MF groups (Fig. 5A). In the BP group, DEGs were mainly enriched in metabolic process and CC organization or biogenesis. In the CC group, DEGs were mainly enriched in the endomembrane system and extracellular space. In the MF group, DEGs were mainly enriched in protein binding and ion binding. According to the KEGG pathway enrichment analysis, DEGs were significantly enriched in pathways in cancer, malaria, extracellular matrix-receptor interactions, PI3K-AKT signaling pathway, and proteoglycans in cancer. DEGs were also enriched in complement and coagulation cascades and tyrosine metabolism (Fig. 5B).
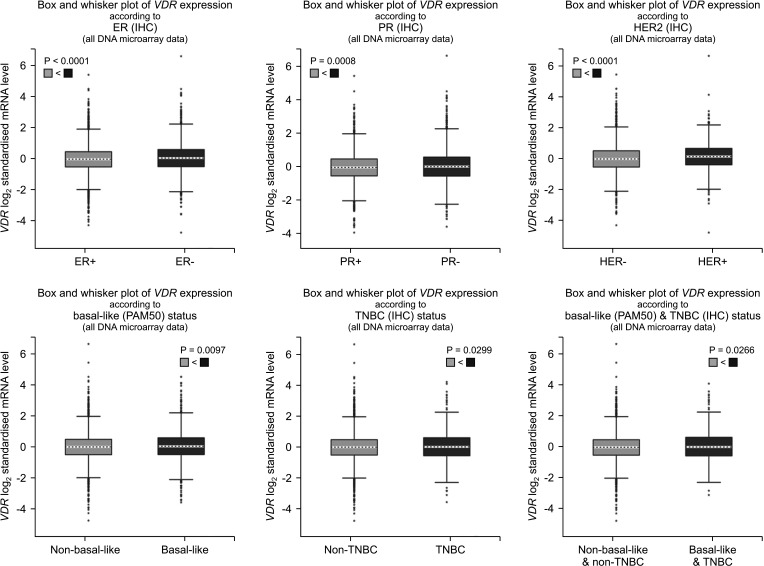
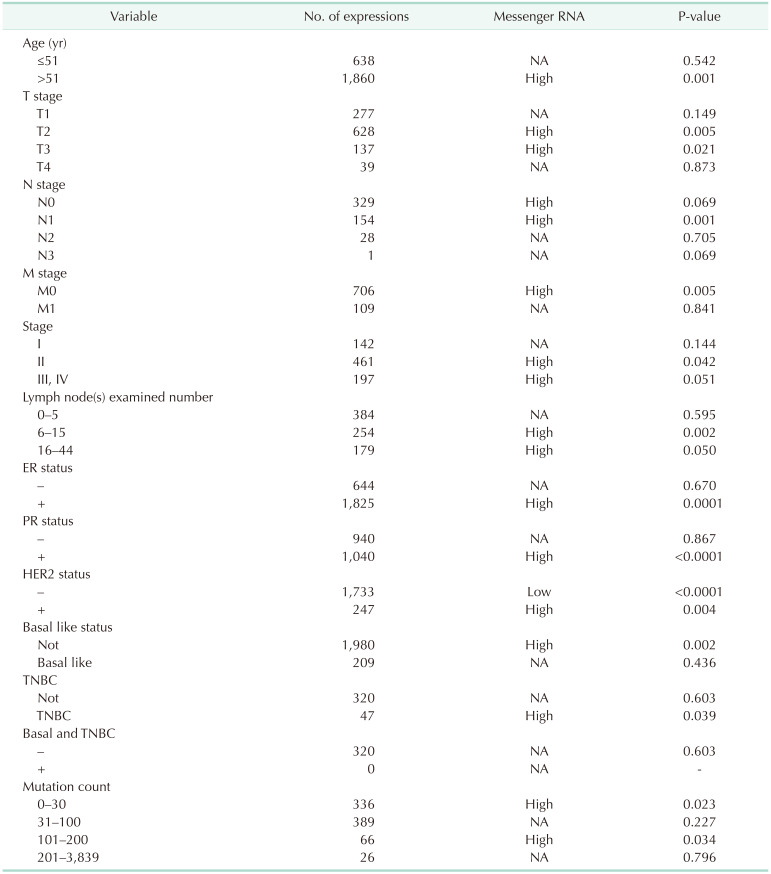
Relationship between VDR expression and clinicopathological parameters in breast cancer patients
In the TCGA database, the expression of VDR was correlated with clinicopathological features of breast cancer patients (Fig. 6). The expression of VDR was related to estrogen receptor (ER) status, progesterone receptor (PR) status, HER2 status, basallike PAM 50 status, TNBC status, and basal-like PAM 50 & TNBC status (P < 0.05). We further investigated the associations between VDR expression and different clinicopathological characteristics in patients with breast cancer. As shown in Table 1, among breast cancer patients, VDR expression was higher in the >51-year-old group than in the ≤51-year-old group. In different TNM stages, VDR was significantly expressed in the T2 and T3 stages. VDR was the high expression in the N0 and N1 stages, and VDR was the high expression in the M0 stage. In different stages, VDR had significantly higher expression in stages II, III, and IV. The VDR was found to be highly expressed in both ER-positive and PR-positive statuses. Interestingly, VDR showed clinical significance in both HER2 negative and positive breast cancer patients. The expression of VDR was significantly upregulated in non-basal-like statues and triple-negative subtypes. In addition, high VDR expression also tended to correlate with mutation counts of 0–30 (Table 1).
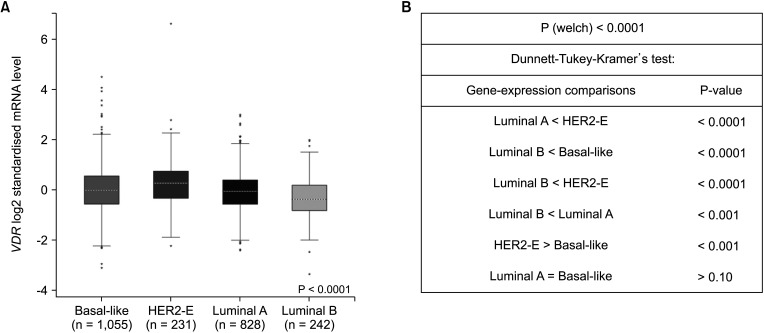
The expression of VDR in breast cancer by histological and molecular subtypes
Fig. 7A shows VDR expression according to histological type and Fig. 7B according to molecular subtype. The VDR mRNA level was lower in luminal A type tumors than in HER2, and in luminal B than in basal-like and HER2 and was higher in HER2 type than in basal-like; all these differences were statistically significant.
Identification of known and predicted structural proteins essential for VDR function
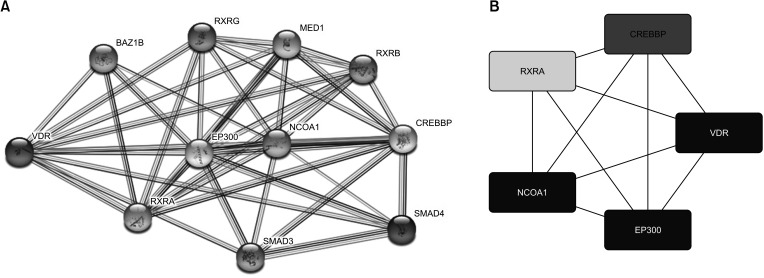
The PPI network of VDR was generated using the STRING database. The result showed that the following proteins showed interactions with VDR: receptor for retinoic acid (RXRA), E1A-binding protein P300 (EP300), nuclear receptor coactivator 1 (NCOA1), CREB-binding protein (CREBBP), space mission analysis and design (SMAD)-3, SMAD4, retinoid X receptor beta (RXRB), mediator of RNA polymerase II transcription subunit 1 (MED1), bromodomain adjacent to zinc finger domain 1B (BAZ1B), and retinoid X receptor gamma (RXRG) (Fig. 8A). To identify the hub genes, we used the CytoHubba Cytoscape plugin and extracted data from 4 calculation methods (edge percolated component, maximum cluster centrality, maximum neighborhood component, and degree). We selected the top 5 nodes ranked by these 4 methods. The top 5 genes were VDR, RXRA, NCAO1, EP300, and CREBBP (Fig. 8B). Thus, these predicted interacting partners of VDR may be involved in the regulation of VDR-mediated cancer progression and prognosis.
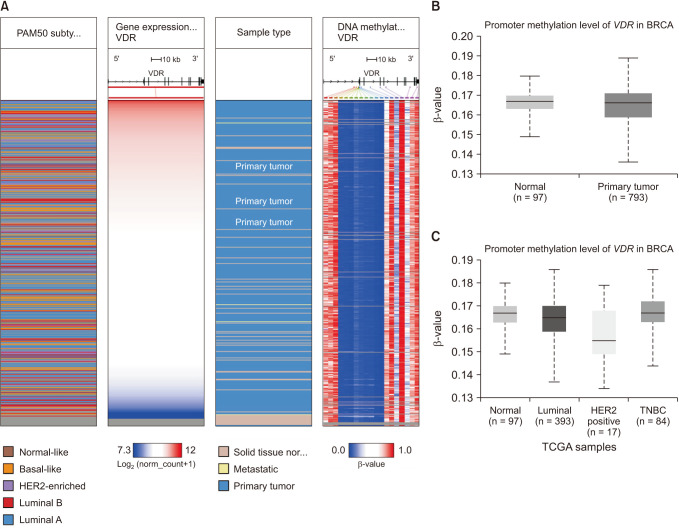
The promoter methylation status of VDR in breast cancer
We also investigated the methylation status of the promoter of the VDR gene using UCSC Xena, an interactive web viewer for the visualization of DNA methylation based on TCGA data (Fig. 9A). We found that the VDR promoter is significantly hypermethylated in breast cancer tissue compared to the corresponding normal tissue (Fig. 9B). We also found that it is hypermethylated in TNBC, whereas the level of methylation is significantly lower in HER2+ (Fig. 9C).
DISCUSSION
Breast cancer is the first or second most common cancer among females worldwide. Many studies have been conducted to assess the relationship between the VDR gene and breast cancer development [21]. The purpose of this study was to examine the role of VDR in the prognosis of breast cancer. We conducted a bioinformatics analysis of various gene expression datasets with clearly defined distinguishing parameters between cancer and normal tissues. We found that VDR is expressed differently in cancer and normal tissues. According to our Oncomine, GEPIA, and UALCAN analysis, VDR is upregulated in lymphoma, glioblastoma, rectum adenocarcinoma, myeloma and breast, lung, and ovarian cancers, but downregulated in colon, esophageal, gastric, kidney, and prostate cancers. The expression of VDR in breast cancer was significantly higher than that in normal breast tissue.
In previous research, VDR expression was found to be associated with favorable prognostic characteristics, such as small size, low grade, ER positivity, PR positivity, low Ki67 expression, and luminal-like molecular subtypes [2223]. In these studies, ER and HER2 status was found to be positively correlated with VDR expression. Conversely, basal-like status and TNBC status were negatively correlated with VDR expression.
We further investigated the prognostic value of VDR in breast cancer using Kaplan-Meier plotter, and the pooled results revealed that lower VDR expression correlated with shorter OS, RFS, distant metastasis-free survival, and postprogression survival. Together, these findings indicate that increased expression of VDR might be a useful marker in the prognosis of breast cancer. A previous study [22] has associated high expression of VDR in invasive breast tumors with favorable prognostic factors and a low risk of breast cancer death. Hence, high VDR expression appears to be a positive prognostic factor [22]. In contrast, our results indicate that high VDR expression was associated with poor survival in breast cancer. Thus, because of the contradictory results from different analyses, its role in breast cancer remains unclear.
Tumorigenesis is a multi-step process that leads to tumor growth [24]. It is affected primarily by 4 major factors: somatically acquired genetic, epigenetic, transcriptomic, and proteomic alterations [24]. Genomic regions with possible inhibitory or carcinogenic effects undergo simultaneous loss-of-function and gain-of-function effect [2425]. Therefore, we used cBioPortal to identify breast cancer with copy number alterations and mutations in VDR genes. Missense and truncating mutations predominantly occurred within protein-coding sequences of these genes.
Through co-expression and correlation analysis, we observed that ASAP1 expression was positively correlated with VDR expression. ASAP1 is a multi-domain member of the ARFGAP protein family and has roles in metastasis in several systems including breast cancer cell lines, in which it has been implicated in invasion and metastatic potential [26]. Co-expression of these 2 genes may have implications for clinical outcomes in patients with breast cancer.
We then used the online tool to conduct GO and KEGG pathway analyses to evaluate the common role of these associated genes in breast cancer. VDR-correlated genes demonstrated more varied characteristics than VDR-correlated genes (12 vs. 31 pathways). This analysis indicated that VDR performs various functions with regard to pathway regulation; however, they may have some similar functions in breast cancer signaling pathways and in breast cancer types. The VDR promoter is hypermethylated in breast cancer, its demethylation in breast cancer cell lines results in reexpression of VDR transcripts [23]. Similar epigenetic suppression of VDR mRNA expression has been demonstrated in placental and choriocarcinoma cell lines, which also show VDR mRNA reexpression after azacitidine and its deoxy derivative, decitabine (azacitidine) treatment [2327]. Comparison of the VDR expression heat map and DNA methylation status revealed that its expression might be negatively related to some CpG sites (blank frame).
In conclusion, the present study investigated the functions of VDR as predictive biomarkers in breast cancer using a comprehensive multiomic approach. Although we explored the relationship between VDR and breast cancer patients, there are still certain restrictions necessitating more study. Nevertheless, our research provides suggestions concerning the predictive function of VDR in breast cancer.
 XML Download