

 PDF
PDF Citation
 Print
Print


INTRODUCTION
METHODS
Study design
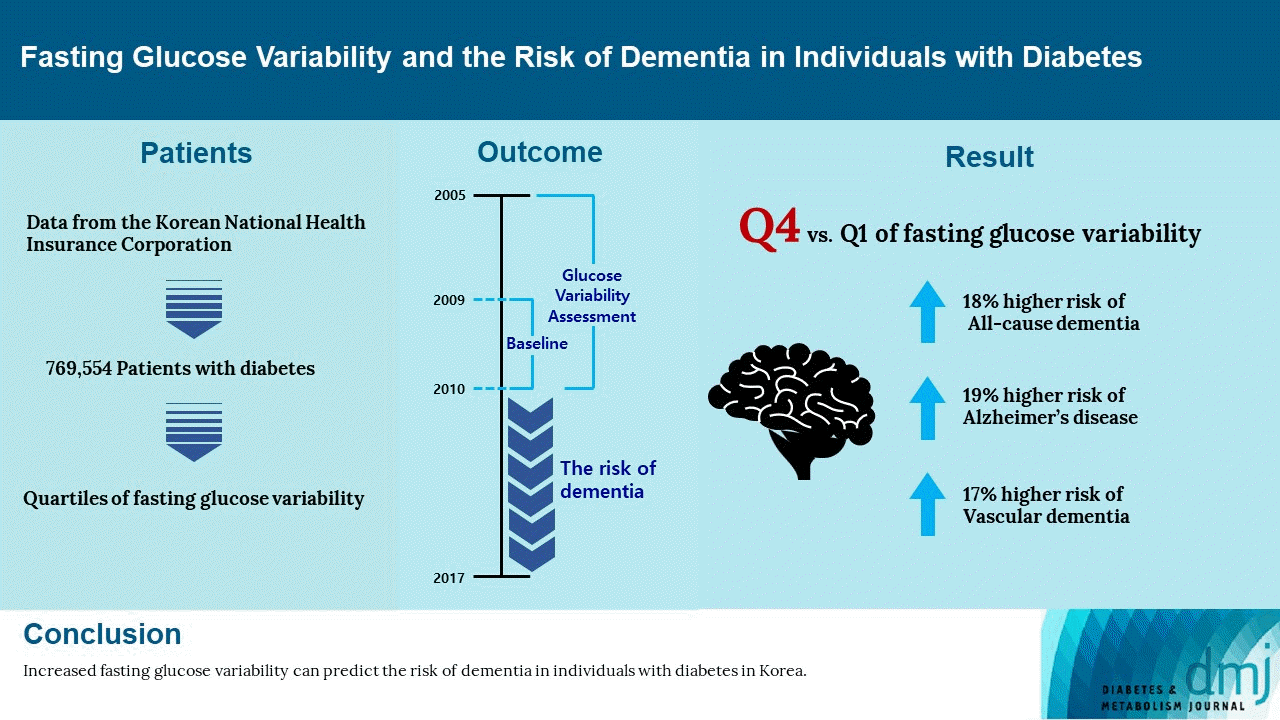
Study participants
Definition of dementia
Definition of GV
Measurements of covariates
Operational definition of comorbidities
Statistical analysis
RESULTS
Table 1.
| Characteristic | VIM Q1 (n=192,387) | VIM Q2 (n=192,390) | VIM Q3 (n=192,389) | VIM Q4 (n=192,388) | P value | |
|---|---|---|---|---|---|---|
| Age, yr | 61.1±9.8 | 60.1±9.9 | 59.6±10.1 | 59.2±10.4 | <0.001 | |
| Male sex | 108,883 (56.6) | 115,446 (60) | 119,618 (62.2) | 124,812 (64.9) | <0.001 | |
| Body mass index, kg/m2 | 24.8±3.0 | 24.9±3.1 | 24.9±3.1 | 24.8±3.2 | <0.001 | |
| Systolic BP, mm Hg | 128.3±15.2 | 128.7±15.2 | 128.8±15.3 | 128.5±15.3 | <0.001 | |
| FG, mg/dL | 125.1±34.0 | 130.2±35.5 | 135.8±39.0 | 146±53.4 | <0.001 | |
| TC, mg/dL | 193.6±39.1 | 194.9±39.9 | 195.6±40.7 | 194.4±41.5 | <0.001 | |
| Triglyceride, mg/dL | 132.9 (132.6–133.2) | 138.51 (138.2–138.9) | 143.1 (142.7–143.5) | 146.4 (146.1–146.8) | <0.001 | |
| HDL-C, mg/dL | 52.6±22.7 | 52.3±21.6 | 52±21.8 | 51.5±21.2 | <0.001 | |
| FG_VIM, % | 8.2±3.0 | 16.6±2.3 | 25.5±3.0 | 43.6±11.1 | <0.001 | |
| FG_SD, mg/dL | 8.1±5.3 | 16.8±8.5 | 26.7±13.1 | 49±25.2 | <0.001 | |
| FG_CV, % | 6.2±2.6 | 12.8±2.8 | 19.9±4.3 | 35±11.2 | <0.001 | |
| FG_ARV, mg/dL | 10±7.2 | 20.3±11.9 | 31.7±18.3 | 56.5±34.3 | <0.001 | |
| Current smoker | 31,515 (16.4) | 36,711 (19.1) | 42,474 (22.1) | 49,993 (26.0) | <0.001 | |
| Heavy drinking | 12,345 (6.4) | 13,803 (7.2) | 14,628 (7.6) | 14,245 (7.4) | <0.001 | |
| Regular exercise | 49,632 (25.8) | 48,136 (25) | 46,054 (23.9) | 43,129 (22.4) | <0.001 | |
| Comorbidities | ||||||
| Hypertension | 118,250 (61.5) | 116,410 (60.5) | 114,378 (59.5) | 111,527 (58.0) | <0.001 | |
| Dyslipidemia | 101,550 (52.8) | 97,619 (50.7) | 94,080 (48.9) | 89,773 (46.7) | <0.001 | |
| CKDb | 22,748 (11.8) | 22,675 (11.8) | 23,351 (12.1) | 25,858 (13.4) | <0.001 | |
| IHD | 28,227 (14.7) | 26,090 (13.6) | 24,489 (12.7) | 23,436 (12.2) | <0.001 | |
| Stroke | 10,356 (5.4) | 9,681 (5.0) | 9,347 (4.9) | 9,239 (4.8) | <0.001 | |
| Depressive disorder | 13,266 (6.9) | 12,147 (6.3) | 11,513 (6.0) | 10,802 (5.6) | <0.001 | |
| Income (lower 20%) | 34,619 (18.0) | 36,476 (19.0) | 38,776 (20.2) | 43,129 (22.4) | <0.001 | |
| Oral GLM | ||||||
| Metformin | 71,746 (37.3) | 74,741 (38.9) | 78,666 (40.9) | 84,539 (43.9) | <0.001 | |
| Sulfonylurea | 69,720 (36.2) | 76,044 (39.5) | 83,883 (43.6) | 91,683 (47.7) | <0.001 | |
| Meglitinide | 3,926 (2.0) | 4,258 (2.2) | 4,767 (2.5) | 5,895 (3.1) | <0.001 | |
| Thiazolidinedione | 11,549 (6.0) | 12,336 (6.4) | 13,279 (6.9) | 14,556 (7.6) | <0.001 | |
| DPP-4 inhibitor | 7,517 (3.9) | 7,775 (4.0) | 8,205 (4.3) | 8,425 (4.4) | <0.001 | |
| α-Glucosidase inhibitor | 18,679 (9.7) | 20,872 (10.9) | 23,989 (12.5) | 28,594 (14.9) | <0.001 | |
| Number of oral GLM | <0.001 | |||||
| 0 | 96,069 (49.9) | 92,826 (48.3) | 88,128 (45.8) | 82,178 (42.7) | ||
| 1 | 34,001 (17.7) | 31,634 (16.4) | 29,259 (15.2) | 26,576 (13.8) | ||
| 2 | 41,699 (21.7) | 44,149 (23.0) | 47,255 (24. 6) | 50,910 (26.5) | ||
| 3 | 17,080 (8.9) | 19,466 (10.12) | 22,559 (11.7) | 26,347 (13.7) | ||
| ≥4 | 3,538 (1.8) | 4,315 (2.24) | 5,188 (2.7) | 6,377 (3.3) | ||
| Insulin | 8,029 (4.2) | 9,406 (4.9) | 11,803 (6.1) | 19,440 (10.1) | <0.001 | |
| Duration of diabetes (≥5 years) | 56,320 (29.3) | 58,809 (30.6) | 62,606 (32.5) | 67,659 (35.2) | <0.001 | |
| E10 | 2,921 (1.52) | 3,325 (1.73) | 4,079 (2.1) | 6,139 (3.2) | <0.001 | |
| Number of exams | <0.001 | |||||
| 3 | 165,083 (85.8) | 150,451 (78.2) | 144,273 (75.0) | 140,434 (73.0) | ||
| 4 | 13,841 (7.2) | 19,425 (10.1) | 22,308 (11.6) | 24,602 (12.8) | ||
| 5 | 13,463 (7.0) | 22,514 (11.7) | 25,808 (13.4) | 27,352 (14.2) | ||
| Time interval between adjacent exams, yr | 1.9 (1.3–2.1) | 1.8 (1.11–2.1) | 1.76 (1.1–2.1) | 1.7 (1–2.1) | <0.001 | |
Values are presented as mean±standard deviation, number (%), or median (interquartile range). One-way analysis of variance and the chi-square test were used to compare the characteristics of the study participants at baseline. Post hoc multiple comparison analysis was performed using Bonferroni correction, and triglyceride levels were log-transformed for analysis.
VIM, variability independent of mean; BP, blood pressure; FG, fasting glucose; TC, total cholesterol; HDL-C, high-density lipoprotein cholesterol; SD, standard deviation; CV, coefficient of variation; ARV, average real variability; CKD, chronic kidney disease; IHD, ischemic heart disease; GLM, glucose-lowering medication; DPP-4, dipeptidyl peptidase 4.
![]()
Table 2.
Model 1 was adjusted for age, sex, body mass index, alcohol consumption, smoking, regular exercise, presence of hypertension, dyslipidemia, chronic kidney disease, lower 20% income, and hemoglobin levels. Model 2 is the same as model 1, with additional adjustment for the duration of diabetes for at least 5 years, the prescription number of glucose-lowering medications, prescription history of insulin, mean fasting glucose, and presence of depressive disorder.
![]()
Table 3.
Adjusted for age, sex, body mass index, alcohol consumption, smoking, regular exercise, presence of hypertension, dyslipidemia, chronic kidney disease, lower 20% income, hemoglobin levels, duration of diabetes for at least 5 years, prescription number of glucose-lowering medications, prescription history of insulin, mean fasting glucose, and presence of depressive disorder.
IR, incidence rate; HR, hazard ratio; CI, confidence interval; CKD, chronic kidney disease.
![]()
Table 4.
Adjusted for age, sex, body mass index, alcohol consumption, smoking, regular exercise, presence of hypertension, dyslipidemia, chronic kidney disease, lower 20% income, hemoglobin levels, duration of diabetes for at least 5 years, prescription number of glucose-lowering medications, prescription history of insulin, mean fasting glucose, and presence of depressive disorder.
IR, incidence rate; HR, hazard ratio; CI, confidence interval; DPP-4, dipeptidyl peptidase 4.
![]()
 XML Download