INTRODUCTION
METHODS
Subjects and study design
Study assessments
Ethics statement
Statistical analysis
Statistical methods
Sample size
RESULTS
Patient characteristics
Table 1
| Variable | Safety set (n=2,228) | Efficacy set (n=1,651) |
|---|---|---|
| Sex | ||
| Male | 1,363 (61.18) | 1,025 (62.08) |
| Female | 865 (38.82) | 626 (37.92) |
|
|
||
| Age, yr | 64.07±11.53 | 63.94±11.34 |
|
|
||
| Age groups, yr | ||
| <20 | 1 (0.04) | 1 (0.06) |
| ≥20 to <30 | 11 (0.49) | 7 (0.42) |
| ≥30 to <40 | 33 (1.48) | 18 (1.09) |
| ≥40 to <50 | 186 (8.35) | 148 (8.96) |
| ≥50 to <60 | 524 (23.52) | 392 (23.74) |
| ≥60 to <70 | 738 (33.12) | 555 (33.62) |
| ≥70 to <80 | 531 (23.83) | 382 (23.14) |
| ≥80 to <90 | 192 (8.62) | 140 (8.48) |
| ≥90 | 12 (0.54) | 8 (0.48) |
|
|
||
| Duration of diabetes, yr | 13.01±8.07 | 12.87±7.98 |
|
|
||
| Weight, kg | 67.02±11.78a | 67.70±11.27b |
|
|
||
| BMI, kg/m2 | 25.09±3.50c | 25.25±3.38d |
|
|
||
| BMI groups, kg/m2 | ||
| <18.5 | 20 (1.47) | 11 (1.14) |
| ≥18.5 to <22.0 | 225 (16.56) | 137 (14.15) |
| ≥22.0 to <25.0 | 463 (34.07) | 331 (34.19) |
| ≥25.0 to <30.0 | 534 (39.29) | 406 (41.95) |
| ≥30.0 | 117 (8.61) | 83 (8.57) |
|
|
||
| Prescribed antidiabetic drugs | ||
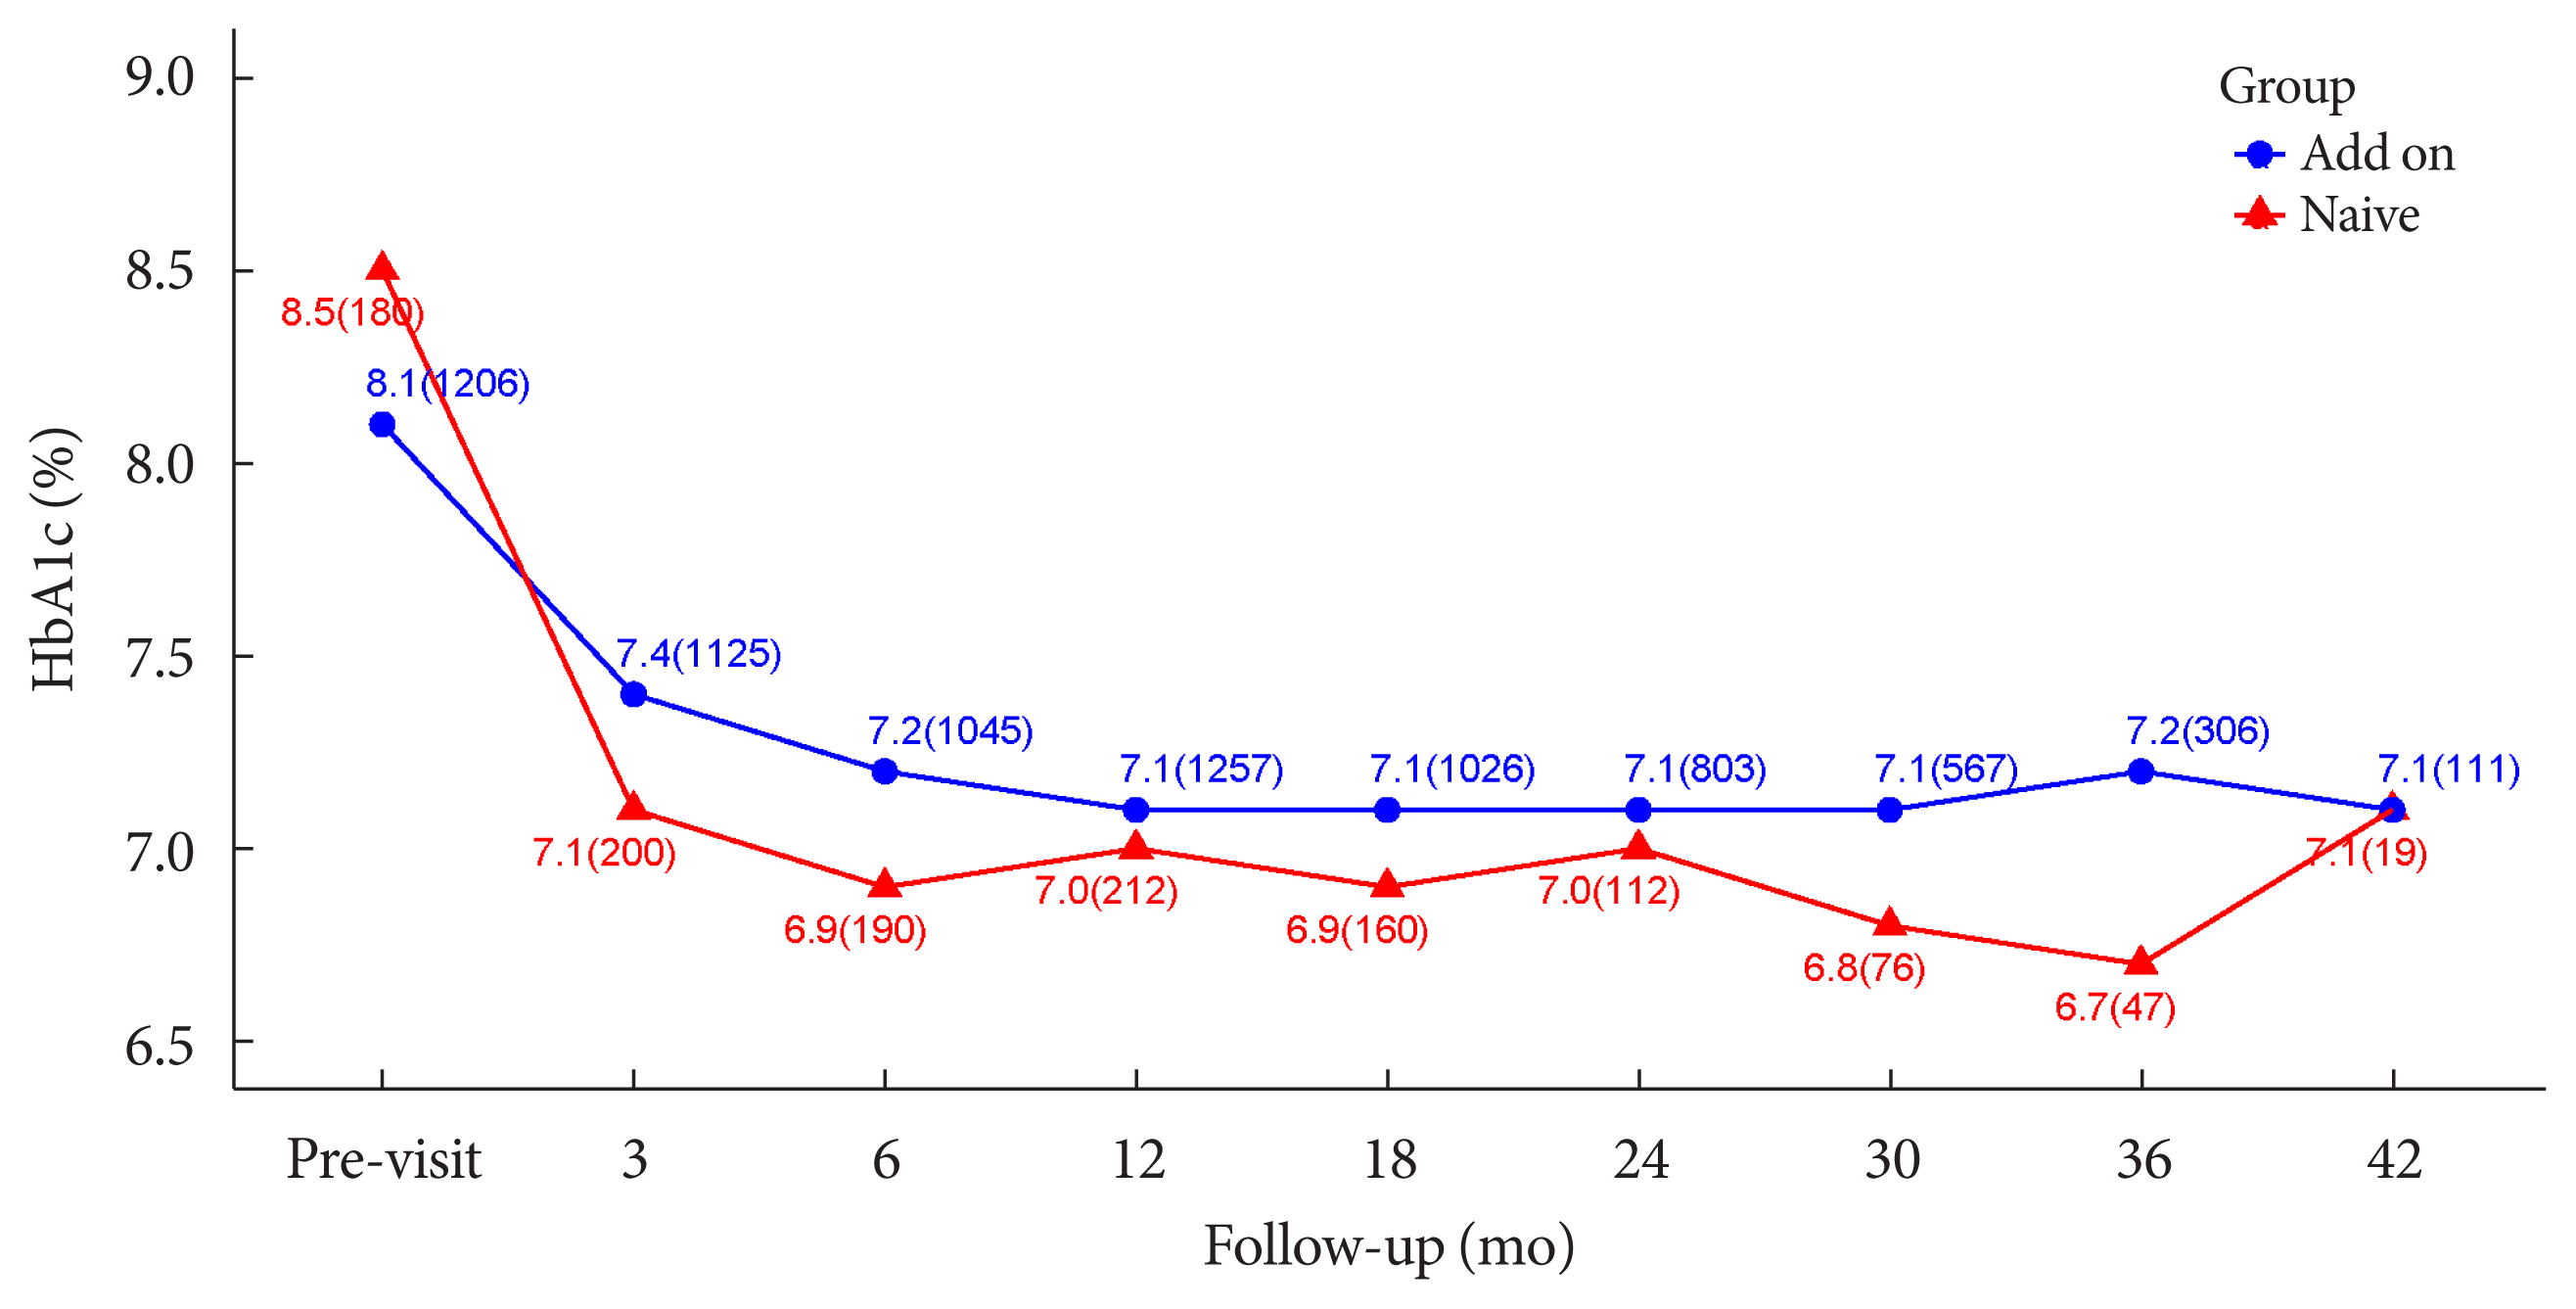
| No (Naïve) | 264 (11.85) | 264 (15.99) |
| Yes | 1,964 (88.15) | 1,387 (84.01) |
| No. of prescribed antidiabetic drugs | ||
| Single class | 384 (17.24) | 226 (13.69) |
| Double classes | 894 (40.12) | 733 (44.40) |
| Triple classes | 642 (28.82) | 410 (24.83) |
| Quadruple classes | 43 (1.93) | 18 (1.09) |
| Quintuple classes | 1 (0.04) | - |
| Types of prescribed antidiabetic drugs | ||
| DPP-4 inhibitors | 1,379 (61.89) | 1,053 (63.78) |
| GLP-1 receptor agonist | 5 (0.22) | 2 (0.12) |
| Insulin | 228 (10.23) | 128 (7.75) |
| Meglitinides | 18 (0.81) | 10 (0.61) |
| Metformin | 1,557 (69.88) | 1,130 (68.44) |
| Pioglitazone | 92 (4.13) | 16 (0.97) |
| Sulfonylurea | 912 (40.93) | 622 (37.67) |
| SGLT-2 inhibitor | 42 (1.89) | 16 (0.97) |
| α-Glucosidase inhibitor | 42 (1.89) | 17 (1.03) |
|
|
||
| History of diabetes complicationsg | ||
| Diabetic foot | 4 (0.18) [4] | 3 (0.18) [3] |
| Diabetic nephropathy | 68 (3.05) [68] | 44 (2.67) [44] |
| Diabetic neuropathy | 312 (14.00) [313] | 219 (13.26) [220] |
| Diabetic retinopathy | 212 (9.52) [212] | 161 (9.75) [161] |
|
|
||
| Liver functiong | ||
| Aspartate aminotransferase | 24.84±10.00e | 24.67±8.69f |
| Alanine aminotransferase | 24.81±14.31e | 26.58±15.19f |
|
|
||
| History of hepatobiliary disordersg,h | 157 (7.05) [172] | 125 (7.57) [133] |
|
|
||
| History of renal failure and impairmentg | 157 (7.05) [160] | 118 (7.15) [120] |
| Acute kidney injury | 5 (0.22) [5] | 4 (0.24) [4] |
| Chronic kidney disease | 146 (6.55) [147] | 109 (6.60) [109] |
| End stage renal disease | 2 (0.09) [2] | 2 (0.12) [2] |
| Renal failure | 4 (0.18) [4] | 4 (0.24) [4] |
| Renal injury | 1 (0.04) [1] | 1 (0.06) [1] |
BMI, body mass index; DPP-4, dipeptidyl peptidase-4; GLP-1, glucagon-like peptide-1; SGLT-2, sodium glucose cotransporter-2.
h Definition of hepatobiliary disorders: alcoholic liver disease, autoimmune hepatitis, bile duct stenosis, bile duct stone, biliary colic, cholangitis, cholecystitis, cholecystitis acute, cholecystitis chronic, cholelithiasis, chronic hepatitis, cirrhosis alcoholic, fatty liver alcoholic, gallbladder polyp, hepatic cirrhosis, hepatic function abnormal, hepatic steatosis, hepatitis, hepatitis alcoholic, hepatorenal syndrome, hepatotoxicity, jaundice, liver disorder, non-alcoholic fatty liver, non-alcoholic steatohepatitis, primary biliary cholangitis, steatohepatitis.
Safety
Table 2
| Variable | Safety set (n=2,228) |
|---|---|
| Weight change, kg | 2.11±3.85a |
|
|
|
| Weight change, % | 3.29±5.85a |
|
|
|
| BMI change, kg/m2 | 0.80±1.45b |
|
|
|
| BMI change, % | 3.28±5.86b |
|
|
|
| Weight increased by more than 5% compared to baseline | |
| No | 1,853 (83.17) |
| Yes | 375 (16.83) |
| Weight change, kg | 6.15±2.81 |
| Weight change, % | 9.61±4.24 |
| BMI change, kg/m2 | 2.35±1.04c |
| BMI change, % | 9.62±4.25c |
| Age, yr | 64.62±11.41 |
| Age group, yrd | |
| <20 | 0 |
| ≥20 to <30 | 2 (18.18) |
| ≥30 to <40 | 5 (15.15) |
| ≥40 to <50 | 30 (16.13) |
| ≥50 to <60 | 76 (14.50) |
| ≥60 to <70 | 131 (17.75) |
| ≥70 to <80 | 96 (18.08) |
| ≥80 to <90 | 34 (17.71) |
| ≥90 | 1 (8.33) |
Table 3
| Variable | Safety set (n=2,228) |
|---|---|
| Any adverse event | 381 (17.10) [623] |
|
|
|
| Aspartate aminotransferase increaseda | 5 (0.22) [5] |
|
|
|
| Alanine aminotransferase increaseda | 6 (0.27) [6] |
|
|
|
| Bronchitis | 2 (0.09) [2] |
|
|
|
| Cancer | |
| Bladder cancer | 0 (0.00) [0] |
| Gastric cancer | 1 (0.04) [1] |
| Lung neoplasm malignant | 1 (0.04) [1] |
| Non-small cell lung cancer | 1 (0.04) [1] |
|
|
|
| Cerebrovascular diseaseb | 18 (0.81) [18] |
|
|
|
| Congestive heart failure | 1 (0.04) [1] |
|
|
|
| Cardiovascular diseasec | 18 (0.81) [19] |
|
|
|
| Constipation | 9 (0.40) [9] |
|
|
|
| Diarrhea | 4 (0.18) [4] |
|
|
|
| Edemad | 44 (1.97) [48] |
| Sexa | |
| Male | 15 (0.67) [16] |
| Female | 29 (1.30) [32] |
|
|
|
| Hypoglycemiae | 55 (2.47) [63] |
| Sex | |
| Male | 30 (1.35) |
| Female | 25 (1.12) |
| Age, yr | 64.78±9.94 |
| Insulin or sulfonylurea administration at occurrence time | |
| No | 7 (0.32) |
| Yes | 48 (2.15) |
|
|
|
| Fracturef | 26 (1.17) [27] |
| Sex | |
| Male | 10 (0.45) |
| Female | 16 (0.72) |
| Age, yr | 72.11±11.92 |
| Age group, yrg | |
| <20 | 0 (0.00) |
| ≥20 to <30 | 0 (0.00) |
| ≥30 to <40 | 0 (0.00) |
| ≥40 to <50 | 1 (0.54) |
| ≥50 to <60 | 3 (0.57) |
| ≥60 to <70 | 6 (0.81) |
| ≥70 to <80 | 7 (1.32) |
| ≥80 to <90 | 8 (4.17) |
| ≥90 | 1 (8.33) |
|
|
|
| Jaundicea | 0 (0.00) [0] |
|
|
|
| Proteinuria | 2 (0.09) [2] |
|
|
|
| Pneumonia | 0 (0.00) [0] |
|
|
|
| Rash | 0 (0.00) [0] |
|
|
|
| Upper respiratory tract infection | 5 (0.22) [5] |
|
|
|
| Urinary tract infection | 4 (0.18) [4] |
|
|
|
| Vomiting | 0 (0.00) [0] |
b Definition of cerebrovascular disease: carotid arteriosclerosis, carotid artery stenosis, cerebral arteriosclerosis, cerebral artery stenosis, cerebral infarction, intracranial aneurysm, migraine, neurodegenerative disorder, syncope, vascular dementia,
c Definition of cardiovascular disease: acute myocardial infarction, angina pectoris, angina unstable, atrial fibrillation, coronary artery disease, coronary artery occlusion, microvascular coronary artery disease, myocardial infarction, tachycardia,
d Definition of edema: face oedema, generalised oedema, oedema, oedema peripheral, lymphoedema, periorbital oedema,
F Definition of fracture: ankle fracture, clavicle fracture, facial bones fracture, femoral neck fracture, femur fracture, foot fracture, fracture, lumbar vertebral fracture, open fracture, pelvic fracture, radius fracture, rib fracture, spinal compression fracture, upper limb fracture, wrist fracture, osteoporotic fracture, pathological fracture,
Efficacy
Effects of lobeglitazone on glucose and lipid parameters
Table 4
| Variable | Efficacy set (n=1,651) | P valuea | |
|---|---|---|---|
|
|
|||
| No. (%) | Mean±SD | ||
| HbA1c, % | |||
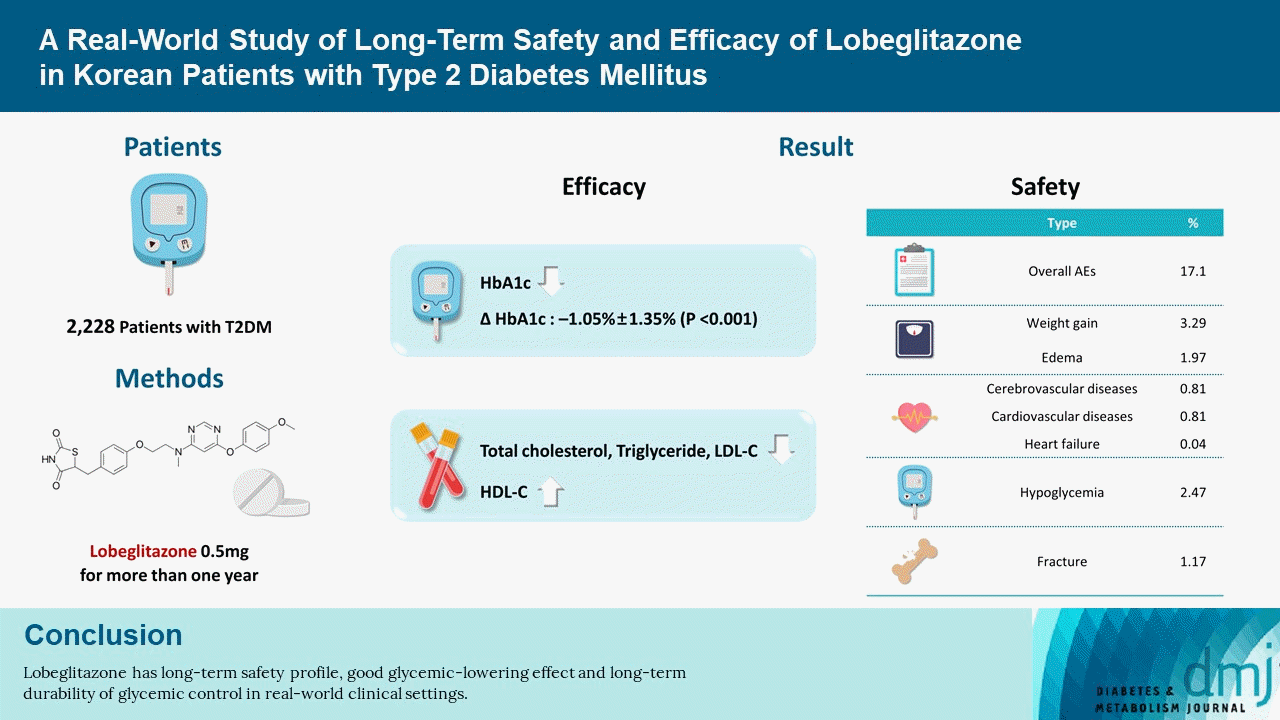
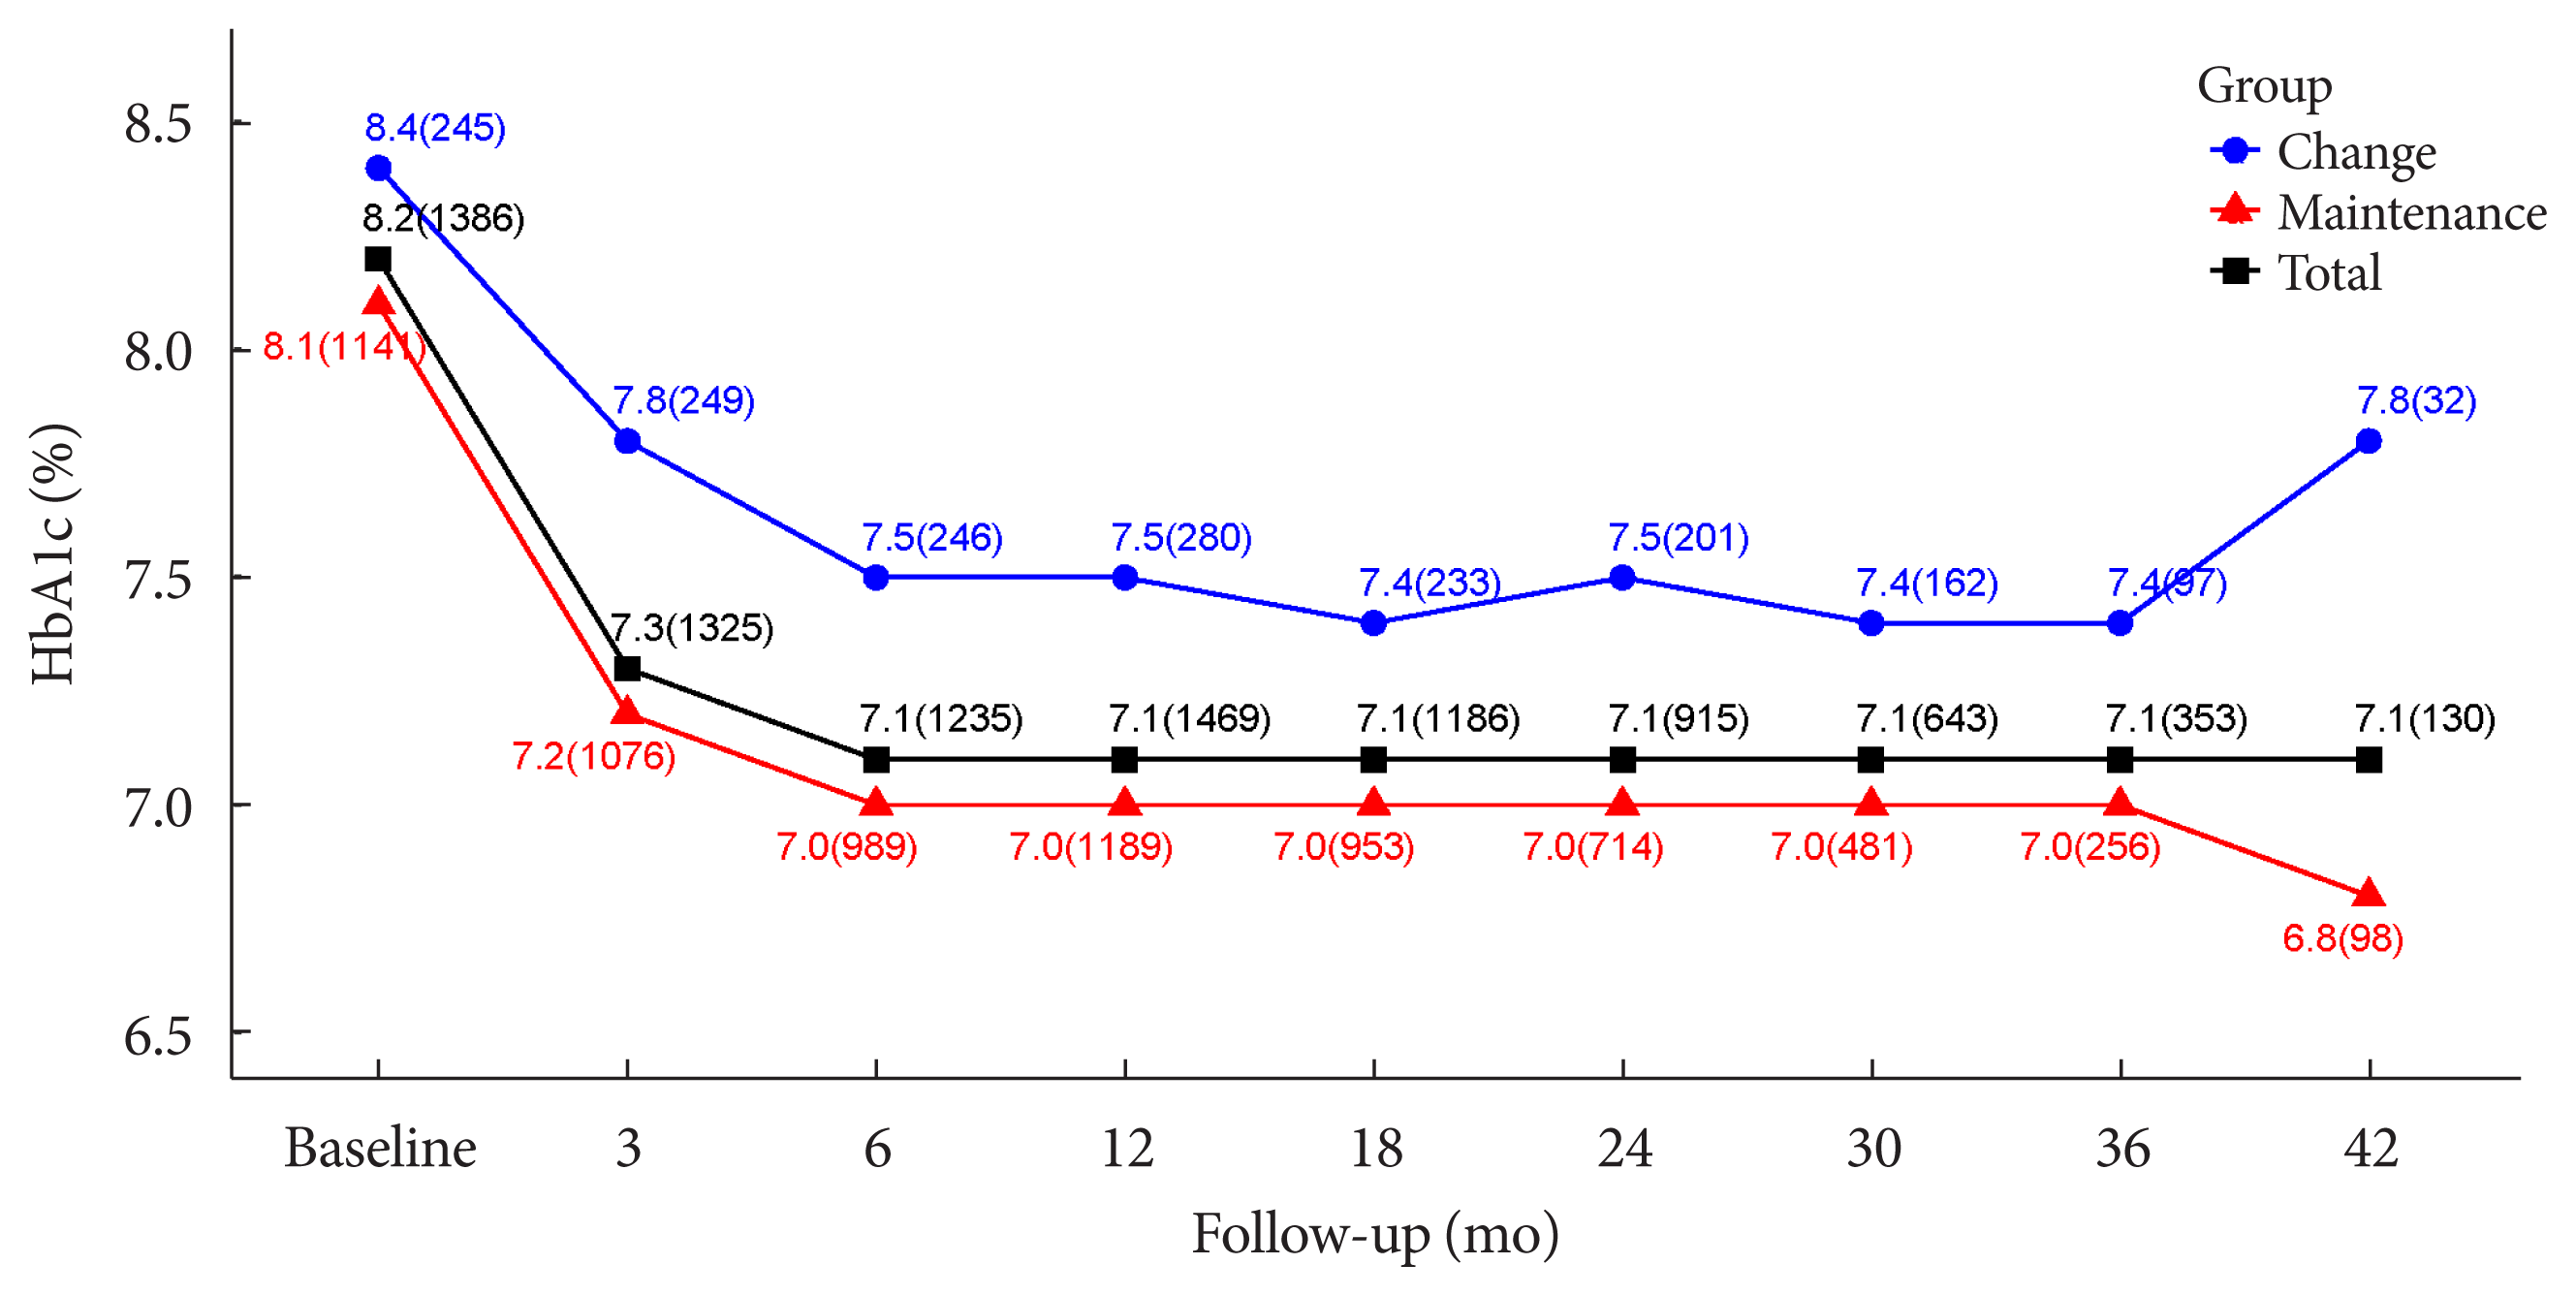
| Baseline | 1,386 (83.95) | 8.17±1.36 | |
| Follow-up | 1,624 (98.36) | 7.12±1.13 | |
| Changes | 1,368 (82.86) | −1.05±1.35 | <0.0001 |
| Changes, % | 1,368 (82.86) | −11.53±14.04 | <0.0001 |
|
|
|||
| Glucose, mg/dL | |||
| Baseline | 1,243 (75.29) | 174.71±58.13 | |
| Follow-up | 1,575 (95.40) | 139.10±44.88 | |
| Changes | 1,211 (73.35) | −34.05±62.00 | <0.0001 |
| Changes, % | 1,211 (73.35) | −14.37±29.89 | <0.0001 |
|
|
|||
| Changes by statin administered, mg/dL | |||
| Not administeredb | |||
| Total cholesterol | 380 (23.02) | −12.54±44.05 | <0.0001 |
| Triglyceride | 356 (21.56) | −31.00±110.98 | <0.0001 |
| LDL-C | 324 (19.62) | −9.49±33.00 | <0.0001 |
| HDL-C | 349 (21.14) | 2.06±10.29 | <0.0001 |
| Administeredc | |||
| Total cholesterol | 491 (29.74) | −4.60±32.72 | 0.0257 |
| Triglyceride | 491 (29.74) | −27.10±83.42 | <0.0001 |
| LDL-C | 445 (26.95) | −5.16±28.26 | 0.0008 |
| HDL-C | 487 (29.50) | 4.15±9.79 | <0.0001 |


 PDF
PDF Citation
 Print
Print


 XML Download