

 PDF
PDF Citation
 Print
Print


INTRODUCTION
Atrial fibrillation (AF) is the most common arrhythmia in the world with a higher prevalence in the aging society, and its clinical significance is increasing.1) AF catheter ablation (AFCA) is the most effective AF rhythm control therapy, which can reduce heart failure mortality, overall deaths or hospitalizations, and the risk of cerebral infarctions or dementia.2)3) However, AF is a chronic degenerative disease that exhibits a continuous progression and long-term recurrence even after a one-year successful outcome.4) Circumferential pulmonary vein isolation (PVI) is the most crucial and effective ablation target of AFCA.5) However, the efficacy of an empirical extra-PV ablation targeting an extra-PV substrate failed to be demonstrated in randomized clinical trials.6) AF rotor ablation using basket catheter mapping has a limitation in its low mapping resolution.7) Ablation of extra-PV triggers, which are the main mechanism of recurrence after a permanent circumferential PV isolation (CPVI), can improve the rhythm outcome, but the provocation, mapping, and ablation techniques for extra-PV triggers still have limitations.
Recently, on-site realistic human AF modeling that reflects the left atrial (LA) anatomy, histology, and electrophysiology is available during AFCA procedures with an improved computational power.8)9) Kim et al.8) and Baek et al.10) reported that a computational modeling-guided AF ablation improves the success rate of a persistent AF (PeAF) ablation as compared to an empirical ablation in the CUVIA-I (118 patients) and II (170 patients) randomized clinical trials. The CUVIA-AF II trial demonstrated an improved PeAF ablation outcome by a computational modeling-guided virtual dominant frequency (DF) ablation.10) While the DF reflects the high-frequency rotational reentries, a high maximal slope of action potential duration (APD) restitution curve (Smax) indicates a vulnerability to AF wave-brake. The APD restitution is associated with the dynamic heterogeneity of the APD.11)12) Thus, a large change in APD with a high Smax makes a circumstance in which a continuous wave-break can be easily sustained.13)14) In the APD restitution curve, the preceding diastolic interval (DI) determines the following APD.13)14) A steep (>1) slope of the APD restitution curve means that a small change of the DI causes a large change in the APD. These large APD oscillations make a difference in the refractoriness between adjacent cardiomyocytes, resulting in a local partial conduction block and sustained wave-break from the reentrant wavefront.13)14) In this study, we aimed to evaluate the effects of a local extra-PV ablation targeting the high Smax in addition to the CPVI. However, the Smax is a cellular electrophysiology index that is clinically challenging to measure, so we localized the Smax by analyzing the clinical voltage map-integrated AF computational modeling.14)15) We designed this multi-center prospective randomized clinical trial by collaboration between the clinical ablation team and simulation team in real-time.
In this multi-center randomized clinical trial, the operator acquired an atrial substrate map, sent the data to the modeling team, and received the outcome of the virtual Smax calculated during the CPVI procedure. We compared the rhythm outcomes of the real-time computational modeling–guided extra-PV Smax ablation and empirical AFCA in patients with non-paroxysmal AF.
METHODS
Ethical statement
The Clinical Usefulness of Virtual Ablation Guided Catheter Ablation of Atrial Fibrillation Targeting Restitution Parameter-Guided Catheter Ablation (CUVIA-REGAB) was a multi-center, prospective, single-blind randomized controlled trial including non-valvular AF patients who were scheduled for AFCA (ClinicalTrials.gov number NCT02558699). The study protocol was approved by the Institutional Review Board of each participating center (The Severance Clinical Research Center, IRB No.: 4-2015-0646) and complied with the principles of the 2013 Declaration of Helsinki. All participants provided written informed consent before the study enrollment. The trial enrollment began in March 2019.
Study population
Patients were eligible if they were i) aged 19–80 years and ii) had documented AF despite more than 6 weeks of antiarrhythmic drug (AAD) treatment or documented AF with intolerance to AADs. The major exclusion criteria were an estimated glomerular filtration rate <30 mL/min, contraindication to anticoagulants, cardiac structural abnormalities that were not suitable to a catheter-based AF ablation procedure, history of major bleeding complications, history of a recurrent ischemic stroke, prior AFCA or Maze surgery, or any other conditions that impeded a cardiac computed tomography (CT) scan.
Group assignment and ablation protocol
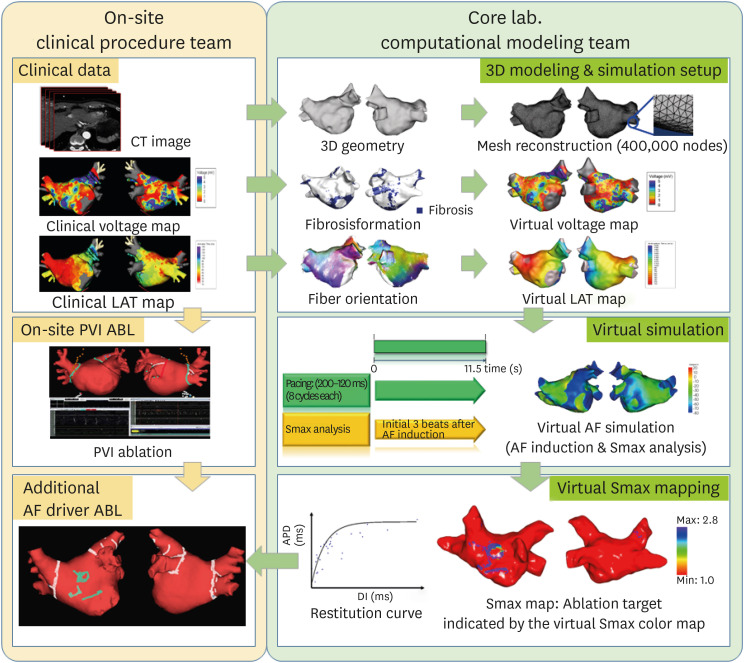
The included patients were randomly assigned to either the virtual Smax simulation (V-Smax) group or empirical ablation (E-ABL) group in a 1:1 ratio. Randomization was performed by a central randomization service independent of the investigators. All patients received anticoagulation before the AFCA for at least 3 weeks. The AADs were discontinued for at least 5 half-lives prior to the procedure. A cardiac CT scan was performed before the procedure and the absence of any LA appendage thrombus was confirmed. During the ablation procedure, a circular mapping catheter and ablation catheter were advanced into the LA via a transseptal access. Three-dimensional (3D) electroanatomic mapping of the LA was performed in both groups using either an Ensite Navx (Abbott, St. Paul, MN, USA) or CARTO (Biosense Webster, Diamond Bar, CA, USA) system. In patients with ongoing AF at the beginning of AFCA procedure, intracardiac electrical cardioversion was performed and electroanatomic mapping was conducted during sinus rhythm or regular atrial pacing. If the cardioversion failed or AF recurred during the substrate mapping, a repeated cardioversion was attempted up to 3 times. If AF recurred before the completion of the substrate mapping despite electrical cardioversion, the patient was excluded from the analysis. A CPVI was conducted first in both groups, and the V-Smax group received additional ablation guided by the virtual Smax map (Figure 1). In patients in whom AF remained after the completion of the recommended high Smax site ablation, electrical cardioversion was conducted and the procedure was finished after sinus conversion. In the E-ABL group, further extra-PV ablation was conducted at the operator’s discretion. The ablation procedure was performed using radiofrequency energy with an open irrigated catheter with a power of up to 40W. In both groups, ablation of the cavo-tricuspid isthmus line was performed at each operator’s discretion.
Computer simulation procedure for an on-site clinical application
The study process in the V-Smax group is shown in Figure 1. At the beginning of the computational modeling procedure, an on-site procedure team acquired the clinical electroanatomical map (voltage map and local activation time [LAT] map) and sent the spatiotemporal data to the core laboratory after integration of the patient’s heart CT imaging. The core laboratory team conducted the simulation study using the patient data obtained from the procedure team while the on-site operators started the CPVI. Merging of the LAT and voltage maps with the CT images were performed by 4 steps: geometry, trimming, field scaling, and alignment.16) The clinical electroanatomical map merged with CT was created to obtain the clinical LAT and voltage maps. We acquired the clinical voltage map that was recorded on the LA during sinus rhythm or regular atrial pacing based on bipolar electrograms. We merged the 3D LA modeling results with CT images of the patient’s heart and then adjusted them with the clinical map.
3D computational modeling of AF and virtual Smax mapping
The detailed description of the 3D computational modeling is provided in the supplemental methods. The LA geometries were reconstructed from the 3D CT digital images and communication in medicine files.9) The virtual LAT and voltage map of the LA were generated and synchronized with the clinical maps using the CUVIA software (Model: SH01; Laonmed Inc., Seoul, Korea). To determine the Smax for each node, the APD of 90% (APD90) and DI were measured during ramp pacing for the duration from the start of the pacing to 3 beats after AF induction. Then the APD restitution curve was determined by employing the relationship between the APD90 and DI, and the Smax was calculated via the maximal slope of the restitution curve, defined at each node of the LA model. The generated Smax map was transmitted to the on-site procedure team for the V-Smax ablation. The region with the highest 10% Smax value was provided by a color-coded Smax map which was normalized between the minimum and maximum V-Smax values of overall nodes for each patient in the V-Smax group. Mean Smax value was 1.00±0.33. We ablated the highest 10% Smax area to minimize the critical mass reduction effects.
Follow up and outcome analysis
The primary study endpoint was a freedom from any atrial tachyarrhythmia recurrence for 12 months. The secondary study endpoints were periprocedural mortality, major bleeding, thromboembolic complications, then procedure time, and total ablation time. Major bleeding was defined as a cardiac tamponade requiring intervention or bleeding events that required a transfusion or resulted in more than a 4 g/dL decrease in the hemoglobin. Post-procedural AADs were used at each operator’s discretion for 3 months after the AFCA, then the AADs were discontinued when there was no recurrent AF. Patients were routinely scheduled to visit our outpatient clinic at 1, 3, 6, and 12 months after the AFCA and every 6 months thereafter. A 12-lead electrocardiogram (ECG) was recorded on every visit, and 24-hour Holter monitoring was performed at 3, 6, and 12 months. After a 3-month blanking period, any AF or atrial tachycardia (AT) recorded on the 12-lead ECG or lasting for more than 30 seconds on the Holter testing was considered a recurrence. All clinical outcomes of interest were confirmed and adjudicated by the central clinical events committee.
Statistical analysis
The sample size was estimated from the recurrence rate derived from the CUVIA-I trial.8) The AF recurrence rates were presumed to be 20% in the Smax simulation group and 40% in the empirical ablation group. An overall sample size of more than 172 was expected to have an 80% power to detect a statistical difference between the 2 groups at a 2-sided alpha of 0.05. For the baseline characteristics, the continuous variables are presented as the mean±standard deviation and were compared using Student’s t-tests. Categorical variables are presented as frequencies with percentages (%) and were compared by the χ2 test or Fisher’s exact test. The cumulative incidence of the primary outcome was estimated by Kaplan-Meier survival curves and compared with the log-rank test. In the overall population, a multivariate Cox proportional hazard regression analysis was used to adjust the risk of the outcome of interest and to identify independent predictors. All variables with p values <0.2 in the univariate Cox regression analysis and other non-significant variables with a proven importance to predict AF recurrence were included in a multivariate Cox proportional hazards regression model. For all 2-tailed comparison, p values <0.05 were considered to indicate statistical significance. All the statistical analyses were performed using SPSS version 25.0 software (SPSS Inc., Chicago, IL, USA).
RESULTS
Baseline characteristics
Among a total of 196 patients with AAD-resistant symptomatic PeAF undergoing catheter ablation, 18 (9.2%) were excluded due to a failed internal cardioversion or 3 episodes of recurrent AF re-initiated during paced atrial substrate mapping, which provided the mandatory electrophysiologic data for our realistic computation modeling (Figure 2). A total of 178 patients were included in the study, including 90 allocated to the V-Smax group and 88 to the E-ABL group. The mean age was 62.2±9.9 years and 131 (73.6%) were male (Table 1). The median AF duration was 31 (15–66) months and the mean CHA2DS2-Vasc score was 2.2±1.3. The mean LA dimension (antero-posterior diameter) was 43.0±6.1 mm, and the left ventricular ejection fraction was 56.6±8.7%. Both groups were well-balanced, and there was no significant difference in the baseline characteristics between the 2 groups.
Figure 2
Study enrollment. Included patients were randomly assigned to receive virtual rotor guided ablation or empirical ablation therapy.
AF = atrial fibrillation; AFCA = atrial fibrillation catheter ablation; E-ABL = empirical ablation; PVI = pulmonary vein isolation; V-Smax = virtual high maximal slope of the action potential duration restitution curve simulation.

Table 1
Baseline clinical characteristics
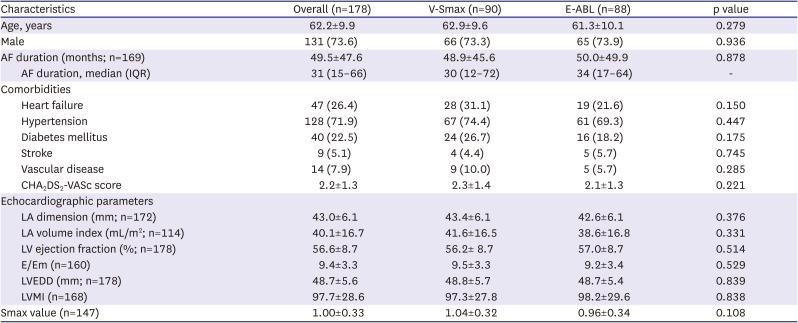
Values are presented as mean±standard deviation or number (%).
AF = atrial fibrillation; E-ABL = empirical ablation; E/Em = mitral inflow velocity/mitral annulus tissue velocity; IQR = interquartile range; LA = left atrial; LV = left ventricle; LVEDD = left ventricle end-diastolic diameter; LVMI = left ventricle mass index; PeAF = persistent atrial fibrillation; Smax = high maximal slope of the action potential duration restitution curve; V-Smax = virtual Smax simulation.
Procedural characteristics
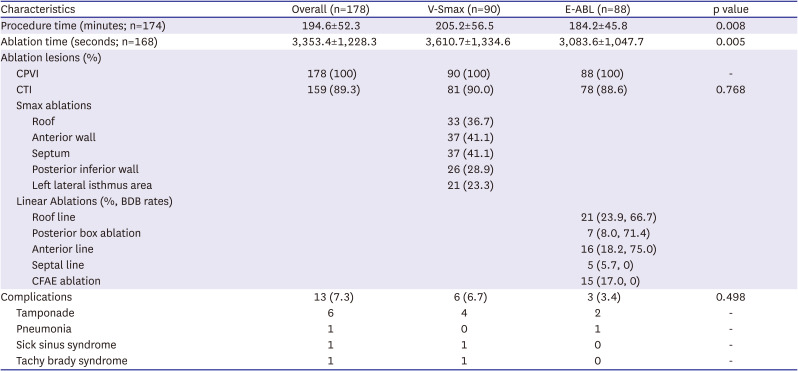
The CPVI was completed in all patients and additional cavo-tricuspid isthmus ablation was performed in 159 (89.3%) patients (Table 2). The mean Smax values were 1.04±0.32 in the V-Smax group and 0.96±0.34 in the E-ABL group (p=0.108). The Smax for the E-ABL was calculated by a post hoc analysis. The high Smax area was located within the low voltage area in 93.5% of the patients and corresponded to the slow conduction zone in 72.3% of the patients. Among the total of 522 high Smax sites, 58.2% were in the areas of disorganized fiber orientation (septum, appendage base, roof of coronary sinus, or PV antrum). In the V-Smax group, additional extra-PV ablation targeting Smax sites was conducted on the roof area (36.7%), anterior wall (41.1%), antero-septum (41.1%), posterior wall (28.9%), and left lateral isthmus area (23.3%), respectively (Table 2, Supplementary Figure 1). In the E-ABL group, extra-PV ablation was conducted for roof line in 23.9%, anterior line in 18.2%, septal line in 5.7%, and posterior box in 8.0% of patients. The bidirectional block rates of the linear ablation were 66.7%, 75.0%, and 71.4% for the roof line, anterior line, and posterior box isolation, respectively. The total procedure time was significantly longer in the V-Smax group than E-ABL group (p=0.008). The major complication rates did not significantly differ between the 2 groups (p=0.498, Table 2). There were 4 cases of intraprocedural cardiac tamponade requiring emergent pericardiocentesis in the V-Smax group. Three of them were developed during CPVI, and the other one was developed during cavo-tricuspid isthmus ablation performed for previously documented atrial flutter. None of the cardiac tamponades were associated with virtual high Smax sites ablation, and all patients were fully recovered.
Table 2
Procedure related characteristics
Procedure outcomes
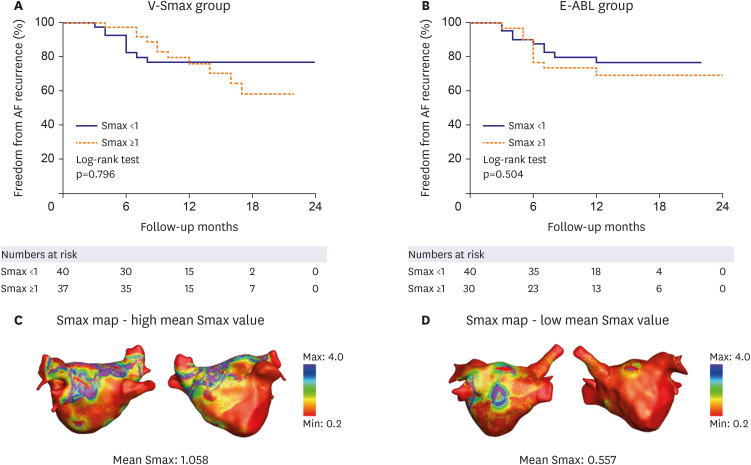
The mean follow-up duration was 12.3± 5.2 months. After the AFCA, AADs were prescribed in 49 patients (27.5%) after 3 months and 84 (47.2%) patients at the final follow-up, without a significant difference between the 2 groups (Table 3). Recurrence of atrial arrhythmias after the blanking period was observed in 23 (25.6%) patients in the V-Smax group and 21 (23.9%) in the empirical ablation group (log rank, p=0.880) (Figure 3A). According to the mode of recurrence, AT recurrences among the overall clinical recurrences were 43.5% in the V-Smax group and 23.8% in the E-ABL group (p=0.169, Table 3). However, the post-AFCA cardioversion rate was significantly higher in the V-Smax group (14.4%) than E-ABL group (5.7%, p=0.027). In patients who were not prescribed any AAD after 3 months, the AF freedom rate was 52/66 (78.7%) in the V-Smax group and 51/63 (80.9%) in the E-ABL group (p=0.776, Figure 3B). In the multivariate analysis, only AF duration and LA volume index were independent predictors for a clinical recurrence (Table 4). The computational modeling-guided Smax ablation was not associated with higher AF freedom. In a sub-group analysis according to the global average of Smax value, the rhythm outcome did not differ between the patients with an Smax ≥1.0 and those with an Smax <1.0 in either the V-Smax group (Log-rank p=0.796) or E-ABL group (p=0.504) (Figure 4A and B). Examples of Smax maps that represent patients with high (≥1) and low (<1) Smax values are shown in Figure 4C and D.
Table 3
Clinical rhythm outcomes
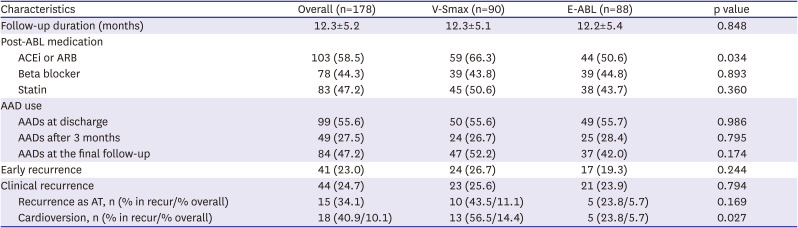
Figure 3
Freedom from AF recurrence in the 2 groups. (A) AF freedom in overall patients. (B) AF freedom in AAD-free patients at 3 months after AFCA.
AAD = antiarrhythmic drug; AF = atrial fibrillation; AFCA = atrial fibrillation catheter ablation; E-ABL = empirical ablation; V-Smax = virtual high maximal slope of the action potential duration restitution curve simulation.
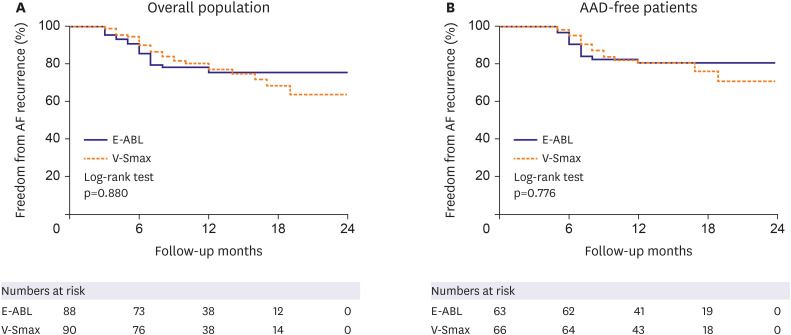
Table 4
Cox regression analysis for clinical recurrence
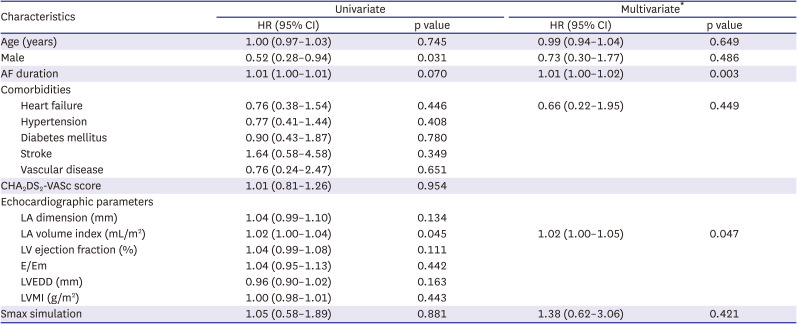
AF = atrial fibrillation; CI = confidence interval; E/Em = mitral inflow velocity/mitral annulus tissue velocity; HR = hazard ratio; LA = left atrial; LV = left ventricle; LVEDD = left ventricle end-diastolic diameter; LVMI = left ventricle mass index.
*Among the variables with p values <0.2 in univariate analyses, LA dimension, LV ejection fraction, and LVEDD were excluded in the multivariate analysis to avoid multicollinearity.
Figure 4
Subgroup analysis according to the Smax level. (A) Freedom from AF in patients with Smax <1 and Smax ≥1 in the V-Smax group. (B) Freedom from AF in patients with Smax <1 and Smax ≥1 in the E-ABL group. Representative virtual Smax maps in patients with high Smax (C) and low Smax (D) values.
AF = atrial fibrillation; E-ABL = empirical ablation; V-Smax = virtual high maximal slope of the action potential duration restitution curve simulation.
DISCUSSION
This multicenter prospective randomized clinical trial evaluated the efficacy of the on-site computational modeling-guided Smax ablation approach in patients with PeAF. Unlike a DF ablation, the V-Smax ablation in addition to the CPVI did not improve the procedure outcomes as compared to an empirical PeAF ablation and rather increased the total procedure time. The on-site application of the realistic computational modeling of AF, which reflects a personalized atrial anatomy, electrophysiology, fibrosis, and fiber orientation, is feasible, but the Smax may not be an appropriate extra-PV ablation target in patients with non-paroxysmal AF.
It has already been confirmed that the CPVI is the most effective target for AFCA, but little is known about its proper extra-PV targets. In the case of non-paroxysmal AF with advanced atrial remodeling, the amount and location of a substrate change varies from patient to patient. Because of these personalized characteristics, all randomized clinical trials that tested for a uniform empirical additional extra-PV ablation beyond the CPVI failed to demonstrate their efficacy.4)6) Since then, a late gadolinium enhancement (LGE) on magnetic resonance imaging (MRI), low voltage area mapping, or catheter mapping of AF drivers by a multi-electrode catheter have been attempted to apply tailored approaches that reflect the patient characteristics.17) However, in the case of an MRI-LGE or low voltage area ablation, the electrophysiological properties of AF were not reflected.18) Roving multi-electrode catheter AF mapping has a limitation in that it is not a synchronized entire chamber AF map, and focal impulse and rotor mapping have a limitation of the low spatial resolution of the basket catheter.
To overcome these problems, we devised a computational modeling-guided AF map.8)9) We tried to find the proper ablation target in the induced virtual AF after integrating the CT-based anatomical information, personalized atrial voltage, and activation information acquired at the beginning of the AFCA procedure into the human AF modeling.16) Since the CUVIA AF modeling is an entire chamber map including the histological information such as fibrosis and the myocardial fiber orientation, it is possible to determine the precise extra-PV ablation target with AF wave dynamics parameters together at more than 400,000 sophisticated nodes.9) The virtual AF map analyzed with the mapping data acquired at the beginning of the procedure can be calculated within about 30–40 minutes of the operator performing CPVI, enabling on-site simulation tests.10) In this study, the Smax, an index representing the AF wave break vulnerability, was extracted by computational modeling and applied to clinical procedures.19)
In general, the Smax is an indicator of the wave break vulnerability, and the DF represents a focal source or focal driver in AF maintenance mechanisms.15) In the CUVIA AF II study, extra-PV DF ablation improved the rhythm outcome of the PeAF ablation,10) but the V-Smax ablation did not affect the ablation outcome in this study. However, it is difficult to assert that the focal source mechanism is the primary mechanism of the AF maintenance rather than a continuous wave break. That is because the degree of meandering of the AF driver changes according to the cellular and tissue electrophysiological conditions of the atrium, and the 2 mechanisms are interchangeable.20) Hwang et al.21) reported an inverse relationship between the Smax and DF, and Park et al. 22) reported that a DF ablation improved the rhythm outcome only in the low Smax patient group in the CUVIA AF2 post hoc analyses. In other words, it means that there is an interaction between the Smax and DF. However, unlike the localized DF sites, the distribution of the Smax was very heterogeneous, making it difficult to target, and it prolonged the procedure time. The V-Smax group had a prolonged procedure time owing to a diffuse ablation time.
It has been 25 years since the procedure called AFCA first started, and the outcome is improving, but it still has a significant long-term recurrence rate.4) Various empirical, histology-based, and rotor tracing extra-PV ablation methods have been tried to reduce the postoperative recurrence in PeAF patients, but none of them have been sufficient to improve the rhythm outcome.4)6) Therefore, it can be expected that the AFCA results will be improved by additionally reflecting the personalized electrophysiologic character of AF. Recently, by utilizing computational modeling, it has become possible to perform procedures considering the electrophysiology and AF mechanisms, as well as the anatomy and histology. Hwang et al.21) compared and evaluated the virtual ablation of the DF, phase singularity, Shannon’s entropy, and complex fractionated atrial electrograms, and showed that the DF ablation had the most effective anti-AF effects, which were also shown in clinical studies.10) In this study, the effect of the Smax ablation reflecting the dynamic heterogeneity of the refractoriness was clinically evaluated. The Smax ablation had an AF defragmentation effect but did not improve the clinical rhythm outcomes. In the future, a more effective patient-customized mechanism-based AFCA using the functional electrophysiology will improve the sophisticated AF mapping and procedural outcomes.
There are several limitations to our study. First, there was no constant protocol for the empirical ablation strategy. There might have been a significant between-center difference in the ablation protocol and procedural outcomes in the E-ABL group. The Smax ablation was performed based on the anatomic area recommended by the computation model, which was not precisely matched in the 3-dimensional electroanatomic maps. The use of AADs after the AFCA was not strictly regulated without any statistical differences between the groups. Because we performed cardioversion to acquire the substrate map, we could not evaluate the AF termination rate during the Smax ablation. Smax could depend on the computational model used. Electrotonic effects, caused by variations in the geometry and fibrosis, may affect Smax but may not be precisely reflected in this personalized modeling. We selected the ablation target by an empirical cutoff of highest 10% Smax area, which was chosen empirically. Although it is not demonstrated in our study, Smax ablation could be potentially proarrhythmic by providing stable anchoring sites for reentrant drivers. The recurrence rate in the E-ABL group was lower (23.9%) than expected (40%) at study designation. Thus the study might not have been adequately powered to detect the efficacy of the virtual simulation guided ablation strategy.
In conclusion, in this multi-center prospective randomized trial, computational AF modeling and virtual ablation targeting a restitution parameter-guided Smax ablation in addition to the CPVI was not associated with an improved arrhythmia freedom expensing longer procedure time than an empirical ablation strategy in patients with PeAF.
 XML Download