Journal List > J Korean Med Sci > v.37(42) > 1516080169

Yun, Kim, Son, Bae, Choi, and Chung: Birth Rate Transition in the Republic of Korea: Trends and Prospects

Abstract

Background

In Korea, the birth rate is declining at an alarming pace. This study aimed to investigate the changes and trends in the population count, number of births, and birth rate in Korea, in the past and future.

Methods

Data regarding the total number of births, crude birth rate, and total fertility rate were collected from the “Statistics Korea Census” of the national statistical portal, census report, and Statistics Korea’s “2020 Population Trend Survey for 1981–2020, provisional results of birth and death statistics.” We used the Organisation for Economic Co-operation and Development 2019 Family Database for the TFR. To develop a better understanding of the data in this study, we classified it according to the modern history of Korea.

Results

The changes and trends in the number of births and fertility rate in Korea, after liberation, were due to the birth control policy that restricted births. In Korea’s low fertility society, which began in the mid-2000s, the fertility rate dropped to below 0.84 in 2020, despite policies to improve the quality of the population. The death toll has reached 300,000, entering an era of population decline.

Conclusion

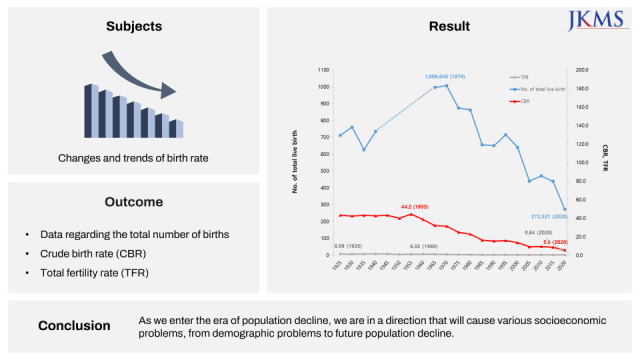
As we enter the era of population decline, we are in a direction that will cause various socioeconomic problems, from demographic problems to future population decline.

Graphical Abstract

jkms-37-e304-abf001.jpg

INTRODUCTION

According to the ‘Preliminary Results of Birth and Death Statistics in 2020,’ published by Statistics Korea, there were 272,337 births in 2020. In 2020, the number of births fell below 300,000 for the first time in South Korea. This year, a decline was observed in the values of both crude birth rate (CBR, 5.3) and total fertility rate (TFR, 0.84), as compared with those in the previous year. Meanwhile, Korea recorded 305,100 deaths per year, which was higher than the number of births, making it the first year in which the population growth rate was recorded as negative.1
In 1983, the TFR decreased to less than 2.1 (population replacement level), which is the fertility rate required to maintain the population. It has continued to fluctuate below 1.3 since 2001 and had further decreased to < 1.0 for the first time in 2018. Korea entered a low fertility society (below 2.1) at a rate of 1.74 in 1984 and entered the lowest-low fertility society (less than 1.3) at a rate of 1.18 in 2002.2 The average TFR of the World Organization for Economic Co-operation and Development (OECD) countries decreased from 2.84 in 1970 to 1.77 in 1995, with it standing at 1.61 in 2019. In 2019, Korea recorded the lowest TFR among OECD countries (0.92).3 In the 2000s, the Korean government implemented several measures to overcome the low fertility rate in society by preparing the 1st (2006–2010), 2nd (2011–2015), and 3rd (2016–2020 including revisions for 2019) Plan for Aging Society and Population in Korea.4567 The final goal of the plan for the aging society and population was to achieve a TFR of 1.5 by 2020. Despite these efforts, the policy to overcome a low fertility society has failed. Accordingly, the 4th plan for an aging society and population (2021–2025) was announced, and it is currently in progress by modifying the goals and methods.8 Changes and trends in the number of births, CBR, and TFR were observed in 1925, and major social and demographic events that caused these changes were analyzed. Further, by comparing the recent birth rates in Korea and the OCED countries, Korea’s standing status was determined. This study aimed to investigate the changes and trends in the population count, number of births, and birth rate in Korea in the past, with the motive of using the findings obtained as the baseline for preparing a plan to overcome the problem of low fertility rates and providing a solution or suggesting a system to tackle the low fertility rates in aging societies.

METHODS

Classification of periods

There have been several big historical events that could affect the population trends such as the Japanese colonial period, and the Korean War. To develop a better understanding of the data of this study, we classified the data according to these events as follows. (Table 1): 1) 1925–1944 (Japanese colonial period), 2) 1945–the 1950s (the national liberation and Korean War), 3) the 1960s, 1970s, 1980s, and 1990s (period of birth control policy), 4) the 2000s, 2010s, and 2020s (the 1st, 2nd, and 3rd plans for low birth rate and aging society in Korea), and 5) post 2020 (long-term demographic prospects) with forecast values.
Table 1

Classification by year and scope of South and North Korea

jkms-37-e304-i001
Year Events Scope of South or North Korea
1925–1945 Japanese colonial era South and North Korea
1945–1950s 1945–1953 (from liberation to the end of the Korean War) South Korea
1953–1959 (after the Korean War)
1960–1990s Period of birth control policy (1961–1995) South Korea
2000–2020s The 1st, 2nd, and 3rd plans for low birth rate and aging society in Korea South Korea
2021–2060 Long-term demographic prospects (from the 4th plan for low birth rate and aging society in Korea) South Korea

Data collection

Data regarding the total population was collected from the “Statistics Korea Census” of the national statistical portal.2910 This study obtained data regarding the total number of births, CBR, and TFR for 1925–1980 from the census report, Statistics Korea’s “2020 Population Trend Survey for 1981–2020, provisional results of birth and death statistics,” census of the national statistics portal, and results of the number of population dynamics and the rate of dynamics.121112 For the TFR of the OECD, the 2019 OECD Family Database was utilized.3

Definition of terms

  • • Census: The complete census of Korea is conducted by Statistics Korea every 5 years.

  • • Total population: There are three types of statistics pertaining to the total population and the population living in a certain area at a certain point in time: census population, resident registration population, and estimated population. Among these, the estimated population corresponds to the official statistics of Korea.

    • - Census population: The number of people counted in the Population and Housing Type Survey conducted by Statistics Korea every five years.

    • - Resident registration population: The population statistics were prepared based on the resident registration report of the Ministry of Public Administration and Security.

    • - Estimated population: The population count is prepared by Statistics Korea by estimating the actual population based on various variables such as birth, death, and population movement, based on the census population.

  • • Mid-year population: The average population at the beginning of the year and the end of the year to be the population as of July 1, the mid-point of the year.

  • • Total live births: Total number of births per year.

  • • CBR: Total Number of Births per 1,000 People = Number of Births in a Specific Year/Mid-Year Population for the Year × 1,000.

  • • TFR: The average number of children expected to be born to one woman of childbearing age (ages 15–49) in her lifetime.

Ethics statement

This study was approved by the Institutional Review Board of Kyung Hee University Hospital at Gangdong and the requirement for informed consent was waived (IRB 2021-11-032).

RESULTS

1925–1944 (from 1925 until the national liberation of Korea from Japan in 1945)

The data for this period shows the sum of South and North Korea (Tables 2 and 3). Furthermore, the data included only Koreans, excluding foreigners (i.e., Japanese). In October 1897, King Gojong renamed the country as the Korean Empire. Following this, during the period of Japanese occupation, Korea was annexed to the Japanese Empire via the Korea-Japan Annexation Treaty of August 1910, which continued until Korea’s liberation in August 1945. The data presented was from 1925 onwards. The data for this period is the sum of the data for the two Koreas, as there was no division between the two Koreas before 1945. However, birth registration data for this period was very poor. We chose the method of estimating the CBR and TFR based on the age ratio between the 0–4-year-old population and the 15–49-year-old mothers (child-woman ratio), which was obtained from the national census.9
Table 2

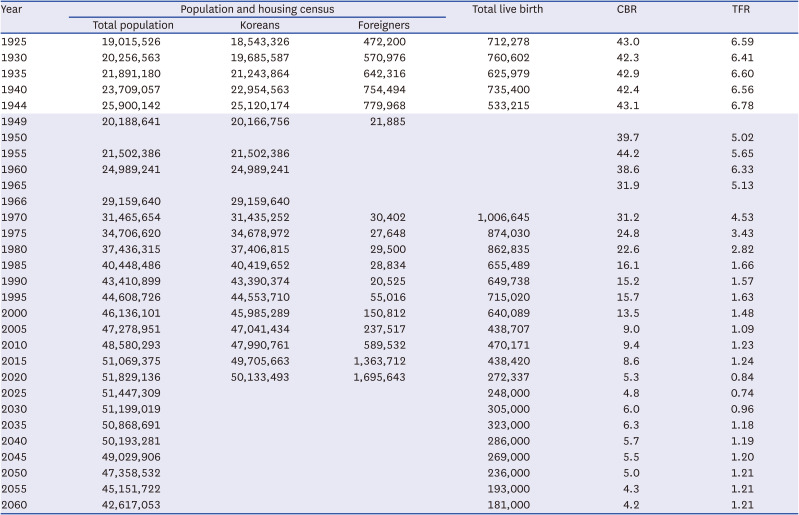
Number of population, total live birth, CBR, and TFR

jkms-37-e304-i002
Year Population and housing census Total live birth CBR TFR
Total population Koreans Foreigners
1925 19,015,526 18,543,326 472,200 712,278 43.0 6.59
1930 20,256,563 19,685,587 570,976 760,602 42.3 6.41
1935 21,891,180 21,243,864 642,316 625,979 42.9 6.60
1940 23,709,057 22,954,563 754,494 735,400 42.4 6.56
1944 25,900,142 25,120,174 779,968 533,215 43.1 6.78
1949 20,188,641 20,166,756 21,885
1950 39.7 5.02
1955 21,502,386 21,502,386 44.2 5.65
1960 24,989,241 24,989,241 38.6 6.33
1965 31.9 5.13
1966 29,159,640 29,159,640
1970 31,465,654 31,435,252 30,402 1,006,645 31.2 4.53
1975 34,706,620 34,678,972 27,648 874,030 24.8 3.43
1980 37,436,315 37,406,815 29,500 862,835 22.6 2.82
1985 40,448,486 40,419,652 28,834 655,489 16.1 1.66
1990 43,410,899 43,390,374 20,525 649,738 15.2 1.57
1995 44,608,726 44,553,710 55,016 715,020 15.7 1.63
2000 46,136,101 45,985,289 150,812 640,089 13.5 1.48
2005 47,278,951 47,041,434 237,517 438,707 9.0 1.09
2010 48,580,293 47,990,761 589,532 470,171 9.4 1.23
2015 51,069,375 49,705,663 1,363,712 438,420 8.6 1.24
2020 51,829,136 50,133,493 1,695,643 272,337 5.3 0.84
2025 51,447,309 248,000 4.8 0.74
2030 51,199,019 305,000 6.0 0.96
2035 50,868,691 323,000 6.3 1.18
2040 50,193,281 286,000 5.7 1.19
2045 49,029,906 269,000 5.5 1.20
2050 47,358,532 236,000 5.0 1.21
2055 45,151,722 193,000 4.3 1.21
2060 42,617,053 181,000 4.2 1.21
CBR = crude birth rate, TFR = total fertility rate.
Table 3

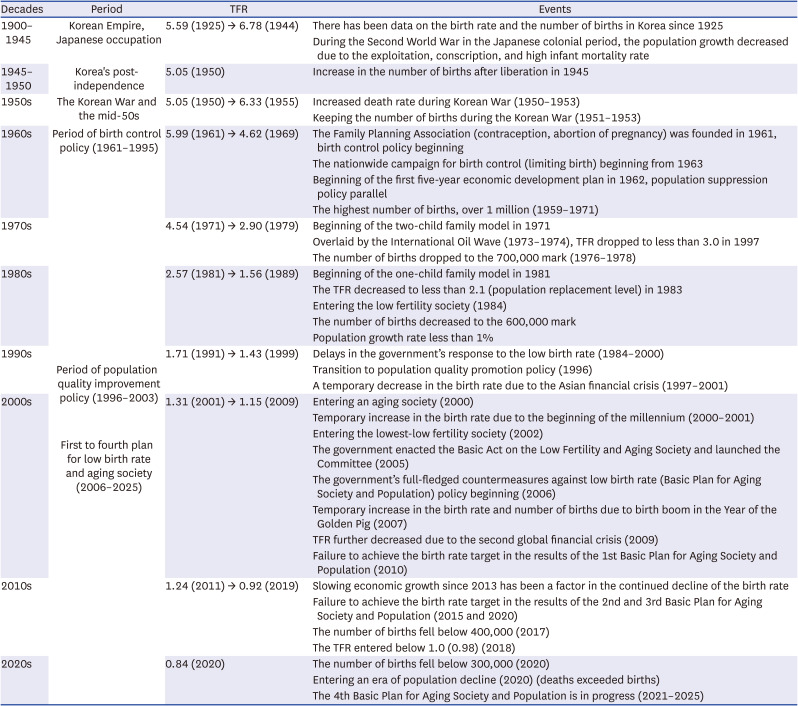
Brief summary of history and events related to birth rates in Korea (1900–2020)

jkms-37-e304-i003
Decades Period TFR Events
1900–1945 Korean Empire, Japanese occupation 5.59 (1925) → 6.78 (1944) There has been data on the birth rate and the number of births in Korea since 1925
During the Second World War in the Japanese colonial period, the population growth decreased due to the exploitation, conscription, and high infant mortality rate
1945–1950 Korea's post-independence 5.05 (1950) Increase in the number of births after liberation in 1945
1950s The Korean War and the mid-50s 5.05 (1950) → 6.33 (1955) Increased death rate during Korean War (1950–1953)
Keeping the number of births during the Korean War (1951–1953)
1960s Period of birth control policy (1961–1995) 5.99 (1961) → 4.62 (1969) The Family Planning Association (contraception, abortion of pregnancy) was founded in 1961, birth control policy beginning
The nationwide campaign for birth control (limiting birth) beginning from 1963
Beginning of the first five-year economic development plan in 1962, population suppression policy parallel
The highest number of births, over 1 million (1959–1971)
1970s 4.54 (1971) → 2.90 (1979) Beginning of the two-child family model in 1971
Overlaid by the International Oil Wave (1973–1974), TFR dropped to less than 3.0 in 1997
The number of births dropped to the 700,000 mark (1976–1978)
1980s 2.57 (1981) → 1.56 (1989) Beginning of the one-child family model in 1981
The TFR decreased to less than 2.1 (population replacement level) in 1983
Entering the low fertility society (1984)
The number of births decreased to the 600,000 mark
Population growth rate less than 1%
1990s 1.71 (1991) → 1.43 (1999) Delays in the government’s response to the low birth rate (1984–2000)
Period of population quality improvement policy (1996–2003) Transition to population quality promotion policy (1996)
A temporary decrease in the birth rate due to the Asian financial crisis (1997–2001)
2000s 1.31 (2001) → 1.15 (2009) Entering an aging society (2000)
First to fourth plan for low birth rate and aging society (2006–2025) Temporary increase in the birth rate due to the beginning of the millennium (2000–2001)
Entering the lowest-low fertility society (2002)
The government enacted the Basic Act on the Low Fertility and Aging Society and launched the Committee (2005)
The government’s full-fledged countermeasures against low birth rate (Basic Plan for Aging Society and Population) policy beginning (2006)
Temporary increase in the birth rate and number of births due to birth boom in the Year of the Golden Pig (2007)
TFR further decreased due to the second global financial crisis (2009)
Failure to achieve the birth rate target in the results of the 1st Basic Plan for Aging Society and Population (2010)
2010s 1.24 (2011) → 0.92 (2019) Slowing economic growth since 2013 has been a factor in the continued decline of the birth rate
Failure to achieve the birth rate target in the results of the 2nd and 3rd Basic Plan for Aging Society and Population (2015 and 2020)
The number of births fell below 400,000 (2017)
The TFR entered below 1.0 (0.98) (2018)
2020s 0.84 (2020) The number of births fell below 300,000 (2020)
Entering an era of population decline (2020) (deaths exceeded births)
The 4th Basic Plan for Aging Society and Population is in progress (2021–2025)
TFR = total fertility rate.
Its population exceeded 20 million, rising from 19,015,526 in 1925 to 20,256,563 in 1930. In 1944, there were 25,900,142 people. The total number of births exceeded 700,000 during this period, rising from 712,278 in 1925 to 760,602 in 1930.
The CBR was 43.0 in 1925 and 42.9 in 1935, level being in the 40s. The TFR was within the six ranges during this period.

1945–1950s (starting from the national liberation of Korea from Japan to the 1950s)

The data for this period was only for South Korea and did not include North Korea (Tables 2 and 3). This period was further classified into the following two periods.
In 1949, the population was 20,188,641. During the Korean War (June 1950 to July 1953), it was difficult to ascertain the population at the beginning of the war. However, it increased to 20,526,705 in 1952, 21,546,248 in 1953, and 21,502,386 in 1955, as compared with that in 1949. There are no data on the total number of births during the Korean War. The CBR and TFR were 39.7 and 5.02 in 1950 and increased to 44.2 and 5.65 in 1955, respectively.

1960s, 1970s, 1980s, and 1990s

After the Korean War, from 1961 to 1971, the total number of births exceeded 1 million (Tables 2 and 3). Accordingly, in 1961, the government began to develop a family planning project, a policy to suppress population growth, which started in earnest in 1962. Birth control continued in the 1970s and 1980s. The effects of the international oil shock of the late 1970s and the early 1980s also affected the low fertility societies. As such, in 1983, the TFR dropped to 2.06, below 2.1.
Table 2 shows the country’s population at that time. With a population of 24,989,241 in 1960, it rose to 29,159,640 in 1966 and further increased to 31,465,654 in 1970. The population increased further in the following years, with 40,448,486 in 1985 and 43,410,899 in 1990. In 1970, the total number of births was 1,006,645, entering the 1 million mark. Subsequently, a decreasing trend was observed. While the total number of births in a year increased to 700,000s during 1991–1995, it decreased again and hit the 600,000s mark during 1996–2000.
The CBR decreased from 44.2 in 1955 to 38.6 in 1960 to 31.9 in 1970. It further decreased from 24.8 in 1975 to 22.6 in 1980 and from 16.1 in 1985 to 15.7 in 1995, showing a remarkable continuous decrease (64%) from 44.2 to 15.7 in approximately 40 years. The TFR also decreased continuously, with it being 5.0–7.0 in the 1960s, to 3.0–5.0 in the 1970s, to 1.0–3.0 in the 1980s, and 1.0–2.0 in the 1990s. The fall from 6.33 in 1960 to 1.63 in 1995 indicates a remarkable continuous decrease (74%).

2000s, 2010s, and 2020s

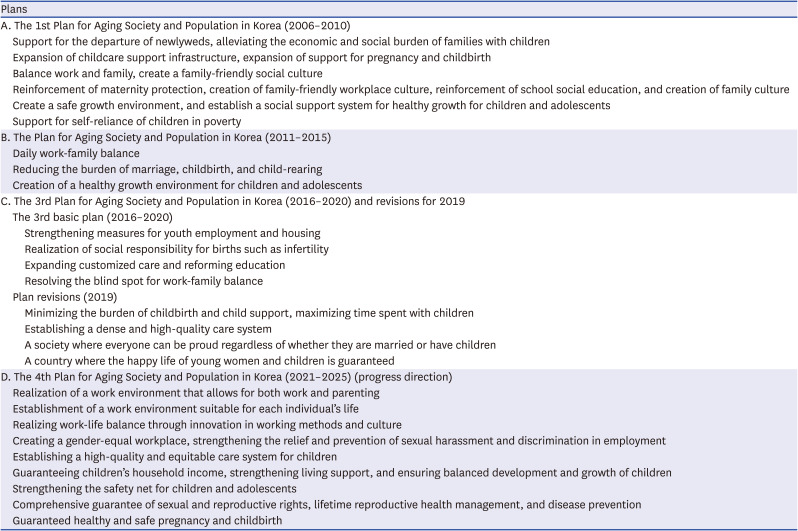
After abolishing the birth control policy in 1996, as described above, in 2000, the government prepared the 1st (2006–2010), 2nd (2011–2015), and 3rd (2016–2020) plan for the aging society and population (Tables 2, 3, and 4). These were prepared to help Korean society overcome the low fertility rate. In addition, the government implemented several schemes. Table 2 presents the country’s population at that time. The number increased from 46,136,101 in 2000 to 51,829,136 in 2020, which was a gradual increase. However, the total number of births decreased from 640,089 in 2000 to 272,337 in 2020, and it further decreased to 400,000 during 2005–2015, finally falling below 300,000. Over the past 20 years, there has been a significant decrease in the total number of births (57%), from 640,089 in 2000 to 272,337 in 2020. When comparing the number of births in 1970, when the total number of births was the highest, with those in 2020, they decreased by approximately 73%.
Table 4

Policies already implemented (2006–2020) and future (2021–2025) plans to overcome the low birth rate in Korea

jkms-37-e304-i004
Plans
A. The 1st Plan for Aging Society and Population in Korea (2006–2010)
Support for the departure of newlyweds, alleviating the economic and social burden of families with children
Expansion of childcare support infrastructure, expansion of support for pregnancy and childbirth
Balance work and family, create a family-friendly social culture
Reinforcement of maternity protection, creation of family-friendly workplace culture, reinforcement of school social education, and creation of family culture
Create a safe growth environment, and establish a social support system for healthy growth for children and adolescents
Support for self-reliance of children in poverty
B. The Plan for Aging Society and Population in Korea (2011–2015)
Daily work-family balance
Reducing the burden of marriage, childbirth, and child-rearing
Creation of a healthy growth environment for children and adolescents
C. The 3rd Plan for Aging Society and Population in Korea (2016–2020) and revisions for 2019
The 3rd basic plan (2016–2020)
Strengthening measures for youth employment and housing
Realization of social responsibility for births such as infertility
Expanding customized care and reforming education
Resolving the blind spot for work-family balance
Plan revisions (2019)
Minimizing the burden of childbirth and child support, maximizing time spent with children
Establishing a dense and high-quality care system
A society where everyone can be proud regardless of whether they are married or have children
A country where the happy life of young women and children is guaranteed
D. The 4th Plan for Aging Society and Population in Korea (2021–2025) (progress direction)
Realization of a work environment that allows for both work and parenting
Establishment of a work environment suitable for each individual’s life
Realizing work-life balance through innovation in working methods and culture
Creating a gender-equal workplace, strengthening the relief and prevention of sexual harassment and discrimination in employment
Establishing a high-quality and equitable care system for children
Guaranteeing children’s household income, strengthening living support, and ensuring balanced development and growth of children
Strengthening the safety net for children and adolescents
Comprehensive guarantee of sexual and reproductive rights, lifetime reproductive health management, and disease prevention
Guaranteed healthy and safe pregnancy and childbirth
The CBR was 13.5, 9.0, 8.6, and 5.3 in 2000, 2005, 2015, and 2020, respectively, indicating a significant decline. When comparing the CBR of 1960, when CBR was the highest, with that of 2020, the CBR value declined by approximately 88%. The TFR continued to decrease. It was 1.48 in 2000, 1.23 in 2010, and from 2018 onwards, the value was 1.0 or lesser. The TFR was 0.98, 0.92, and 0.84 in 2018, 2019, and 2020, respectively. From 2018 onwards, every woman of childbearing age had one or no child in her lifetime'.

Population forecast for the period post 2020 (2021–2060)

To overcome the low fertility rate, the 4th (2021–2025) plan for an aging society and population is currently being implemented (Tables 2 and 4). Table 2 shows the population projections for Korea from 2021 to 2060. It is forecasted that the population will increase from 51,744,876 in 2021 to 51,199,019 in 2030, following which it will begin to decrease to 50,868,691 in 2035, and in 2060, 40 years from now, it is predicted that the number will further decrease to 42,617,053. The total number of births has been forecasted to increase from 261,000 in 2021 to 305,000 in 2030, and following this, it is expected to gradually decrease, with an estimated number of 181,000 in 2060. The CBR is estimated to increase from 5.0 in 2021 to 4.2 in 2060, and the TFR is estimated to increase from 0.82 in 2021 to 1.21 in 2060.

Comprehensive graph of the trend in the total live births, CBR, and TFR (1925–2020)

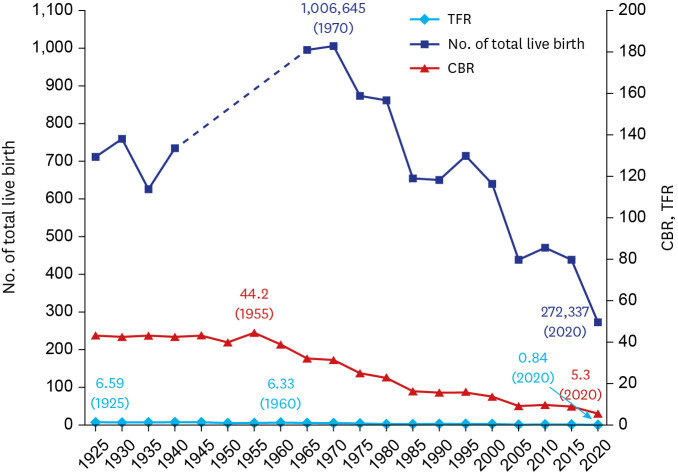
The comprehensive graph of the changes in the trends of total live births, CBR, and TFR in Korea for the past 100 years from 1925 to 2020 is shown in Fig. 1. The total number of births was highest in 1960 at 1,080,535, decreasing to 272,337 in 2020. The CBR also peaked at 44.2 in 1955, decreasing to 5.3 in 2020. The TFR decreased from 6.78 in 1944 to 0.84 in 2020. Thus, there was a continuous and significant decline in the total live births, CBR, and TFR.
Fig. 1

Comprehensive graph of changes in the trends of total live births, CBR, and TFR in Korea for the past 100 years from 1925 to 2020.

CBR = crude birth rate, TFR = total fertility rate.
jkms-37-e304-g001

Comparison of the TFRs of OECD countries

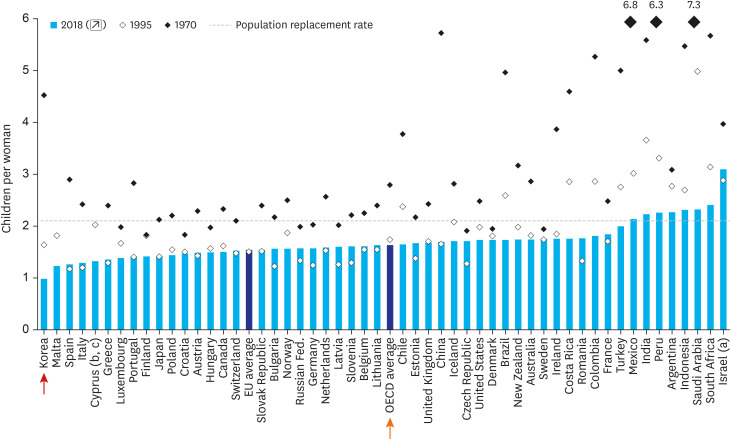
A comparison of the TFRs of the OECD countries in 2018 is shown in Fig. 2. The average TFR decreased from 2.79 in 1970 to 1.74 in 1995, with a further decrease to 1.63 in 2018. In 2018, Korea (0.98) had the lowest TFR among the 37 OECD countries. Korea was the only country with a score below 1.0 (Israel has the highest TFR at 3.09, while the average European TFR is 1.53).
Fig. 2

Comparison of the TFRs of OECD countries in 2018.

TFR = total fertility rate.
jkms-37-e304-g002

DISCUSSION

Based on the above results, the changes and trends in the population count, birth rate, and number of births in Korea during the past 100 years, from 1925 to 2020, were examined. In this discussion: 1) using the statistics mentioned above, we examine the changes in the history and events of the relevant past that affected the changes in the birth rate, 2) we review the causes and countermeasures of the low fertility society problem, which is currently emerging as a serious demographic, social, and economic problem in Korea, and 3) we determine the meaning of the statistically predicted estimates up to the year 2065. To explain the relationship between the history and events related to the changes in the fertility rate of Korea, this study divided the modern history of Korea into the following periods: 1) the Korean Empire and Japanese colonial period, 2) period of liberation, 3) Korean War and the late 1950s, 4) period of birth control policy (1961–1995), 5) period of population quality improvement policy (1996–2003), and 6) period of the 1st, 2nd, 3rd, and 4th plan for an aging society and population (2005–2025).
Looking at the Korean Empire and Imperial Japan’s forced occupation period, in 1897, Emperor Gojong proclaimed the name of Korea as the Korean Empire, and in 1910, the annexation of Korea to Japan began. Statistical data for this era include the national census, the current state census, and the data of the dynamics survey based on reports of births and deaths,9 most of which were based on estimates. As is usually the case with the colony’s demographics, the current state census was compiled primarily based on a police census. Compared with the year 1925, the total population increased significantly in the 1940s, which may have been due to the initiation of the food rationing system, and the number of undeclared births that were reported all at once. The TFR during the Japanese colonial period was 6.0–7.0, a period when the infant mortality rate was high; as a result, the population growth was negligible. With World War II breaking out in 1939, Japan’s severe exploitation and forced labor at the end of the Japanese colonial period reduced the number of births in Korea from 600,000 to 500,000. With the liberation of Korea in 1945, the number of births increased from 590,000 in 1946 to 630,000–680,000 in 1947–1950. The TFR in 1950 was 5.05. During the Korean War period and the late 1950s, even during the Korean War of 1950–1953, the number of births decreased slightly to 630,000 in 1950 but remained at 670,000–770,000 during 1951–1953. In 1955, the TFR was 6.33, and the population decreased significantly owing to a sharp increase in the death rate during the war. The period from 1961 to 1995 was the period of birth control policy. In 1961, the Korean Family Planning Association was founded, and the birth control policy began. In 1963, a nationwide movement to promote family planning (birth control) projects began. The slogans of 1961 gave birth to moderation, “let’s raise well, have little, raise well,” and in 1966, the three-child movement was set into motion (3.3.35 principle, let’s have three children before the age of 35). In the process of the TFR, which began in 1962, the population growth suppression policy was strongly pursued (this 5-year economic development plan was the 7th and continued until 1996). At that time, the government distributed free contraceptives to public health centers across the country to suppress childbirth. The vasectomy was also free of charge.
While the TFR decreased from 5.99 in 1961 to 4.62 in 1969, the number of births each year was over one million during 1959–1971, and this period recorded the highest number of births in Korean history. In 1971, the two-childbearing movement was launched, and in the mid-to-late 1970s, the birth control policy overlapped with the international oil shock (1973–1974). During 1977–1979, the TFR ranged from 2.99–2.90, entering the second era, and the number of births during 1976–1978 decreased to 700,000.
Family planning (birth control) was continued in the years 1981–1989. In 1981, the slogan raised was “one well-raised daughter out-envies ten sons,” in 1983, the slogan was “two’s too much.” During 1979–1982, the number of births remained in the mid-to-late 800,000 range. In 1983, it entered the population replacement level, defined as less than TFR 2.1. Since 1984, Korea entered an era of low fertility (TFR 1.76), with the number of births decreasing to 600,000, and the population growth rate being < 1%. In 1989, free contraceptive services were stopped, and family planning (birth control) was somewhat relaxed. In the 1990s, although the era of a low fertility society was not yet in full swing, the government abandoned this policy in 1994, 32 years after the birth control policy was introduced. Following this, Korea witnessed a period of “Population Quality Improvement Policy,” which started in 1996 and ended in 2003. During this period, despite the entry into the era of a low fertility society in 1984, until the early 2000s, the government and other social circles were not aware of the seriousness of the low fertility society, and the policy response was delayed due to the inertia of the long-term population suppression policy.
In the 2000s, the TFR rebounded briefly between the years 2000 and 2001, ranging from 1.48 to 1.31, due to the start of the 2000 millennium boom. In 2002, it entered the era of the lowest-low fertility society (TFR less than 1.3) (January 18, 2002). This was the period when Korea’s seriously low fertility society began in earnest. In 2000, the elderly constituted 7.2% of the total population and entered the phase of being an aging society, a critical problem that is demographically second to that of the low fertility society. In the 2000s, there was an increase in infertility, avoidance of marriage, and avoidance of pregnancy. An increase in the age of pregnancy and giving birth emerged as the major cause of low fertility. In 2004, the government set the issue of the low fertility rate in the aging society on the national agenda, after realizing its seriousness. In 2005, the government enacted the Basic Act on the Low Fertility and Aging Society, launched a related committee, and took full-fledged countermeasures for the low fertility society policy. It began with the 1st plan for a low birth rate and an aging society (2006–2010) announced in 2005. Although the TFR (1.26) and the number of births (490,000) increased temporarily due to the birth boom in 2007, the “Year of the Golden Pig,” it was temporary. Although the 1st plan for the aging society and population was implemented with the goal of improving the TFR from 1.08 in 2005 to 1.61 (OECD average) in 2010, it failed to achieve the goals. Korea’s TFR decreased to 1.15 due to the second global financial crisis that occurred in 2009.
The government implemented the 2nd plan for the aging society and population in 2015 with the goal of restoring the TFR to the OECD average in 2016–2030. However, it failed to achieve the target (TFR was 1.24 in 2015). Since 2013, the TFR has continuously decreased, along with a slowdown in global economic growth. Even worse, the number of births declined below 400,000 (350,000) in 2017, and the TFR went below 1.0 (0.98) in 2018.
In the announcement of 2020, the last year of the 3rd plan for the aging society and population, the target was to increase the TFR from 1.21 in 2014 to 1.50 in 2020, however, it failed to achieve this target (TFR 0.84 in 2020). According to the 2020 statistics, the number of births fell below 300,000 (270,000), following the fall of 400,000 in 2017. Korea entered an era of population decline, recording 300,000 deaths in three years. We reached the age of the population cliff.
The government established the 4th Plan for Aging Society and Population in 2021 to shift the goal of resolving the low fertility society from fertility-oriented policies to policies that improve the quality of life of all generations, emphasizing the integration and solidarity of classes and generations, but it did not present specific TFR target figures for 2025.
The causes analyzed in the 1st and 2nd plans for the aging society and population (2005, 2011), which were announced in 2005 and 2010, include an increase in the age of marriage, avoidance of childbirth, delay in marriage and childbirth due to income and employment instability, difficulty in reconciling work and family, lack of childcare system and infrastructure, increase in the burden of raising children, change in values regarding marriage and children, and changes in traditional values, such as family succession. According to the 4th plan for the aging society and population (2021), the causes of a low fertility society were: increased labor market disparities and precarious employment, intensifying competition for employment, intensifying competition for education, single-to-late marriage factors, rise in housing prices, increase in housing costs, decrease in consumer spending capacity, gender discrimination in the labor market, difficulties in work-family balance, increase in dual-income, care gap in the care infrastructure system due to an increase in the demand for care (a situation in which working parents have no place to leave their children after childbirth), decrease in the marriage rate, change in the conception of marriage and family, and changes in the composition of family, which is rapidly progressing. Ultimately, various factors, such as social and institutional factors of employment, childcare, housing, labor, and care; awareness and practice of marriage, pregnancy, and childbirth; aging of women who give birth; and a decrease in the number of births, are complicated. Finding a solution to this problem has emerged as an important task.
Measures and efforts to overcome the above-mentioned lowest-low fertility society were already drafted in the policy implemented in 2006. However, the results were unsatisfactory. Although the 1st, 2nd, and 3rd rounds witnessed the investment of a high budget and the implementation of several measures, the results were a failure. As a result, the following 4th plan was formulated and is currently being implemented.
The direction of the 4th Plan for Aging Society and Population (2021–2025), which is the most recent one, implies the following: 1) change in the basic perspective (focus on improving the quality of life of ‘individuals,’ balanced approach and practice of investment in family support and social structural innovation); 2) guarantee of enjoyment of individual rights in response to aging in the low fertility society (transition to a society where we work together and care for each other, guarantee basic rights to children, ensure there are comprehensive sexual and reproductive rights, and strengthen the medical support for pregnancy and childbirth along the life cycle); and 3) improvement in the nation and society’s ability to respond to demographic changes (reinforcement of education-training and life-based foundations where everyone’s capabilities can be exercised, innovation towards an integrated society in response to the new normal of demographic change, etc.).
To put the policies into practice, the plan attempts to create a society where: people work together and take care of each other (work-life balance enjoyed by all: realization of a work environment that allows work-parenting, establishment of a work environment that harmonizes with an individual’s life/work-life balance through work style, and facilitation of cultural innovation); there is gender-equal working society (creating a gender-equal workplace, strengthening the relief and prevention of sexual harassment and gender discrimination in employment/improving the quality of jobs in the field of intensive care work for women); there is reinforcement of social responsibility for child care (establishing a dense and high-quality care system, creating an equitable primary care environment for children/improving efficiency through the integrated operation of child care, and improving the efficiency through the integrated operation of child care); there is universal guarantee of children’s basic rights (guaranteeing children’s household income and strengthening livelihood support, ensuring the balanced development and growth of children/strengthening the protection and safety net of children and young people); and there is guarantee of lifetime sexual and reproductive rights (comprehensive protection of sexual and reproductive rights, life-long reproductive health management, and disease prevention or healthy and safe pregnancy and childbirth). However, the target TFR value for 2025, when the fourth round ends, is not specifically presented. Thus, the result is noteworthy.
According to the estimated birth rate and number of births until 2065 published by Statistics Korea, Korea’s population is projected to be 51,821,669 in 2021, with it maintained at 51,926,953 in 2030, then beginning to decrease to 51,629,895 in 2035, and further decreasing to 42,837,900 in 2060, which is 40 years from now. The total number of births is estimated to increase from 290,000 in 2021 to 358,000 in 2030, and then gradually decrease to 214,000 by 2060. As per the CBR estimates, there will be a decrease in CBR from 5.6 in 2021 to 5.0 in 2060. According to TFR estimates, TFR is predicted to increase from 0.86 in 2021 to 1.27 in 2060. In both cases, a significant increase was not expected. Looking at the average TFR of OECD countries, TFR decreased from 2.79 in 1970 to 1.74 in 1995, with it standing at 1.63 in 2018. In 2018, Korea had the lowest TFR among the 37 OECD countries (0.98). Among the OECD countries, 11 countries (including Korea) experienced the lowest-low fertility society phenomenon (TFR 1.3 or less). Except for Korea, all other countries escaped the lowest-low fertility society phenomenon. This is the result of comprehensive fertility promotion policies implemented by OECD countries for a long time to restore the fertility rate.121314 Sweden does not have a special fertility policy. It is simply a family and labor policy within the social welfare system. The society operates on the principle that all people who can work, including women, participate in labor to develop the economy and society. France’s fertility policy is mainly national and public childcare facilities for childcare services, and kindergarten is a free education for most children aged 3 to 5 years. The United States does not have a separate fertility incentive program. Rather, they actively support the cause by aiming for a large family. By sharing resources between generations, extended families have a stronger ability, than nuclear families, to overcome crises in a low fertility population and aging society. Large families who live together can help parents raise children and perform household chores. It seems that most OECD countries that overcame low fertility were able to do so because they eventually created an environment where women could work. In Germany, although women’s participation in the labor market is not an important policy target, childcare services are highly developed. Looking at the countries that have made some progress in overcoming the low fertility rate, we can see that marriage, pregnancy, childbirth, and childrearing are things that individuals and families have to go through, but society and the state are putting their highest priority on all policies and are earnestly implementing these policies. To this end, a gender-equal family policy, work-family balance, and acceptance of various family types without discrimination should be implemented. In addition, policy support is needed to create a virtuous cycle structure, such as the influx of excellent immigrants to secure a workforce, the use of the elderly workforce, and support for the stable economic independence of the youth.
Therefore, in conclusion, looking at the changes and trends in the number of births, fertility rate, and birth rate in Korea over the past 100 years, following the liberation, Korea (South Korea) went through a birth control policy period of limiting childbirth due to the increase in the number of births. When it comes to the population quality improvement policy period, Korea’s low fertility society era that started in the mid-2000s, the TFR fell below 0.84 in 2020. Following the population collapse of 400,000 in 2017, with fewer than 300,000 births (270,000), the number of deaths reached 300,000, thereby entering an era of population decline. In other words, we reached the age of the population cliff. Furthermore, OECD countries recorded the lowest fertility rates. As we enter the era of population decline, we are in a serious situation that will give rise to various socio-economic problems, ranging from demographic problems to future population decline. To overcome this, the government has devised various measures. Thus, the authors hope that this data will help provide basic materials for practical applications in related fields, including medical fields, such as neonate perinatal, infant, and neonatal medicine, and help tackle the low fertility rate problem prevailing in Korea.

Notes

Disclosure: The authors have no potential conflicts of interest to disclose.

Author Contributions:

  • Conceptualization: Bae CW, Chung SH.

  • Data curation: Yun J, Kim CY.

  • Formal analysis: Yun J, Kim CY, Son SH, Bae CW.

  • Investigation: Bae CW, Choi YS, Chung SH.

  • Methodology: Bae CW, Choi YS, Chung SH.

  • Writing - original draft: Yun J, Kim CY.

  • Writing - review & editing: Bae CW, Choi YS, Chung SH.

References

1. Statistics Korea. Preliminary results of birth and death statistics in 2020. Updated 2021. Accessed November 20, 2021. http://kostat.go.kr/portal/korea/kor_nw/1/1/index.board?bmode=read&aSeq=388265 .
2. Korean Statistical Information Service. Population, birth statistics. Updated 2021. Accessed November 20, 2021. https://kosis.kr/index/index.do .
3. Organisation for Economic Co-operation and Development. Fertility rates. Updated 2020. Accessed November 20, 2021. https://data.oecd.org/pop/fertility-rates.htm .
4. Presidential Committee on Aging Society and Population Policy (KR). The 1st plan for low birth rate and aging society in Korea (2006–2010). Updated 2018. Accessed July 25, 2021. https://www.betterfuture.go.kr/front/policySpace/basicPlanDetail.do;jsessionid=50834218BBCA6D108693F71F18E941BF.node20?articleId=1 .
5. Presidential Committee on Aging Society and Population Policy (KR). The 2nd plan for low birth rate and aging society in Korea (2011–2015). Updated 2018. Accessed July 25, 2021. http://www.betterfuture.go.kr/front/policySpace/basicPlanDetail.do;jsessionid=7F428A894D1F2E3556A76E53B63388AE.node20?articleId=2 .
6. Presidential Committee on Aging Society and Population Policy (KR). The 3rd plan for low birth rate and aging society in Korea (2016–2020). Updated 2020. Accessed July 25, 2021. https://www.korea.kr/archive/expDocView.do?docId=38961 .
7. Ministry of Health and Welfare (KR). The 3rd plan for low birth rate and aging society in Korea (2016–2020) (revision). Updated 2016. Accessed July 25, 2021. http://www.mohw.go.kr/react/jb/sjb030301vw.jsp?PAR_MENU_ID=03&MENU_ID=0319&CONT_SEQ=329333&page=1&CONT_SEQ=329333&page=1 .
8. Presidential Committee on Aging Society and Population Policy (KR). The 4th plan for low birth rate and aging society in Korea (2021–2025). Updated 2020. Accessed July 25, 2021. https://www.mohw.go.kr/react/gm/sgm0704vw.jsp?PAR_MENU_ID=13&MENU_ID=13040801&page=1&CONT_SEQ=358262&PAR_CONT_SEQ=356080 .
9. Park GS. Population dynamics and structure during the Japanese colonial period. Korea J Popul Stud. 2009; 32(2):29–58.
10. United Nations. World population prospects: population. Updated 2019. Accessed May 23, 2022. https://population.un.org/wpp/Download/Standard/Population/ .
12. United Nations. World population prospects: fertility. Updated 2019. Accessed May 23, 2022. https://population.un.org/wpp/Download/Standard/Fertility/ .
13. Ki HA, Ho YK, Geum JC, Hong SC, Oh MJ, Kim HJ. Governmental policies for overcoming low birth rate by country. J Korean Soc Matern Child Health. 2018; 22(3):131–133.
crossref
14. Park JW, Yeo CK. A study on the economic impact and countermeasures to the demographic cliff due to the low birthrate and aging population: focusing on foreign case studies. J Corp Innov. 2021; 44(4):261–280.
TOOLS
Similar articles