INTRODUCTION
MATERIALS AND METHODS
RESULTS
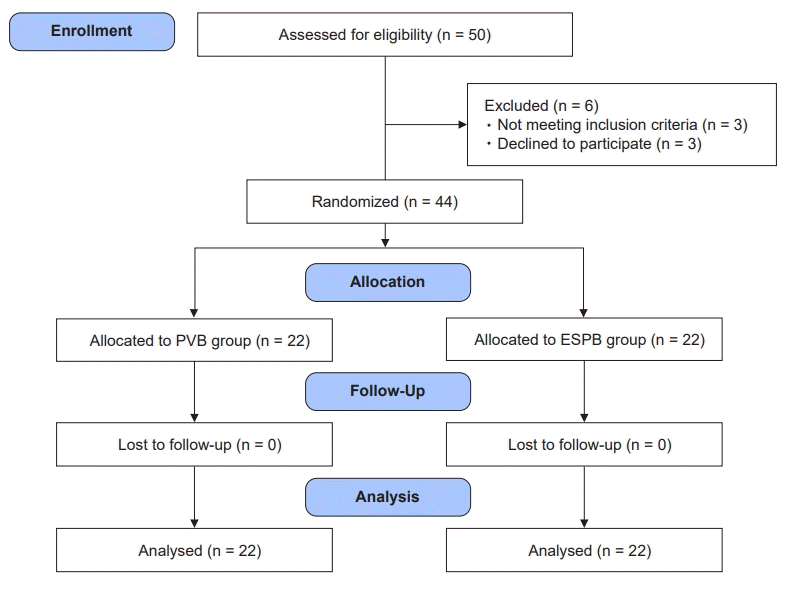
 | Fig. 2.CONSORT flow diagram for the study. CONSORT: Consolidated Standards for Reporting of Trials, PVB: thoracic paravertebral block, ESPB: erector spinae plane block. |
Table 1.
Values are presented as mean ± SD or number (%). PVB: thoracic paravertebral block, ESPB: erector spinae plane block, ASA PS: American Society of Anesthesiologists physical status, NA: not applicable. Independent Student’s t-test was used for statistical comparison of age, weight, and body mass index. Mann–Whitney U test was used for statistical comparison of operative time and intraoperative blood loss. Fisher’s exact test was used for statistical comparison of ASA PS and the chi-square test was used for statistical comparison of type of surgical procedure.
Table 2.
| Variable | PVB (n = 22) | ESPB (n = 22) | MD (95% CI) | P value |
|---|---|---|---|---|
| Intraoperative fentanyl consumption (µg) | 158.0 ± 49.0 | 177.3 ± 51.7 | –19.3 (–49.9 to 11.3) | 0.212 |
| Total morphine consumption in 24 h (mg) | 3.5 ± 3.3 | 8.6 ± 3.8 | –5.1 (–7.3 to –2.9) | < 0.001* |
| Time to first analgesic request (min) | 209.1 ± 61.1 | 197.4 ± 49.5 | 11.8 (–25.9 to 49.4) | 0.532 |
| Number of patients requiring rescue morphine | 14 (63.6) | 22 (100.0) | NA | 0.004* |
| Frequency of rescue morphine requirements (time) | 1 (0, 2) | 3 (2, 4) | NA | < 0.001* |
Values are presented as mean ± SD, number (%), or median (1Q, 3Q). PVB: thoracic paravertebral block, ESPB: erector spinae plane block, MD: mean difference, CI: confidence interval, NA: not applicable. Mann–Whitney U test was used for statistical comparison of intraoperative fentanyl consumption, total morphine consumption in 24 h and time to first analgesic request. Chi-square test was used for statistical comparison of number of patients requiring rescue morphine and Fisher’s exact test was used for statistical comparison of frequency of rescue morphine requirements.
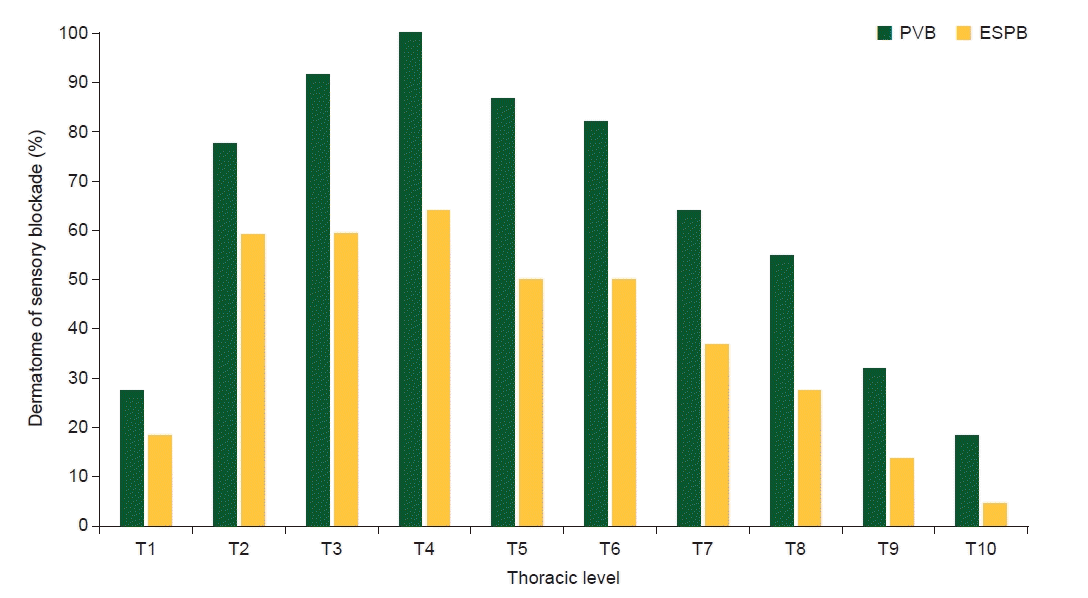
 | Fig. 3.Dermatome of sensory blockade following PVB and ESPB. PVB: thoracic paravertebral block, ESPB: erector spinae plane block, T: thoracic level. |
Table 3.
| Variable | PVB (n= 22) | ESPB (n = 22) | MD (95% CI) | P value |
|---|---|---|---|---|
| Pain score at rest | ||||
| Overall pain score at rest | 1.68 (0.74 to 2.63) | < 0.001*,† | ||
| At PACU | 2.73 ± 1.78 | 4.41 ± 1.44 | 1.68 (0.44 to 2.92) | 0.002*,‡ |
| At 6 h | 1.32 ± 1.17 | 2.09 ± 1.72 | 0.77 (–0.35 to 1.90) | 0.387‡ |
| At 12 h | 0.68 ± 0.95 | 1.23 ± 1.11 | 0.55 (–0.25 to 1.34) | 0.379‡ |
| At 24 h | 0.50 ± 0.86 | 0.68 ± 0.95 | 0.18 (–0.51 to 0.88) | > 0.999‡ |
| At 48 h | 0.41 ± 0.73 | 0.59 ± 0.91 | 0.18 (–0.45 to 0.82) | > 0.999‡ |
| Pain score on movement | ||||
| Overall pain score on movement | 2.50 (1.28 to 3.72) | < 0.001*,† | ||
| At PACU | 3.55 ± 2.22 | 6.05 ± 1.94 | 2.50 (0.90 to 4.10) | < 0.001*,‡ |
| At 6 h | 2.91 ± 1.27 | 3.41 ± 1.18 | 0.50 (–0.44 to 1.44) | 0.856‡ |
| At 12 h | 2.50 ± 1.10 | 2.64 ± 1.29 | 0.14 (–0.79 to 1.06) | > 0.999‡ |
| At 24 h | 2.09 ± 1.23 | 2.09 ± 1.02 | 0.00 (–0.87 to 0.87) | > 0.999‡ |
| At 48 h | 1.73 ± 1.24 | 1.86 ± 1.36 | 0.14 (–0.86 to 1.13) | > 0.999‡ |
Table 4.
| Variable | PVB (n = 22) | ESPB (n = 22) | P value |
|---|---|---|---|
| Dermatome of sensory blockade (levels) | 7 (5, 8) | 4 (1, 7) | 0.019* |
| Adverse events and complications | |||
| Moderate to severe PONV | 0 | 3 (13.6) | 0.351 |
| Oversedation | 0 | 0 | NA |
| Respiratory depression | 0 | 0 | NA |
| Local anaesthetic systemic toxicity | 0 | 0 | NA |
| Pneumothorax | 0 | 0 | NA |
| Patient satisfaction | 0.531 | ||
| Vary satisfied | 15 (68.2) | 13 (59.1) | |
| Satisfied | 7 (31.8) | 9 (40.9) |
Values are presented as median (1Q, 3Q) or number (%). PVB: thoracic paravertebral block, ESPB: erector spinae plane block, PONV: postoperative nausea and vomiting, NA: not applicable. Mann–Whitney U test was used for statistical comparison of dermatome of sensory blockade. Fisher’s exact test and chi-square test was used for statistical comparison of PONV incidence, and patient satisfaction, respectively.


 PDF
PDF Citation
 Print
Print


 XML Download