Journal List > Acute Crit Care > v.37(3) > 1516080122

Kim, Yoon, Park, Lee, Lee, and Lee: Effect of prone positioning on gas exchange according to lung morphology in patients with acute respiratory distress syndrome

Abstract

Background

There are limited data on the clinical effects of prone positioning according to lung morphology. We aimed to determine whether the gas exchange response to prone positioning differs according to lung morphology.

Methods

This retrospective study included adult patients with moderate-to-severe acute respiratory distress syndrome (ARDS). The lung morphology of ARDS was assessed by chest computed tomography scan and classified as “diffuse” or “focal.” The primary outcome was change in partial pressure of arterial oxygen to fraction of inspired oxygen (PaO2/FiO2) ratio after the first prone positioning session: first, using the entire cohort, and second, using subgroups of patients with diffuse ARDS matched 2 to 1 with patients with focal ARDS at baseline.

Results

Ninety-five patients were included (focal ARDS group, 23; diffuse ARDS group, 72). Before prone positioning, the focal ARDS group showed worse oxygenation than the diffuse ARDS group (median PaO2/FiO2 ratio, 79.9 mm Hg [interquartile range (IQR)], 67.7–112.6 vs. 104.0 mm Hg [IQR, 77.6–135.7]; P=0.042). During prone positioning, the focal ARDS group showed a greater improvement in the PaO2/FiO2 ratio than the diffuse ARDS group (median, 55.8 mm Hg [IQR, 11.1–109.2] vs. 42.8 mm Hg [IQR, 11.6–83.2]); however, the difference was not significant (P=0.705). Among the PaO2/FiO2-matched cohort, there was no significant difference in change in PaO2/FiO2 ratio after prone positioning between the groups (P=0.904).

Conclusions

In patients with moderate-to-severe ARDS, changes in PaO2/FiO2 ratio after prone positioning did not differ according to lung morphology. Therefore, prone positioning can be considered as soon as indicated, regardless of ARDS lung morphology.

INTRODUCTION

Acute respiratory distress syndrome (ARDS) is a clinical syndrome of hypoxemic respiratory failure and is associated with a high mortality rate. Ventilator-induced lung injury can occur in patients receiving invasive mechanical ventilation and can contribute to multiple organ dysfunction [1]. Several lung protective ventilation strategies and adjunctive management have been proposed to reduce the deleterious consequences of lung injury [2-5]. Prone positioning, one of several interventions, has been implemented widely in patients with moderate-to-severe ARDS to reduce mortality [6]. Additionally, a recent study from our institution found that an improvement in oxygenation after prone positioning is a useful predictor of survival [7]. Prone positioning minimizes regional differences in lung aeration, compliance, and shear strain, leading to clinically significant improvements in oxygenation [8].
The value of precision medicine has recently emerged, and attempts have been made to identify meaningful subgroups of critical illness syndrome considering the heterogeneity in the field of critical care medicine [9]. Calfee et al. [10] used inflammatory biomarkers, such as interleukin-6 and interferon-gamma, to identify two biologically distinct groups and found that the reactive phenotype was associated with worse clinical outcomes. Moreover, ARDS can be subdivided using clinical imaging as a surrogate marker of lung recruitment potential. The lung imaging morphology for ventilator settings in an ARDS study (LIVE study) conducted in France suggested that an approach based on the lung morphology of ARDS could reduce mortality. However, there was a limitation in that the misclassification rate of lung morphology was high due to the small proportion of patients with available computed tomography (CT) scans [11]. This study investigated whether the improvement in oxygenation after prone positioning differed between lung morphologies as assessed by CT scan.

MATERIALS AND METHODS

Study Design and Patients

This was a retrospective cohort study in the medical intensive care unit (ICU) at Seoul National University Hospital, a tertiary care referral hospital in Seoul, Korea. The requirement of written informed consent was waived due to the retrospective nature of the study.
We reviewed the medical records of adult patients aged >18 years who were diagnosed with moderate-to-severe ARDS and underwent prone positioning between January 1, 2014, and May 31, 2021. According to the Berlin definition [6,12], moderate-to-severe ARDS is defined as partial pressure of arterial oxygen to fraction of inspired oxygen (PaO2/FiO2) ratio <150 mm Hg with positive end-expiratory pressure (PEEP) ≥5 cm of water. We also assessed lung morphology using chest CT scans performed within 1 week of the first prone session. Patients who were in prone position for less than 12 hours were excluded from this study [13].

Radiologic Findings

We assessed the lung morphology of ARDS by chest CT and classified it as “diffuse” or “focal.” The lung morphology characterization of ARDS was defined as (1) diffuse ARDS (widespread loss of lung aeration distribution throughout the lungs or uneven lung attenuation) and (2) focal ARDS (predominant loss of aeration in the lower lobar distribution or gravitationally-dependent areas) [14,15]. The chest CT findings were assessed visually by three independent readers, and two physicians (NYK and SMY) blindly reviewed the CT images. Any disagreement between the two physicians was reassessed under the supervision of a third blinded physician (HYL).

Prone Positioning Methods

We have several devices in place to reduce chest wall pressure during prone positioning, and this pressure can be minimized by padding all facial areas in contact with the bed. We placed foam dressings on the following areas before prone positioning: facial cheeks, shoulders, anterior iliac spine, and knees to protect from skin lesions. After changing to prone position, the chest and the ipsilateral leg were supported with a pillow. One arm was raised, with the head rotated toward the raised arm and the opposite arm positioned alongside the body, in the Swimmer’s position. We tilted the patient into reverse Trendelenburg position and continued lateral repositioning every 2 hours [16].

Study Outcomes and Data Collection

The primary outcome was change in PaO2/FiO2 ratio after the first prone positioning session. Secondary outcomes were 28-day mortality, ICU mortality, and changes in dynamic lung compliance (Cdyn) after the first prone positioning session. The PaO2/FiO2 ratio and Cdyn were evaluated at three time points for each patient by collecting the results of arterial blood gas analysis and ventilator setting at the time of blood tests at (1) baseline, before initiation of prone positioning; (2) time P8-12, approximately 8–12 hours after initiation of prone positioning; and (3) time S4-12, approximately 4–12 hours after resuming the supine position. The driving pressure was defined as the difference between plateau pressure and PEEP. If not recorded, peak inspiratory pressure was assumed to be equal to plateau pressure in pressure-controlled ventilation mode [17].

Statistical Analysis

Continuous variables were presented as means and standard deviations or medians and interquartile ranges (IQRs), while categorical variables were reported as numbers and percentages. All variables were compared between the diffuse and focal ARDS groups using the chi-square test or Student t-test, as appropriate. In primary and secondary outcomes, we performed a 2 to 1 matching procedure with the nearest-neighbor method without replacement to balance the two groups by PaO2/FiO2 ratio. Cox proportional hazard regression models were used to evaluate the effects of different variables on 28-day mortality in patients with ARDS who underwent prone positioning. All variables found to be significant (P<0.1) in the univariable analysis were entered into a multivariable Cox regression model to avoid model overfitting and comply with the rule of thumb [18]. The results are presented as hazard ratios (HRs) with 95% confidence intervals (CIs). A two-way repeated-measures analysis of variance was applied to compare the extent of changes in PaO2/FiO2 from baseline to time S4-12. A two-tailed P-value less than 0.05 was considered statistically significant. All statistical analyses were performed using R (version 4.1.2) in R Studio (version 1.4.1717; R Foundation, Vienna, Austria).

RESULTS

Baseline Characteristics of the Patients

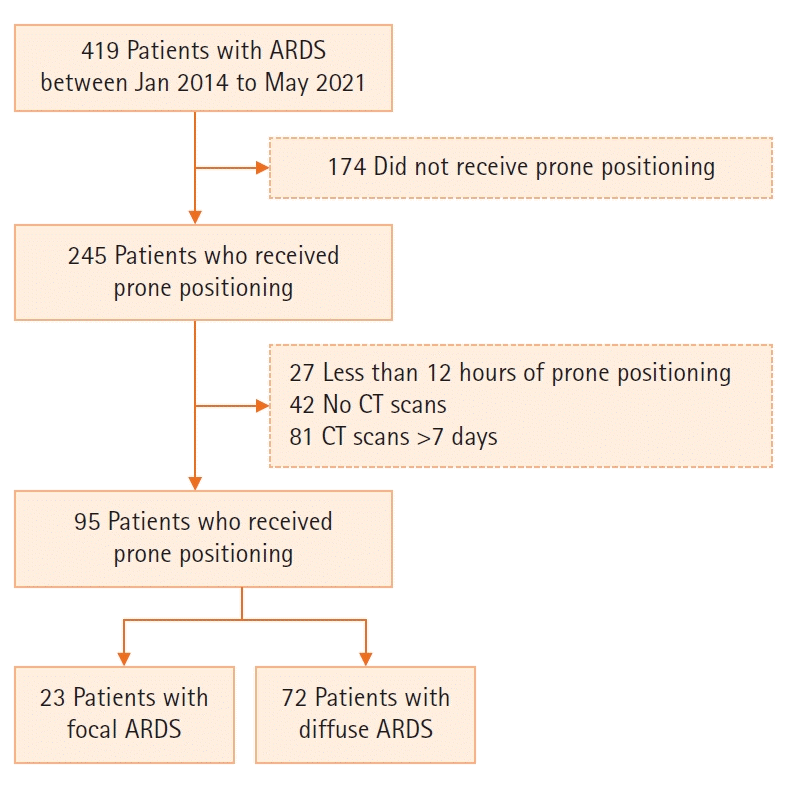
During the study period, we included 245 patients who underwent prone positioning to treat ARDS. Of these, 27 patients who were in prone position for less than 12 hours were excluded, and their median duration of prone positioning was 0.6 hours (IQR, 0.2–4.1 hours). A total of 95 patients had undergone chest CT within 1 week of the first prone session (Figure 1). In addition, 14 patients had undergone CT scans during mechanical ventilation, and 81 patients received CT scans before admission to the ICU. CT scan was used to assess lung morphology and classify 23 patients (24.2%) in the focal ARDS group and 72 patients (75.8%) in the diffuse ARDS group. Interobserver agreement was assessed by the kappa coefficient and was moderate (kappa coefficient, 0.58). The two groups had similar baseline characteristics (Table 1). The mean age was 65.1±13.7 years, and 66 patients (69.5%) were males. The mean body mass index was 23.6±3.9 kg/m2, and the main cause of ARDS was pulmonary (97.9%). Baseline vital signs and laboratory results before initiation of prone positioning did not differ between the two groups (Supplementary Table 1). The three scoring systems for prediction of mortality in critically ill patients did not differ between the two groups. The comorbidity was similar between the groups, but more than half of the included patients were diagnosed with malignancies due to the characteristics of the tertiary hospital.
The results of ventilator settings and arterial blood gas analysis at baseline did not differ significantly according to lung morphology, except for PaO2/FiO2 ratio (Table 2). Patients with focal ARDS showed worse oxygenation than those with diffuse ARDS (median PaO2/FiO2 ratio, 79.9 mm Hg [IQR, 67.7–112.6] vs. 104.0 mm Hg [IQR, 77.6–135.7]; P=0.04). Before prone positioning, 98.9% of the patients received pressure-controlled ventilation. The mean tidal volume was 6.8±1.6 mL/kg predicted body weight, and the median PEEP was 10.0 cm H2O (IQR, 8.0–11.5 cm H2O). Adjunctive therapy during prone positioning sessions did not differ between the groups (Table 3). At the initiation of prone positioning, all patients received antibiotic therapy. Neuromuscular blockade, systemic steroids, vasopressors, inhaled nitric oxide, and renal replacement therapy were used in 93.7%, 90.5%, 74.7%, 21.1%, and 14.7% of the patients, respectively.

Oxygenation and Dynamic Compliance of Lung Response to First Prone Positioning

The median number of prone sessions was two per patient (IQR, 1–4), the median duration of the first prone session was 17.5 hours (IQR, 16.3–20.0 hours), and the median interval from intubation to initiation of the first prone positioning was 26.8 hours (IQR, 13.0–55.4 hours). These values did not differ significantly between the two groups (Table 3).
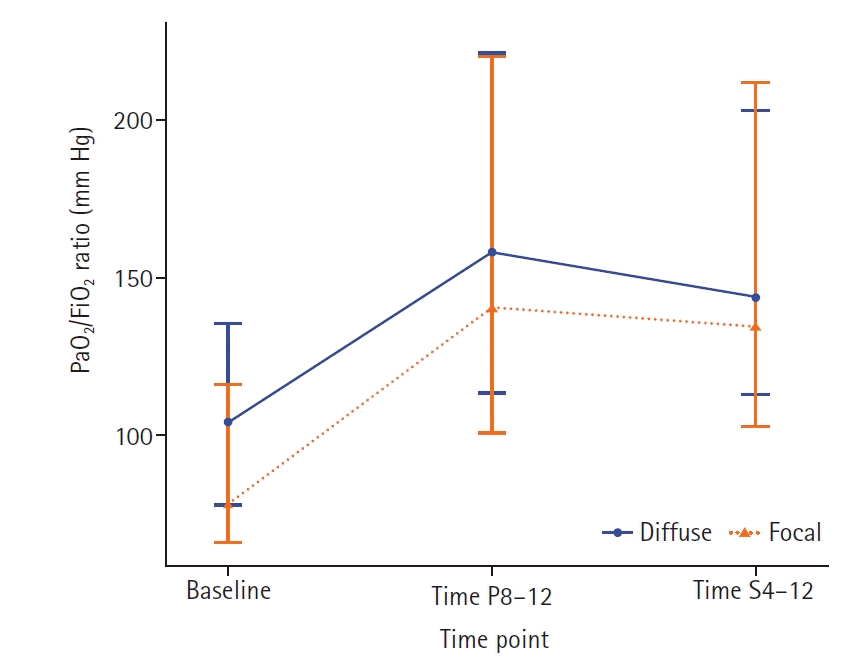
Changes in PaO2/FiO2 ratio after the first prone positioning session are shown in Figure 2. Measurement of the PaO2/FiO2 ratio at time P8-12 and time S4-12 was performed at a median of 10.2 hours (IQR, 9.0–11.4 hours) after the initiation of prone positioning and at 8.2 hours (IQR, 6.0–10.0 hours) after changing to supine position, respectively. The PaO2/FiO2 ratio was higher at time P8-12 in the diffuse ARDS group than in the focal ARDS group (median PaO2/FiO2 ratio, 157.9 mm Hg [IQR, 113.3–222.2] vs. 134.7 mm Hg [IQR, 99.2–217.5]; P=0.39). A detailed description of the ventilator settings and arterial blood gases during the first prone positioning session is provided according to lung morphology in Supplementary Table 2. When comparing baseline and time P8-12, the absolute improvement in PaO2/FiO2 ratio was greater in patients with focal ARDS (median, 55.8 mm Hg [IQR, 11.1–109.2]) than in patients with diffuse ARDS (median, 42.8 mm Hg [IQR, 11.6–83.2]) (Table 4). However, the difference between the groups was not significant (P=0.71). After the patients returned to the supine position, the change in PaO2/FiO2 ratio from baseline was higher in patients with focal ARDS (median, 43.3 mm Hg [IQR, 24.0–98.0]) than in patients with diffuse ARDS (median, 41.4 mm Hg [IQR, 3.8–88.3]). The difference between the groups was not significant (P=0.42). Among the PaO2/FiO2-matched cohort, there was no significant difference in change in PaO2/FiO2 ratio from baseline between the two groups at P8-12 and S4-12. Meanwhile, the change in dynamic compliance of the lung from baseline was not significantly different between the focal group and the diffuse group (median, –1.1 mL/cm H2O [–4.6 to 4.6] vs. –1.0 mL/cm H2O [–4.0 to 1.5], P=0.36) at time P8-12. Additionally, at time S4-12, there were no significant differences in the improvement in dynamic compliance of the lung from baseline between the two groups (median, 2.3 mL/cmH2O [–0.9–4.5] vs. 0.9 mL/cmH2O [–1.9–5.3], P=0.48). The results for the PaO2/FiO2 ratio-matched group were consistent with those for the entire group (Table 4).
Traditional PaO2 responders, defined by Gattinoni et al. [19] as patients showing an increase in PaO2/FiO2 ratio ≥20 mm Hg from baseline to prone positioning, accounted for 69.4% of patients with diffuse ARDS and 65.2% with focal ARDS. According to the novel definition of prone responders using the percentage change in PaO2/FiO2 ratio from baseline to 8–12 hours after prone positioning, the proportion of prone responders was 41.7% for diffuse ARDS and 60.9% for focal ARDS (P=0.17) [7]. After PS matching, traditional prone responders represented 67.4% of patients with diffuse ARDS and 65.2% of those with focal ARDS (P>0.99). Prone responders based on the percentage change in PaO2/FiO2 ratio accounted for 56.5% of those with diffuse ARDS and 60.9% of those with focal ARDS (P=0.93). The change in PaO2/FiO2 ratio and dynamic compliance from baseline to the first prone session were not different between the two groups, although the results were limited to the responders (Supplementary Tables 3 and 4). Further details on study outcomes separately analyzing survivors and non-survivors within 28 days can be found in the supplementary information (Supplementary Tables 5-8).

Outcomes of Patients and Predictors of Mortality

Mortality was not significantly different between the two groups; 10 patients (43.5%) in the focal ARDS group and 37 patients (51.4%) in the diffuse ARDS group died within 28 days; 9 patients (39.1%) in the focal ARDS group and 35 patients (48.6%) in the diffuse ARDS group died in the ICU (Table 4). The main cause of 28-day mortality was ARDS (78.7%), while the others had causes such as septic shock, arrhythmia, and hypovolemic shock. ICU mortality was significantly higher in the excluded patients than in the included patients (61.3% vs. 46.3%, P=0.03); however, there was no difference in mortality at 28 days (58.0% vs. 49.5%, P=0.24). In the multivariable Cox regression analysis, baseline serum lactate level (HR, 1.25; 95% CI, 1.05–1.48 per 1-mmol/L increase) and change in PaO2/FiO2 ratio within 8–12 hours after the prone positioning session (HR, 0.99; 95% CI, 0.98–1.00 per 1 mm Hg increase) were significantly associated with 28-day mortality (Table 5).

DISCUSSION

This study investigated changes in oxygenation and compliance after the first prone positioning session in patients with ARDS according to lung morphology. Overall, the improvement in oxygenation after prone positioning was greater in the focal ARDS group than in the diffuse ARDS group; however, there was no statistically significant difference between the two groups. Moreover, there were no differences in changes in respiratory system compliance after prone positioning between the two groups. Among the PaO2/FiO2-matched cohort, there were no significant differences in change in PaO2/FiO2 ratio and compliance of the respiratory system after prone positioning between the two groups.
The definition of ARDS has been controversial since it was first described in 1967 [1], but currently it follows the Berlin definition [12]. In the Berlin criteria, ARDS is defined by bilateral opacities on chest radiograph, although a CT scan can also visualize the disease. The interobserver reliability of the Berlin definition is moderate, driven primarily by variability in imaging interpretation [20]. In an international cohort study of patients with ARDS [21], the diagnosis of ARDS was missed in two-thirds of the patients, leading to failure of appropriate strategies to reduce mortality. Another prospective study attempted to show the superiority of personalized treatment according to lung morphology but was unsuccessful due to misclassification of images [11]. To overcome this imaging limitation, chest CT can be used to increase the accuracy of diagnosis [22,23]. A retrospective observational study showed that CT scans led to changes in management in 26.5% of patients with ARDS [24]. To obtain a more accurate evaluation of ARDS patterns, we used chest CT scans to classify the subphenotypes in the current study.
In the LIVE study, personalized management of mechanical ventilation was applied, considering the advantages of being prone to focal ARDS and high PEEP and recruitment maneuvers to diffuse ARDS; however, the results did not show a significant decrease in mortality [11]. Here, we did not directly compare the tailored strategy according to lung morphology due to the retrospective nature of the study. However, we applied prone positioning to patients with ARDS, focusing on lung protective ventilation, and there were no differences in gas exchange and lung compliance between the two groups. Moreover, in multivariable analysis, the interval between intubation and prone positioning tends to be associated with 28-day mortality (HR, 1.12; 95% CI, 0.99–1.27). Therefore, prone positioning can be considered as soon as indicated, regardless of ARDS lung morphology.
In a previous study, Gattinoni et al. [19]defined “prone responders” as patients with ARDS in whom the PaO2/FiO2 ratio increased to ≥20 mm Hg. The proportion of prone responders was 72.1% in the Gattinoni group and 68.4% in the present study. Our institution proposed classification of prone responders as those with an increase in the percentage change in PaO2/FiO2 ratio of 53.5% from baseline to 8–12 hours after prone positioning (time P8-12) [7]. Based on this new criterion, the proportion of prone responders was 41.7% in the diffuse group and 60.9% in the focal group, a non-significant difference. However, there is some possibility of underpowered results of primary and secondary outcomes. Although not statistically significant, the proportion of prone responders according to this novel definition was relatively higher and the 28-day and ICU mortality rates were relatively lower in the focal ARDS group than in the diffuse ARDS group. Moreover, among the traditional prone responders, the percentage change in PaO2/FiO2 ratio from baseline to P8-12 was significantly higher in the focal ARDS group than in the diffuse ARDS group (median, 90.4% [69.5–161.1] vs. 75.1% [37.0–106.9]; P=0.04) (Supplementary Table 3). Additionally, focal ARDS is considered to have a low baseline PaO2/FiO2 ratio due to its large shunt fraction. Regional shunt fraction tends to be higher in a dependent area [25]. In the present study, PaO2/FiO2 ratio before prone positioning was significantly lower in focal ARDS patients, who can have a substantial true shunt in the dorsal lung [26]. As prone positioning improves the shunt fraction [25], the greater improvement of oxygenation in the focal ARDS group might be due to the higher shunt fraction. Nevertheless, in patients with moderate-to-severe ARDS, the proportion of prone responders was greater than 50% with both definitions. Therefore, if a prone position is indicated, it should be actively implemented regardless of lung morphology.
Known prognostic factors of ARDS are physiological and laboratory variables such as age, SOFA score, oxygenation index, and driving pressure [27-29]. Additionally, circulating plasma markers of inflammation such as IL-6, IL-8, sTNFR1, and PAI-1 are used to classify subphenotypes of ARDS, and the higher are concentrations of biological variables, the higher is the mortality rate [9]. Previous studies have also revealed the correlation between ground-glass opacity (GGO) extent and inflammatory cytokine concentrations [30], as well as the correlation between GGO extent and mortality [31]. Although it is difficult to compare in our study because we did not measure prognostic biomarkers, it is possible that mortality tends to be higher in the diffuse ARDS group due to the extent of pulmonary opacity. Recently, in our institution, we revealed that improvement in oxygenation after prone positioning can be a predictor of survival [7], and a recent Italian study in coronavirus disease 2019 (COVID-19) ARDS showed that the sustained improvement of PaO2/FiO2 ratio after the first prone positioning was related to shorter duration of mechanical ventilation and less ICU mortality [32]. Furthermore, we evaluated the relationships between patient variables and survival using multivariable Cox regression analysis. It was shown that the extent of improvement in PaO2/FiO2 ratio after initial prone positioning could be a predictor of mortality (HR, 0.99; 95% CI, 0.98–1.00; P=0.002), and it was confirmed that improvement of oxygenation after prone positioning was related to mortality.
This study had several limitations. First, this was a retrospective study conducted in a single center. Additionally, more than half of patients were diagnosed with malignancy. Therefore, our results are not necessarily generalizable to other hospital settings. Second, the number of patients with ARDS who underwent chest CT was relatively small. Patients who did not undergo CT scan had a higher ICU mortality rate than those who did undergo CT scan. Additionally, those who did not undergo CT scan might have had unstable vital signs and worse status, hindering the CT procedure. Furthermore, there is possibility of underpowered results of the PaO2/FiO2-matched cohort analysis due to limited sample size. Therefore, the generalizability of the results is limited. Third, chest CT cannot usually be performed at the time of ARDS diagnosis due to the risk of in-hospital transfer and radiation. However, in this study, the median duration from CT scan to prone positioning was 2 days, which might be appropriate to differentiate between focal and diffuse ARDS. Future studies might use other modalities, such as lung ultrasound, dynamic lung tomography, and electrical impedance tomography, to identify subphenotypes of ARDS at the bedside to overcome these risks. Fourth, most patients were under pressure-controlled ventilation. As peak inspiratory pressure was assumed to be equal to plateau pressure in pressure-controlled ventilation mode, driving pressure might have been overestimated. Additionally, esophageal pressure could not be measured in the present study, and change in transpulmonary pressure could not be confirmed. Fifth, regardless of consolidation or GGO, the distribution of lung aeration loss was simply divided into focal and diffuse in this study. Moreover, radiological findings could not be quantified. In future studies, it is necessary to quantify the type and distribution of aeration loss.
In conclusion, the improvement in oxygenation after prone positioning did not differ according to lung morphology in patients with moderate-to-severe ARDS. The findings of our study suggest that prone positioning can be initiated as soon as indicated, regardless of ARDS lung morphology.

KEY MESSAGES

▪ Changes in the partial pressure of arterial oxygen to fraction of inspired oxygen (PaO2/FiO2) ratio and respiratory compliance after prone position did not differ according to the lung morphology of ARDS.
▪ Prone position can be considered as soon as possible, regardless of the morphological phenotype in patients with moderate-to-severe ARDS.
▪ In a multivariable Cox proportional hazard regression analysis of patients with moderate-to-severe ARDS, the improvement in PaO2/FiO2 ratio after prone position was independently associated with mortality.

Notes

CONFLICT OF INTEREST

No potential conflict of interest relevant to this article was reported.

AUTHOR CONTRIBUTIONS

Conceptualization: NYK, HYL. Data Curation: NYK, SMY, JP, HYL. Formal analysis: NYK, HYL. Methodology: NYK, HYL. Drafting the manuscript: NYK. Writing – review & editing: all authors. Supervision: HYL. Writing–original draft: all authors. Writing–review & editing: all authors.

SUPPLEMENTARY MATERIALS

Supplementary materials can be found via https://doi.org/10.4266/acc.2022.00367.
Supplementary Table 1.
Physiologic variables at baseline
acc-2022-00367-suppl1.pdf
Supplementary Table 2.
The variables for ventilator settings and arterial blood gas measurements during the first prone positioning session
acc-2022-00367-suppl2.pdf
Supplementary Table 3.
Changes in PaO2/FiO2 ratio and dynamic compliance after the first session of prone positioning in traditional prone responders
acc-2022-00367-suppl3.pdf
Supplementary Table 4.
Changes in PaO2/FiO2 ratio and dynamic compliance after the first session of prone positioning in prone responders according to percentage change in PaO2/FiO2 ratio
acc-2022-00367-suppl4.pdf
Supplementary Table 5.
Changes in PaO2/FiO2 ratio and dynamic compliance after the first session of prone positioning in survivors within 28 days according to definition of traditional prone responder
acc-2022-00367-suppl5.pdf
Supplementary Table 6.
Changes in PaO2/FiO2 ratio and dynamic compliance after the first session of prone positioning in survivors within 28 days according to novel definition of prone responder
acc-2022-00367-suppl6.pdf
Supplementary Table 7.
Changes in PaO2/FiO2 ratio and dynamic compliance after the first session of prone positioning in non-survivors within 28 days according to definition of traditional prone responder
acc-2022-00367-suppl7.pdf
Supplementary Table 8.
Changes in PaO2/FiO2 ratio and dynamic compliance after the first session of prone positioning in non-survivors within 28 days according to novel definition of prone responder
acc-2022-00367-suppl8.pdf

REFERENCES

1. Ashbaugh DG, Bigelow DB, Petty TL, Levine BE. Acute respiratory distress in adults. Lancet. 1967; 2:319–23.
crossref
2. Acute Respiratory Distress Syndrome Network, Brower RG, Matthay MA, Morris A, Schoenfeld D, Thompson BT, et al. Ventilation with lower tidal volumes as compared with traditional tidal volumes for acute lung injury and the acute respiratory distress syndrome. N Engl J Med. 2000; 342:1301–8.
crossref
3. Hager DN, Krishnan JA, Hayden DL, Brower RG; ARDS Clinical Trials Network. Tidal volume reduction in patients with acute lung injury when plateau pressures are not high. Am J Respir Crit Care Med. 2005; 172:1241–5.
crossref
4. Papazian L, Forel JM, Gacouin A, Penot-Ragon C, Perrin G, Loundou A, et al. Neuromuscular blockers in early acute respiratory distress syndrome. N Engl J Med. 2010; 363:1107–16.
crossref
5. Briel M, Meade M, Mercat A, Brower RG, Talmor D, Walter SD, et al. Higher vs lower positive end-expiratory pressure in patients with acute lung injury and acute respiratory distress syndrome: systematic review and meta-analysis. JAMA. 2010; 303:865–73.
crossref
6. Guérin C, Reignier J, Richard JC, Beuret P, Gacouin A, Boulain T, et al. Prone positioning in severe acute respiratory distress syndrome. N Engl J Med. 2013; 368:2159–68.
7. Lee HY, Cho J, Kwak N, Choi SM, Lee J, Park YS, et al. Improved oxygenation after prone positioning may be a predictor of survival in patients with acute respiratory distress syndrome. Crit Care Med. 2020; 48:1729–36.
crossref
8. Scholten EL, Beitler JR, Prisk GK, Malhotra A. Treatment of ARDS with prone positioning. Chest. 2017; 151:215–24.
crossref
9. Reddy K, Sinha P, O'Kane CM, Gordon AC, Calfee CS, McAuley DF. Subphenotypes in critical care: translation into clinical practice. Lancet Respir Med. 2020; 8:631–43.
crossref
10. Calfee CS, Delucchi K, Parsons PE, Thompson BT, Ware LB, Matthay MA, et al. Subphenotypes in acute respiratory distress syndrome: latent class analysis of data from two randomised controlled trials. Lancet Respir Med. 2014; 2:611–20.
crossref
11. Constantin JM, Jabaudon M, Lefrant JY, Jaber S, Quenot JP, Langeron O, et al. Personalised mechanical ventilation tailored to lung morphology versus low positive end-expiratory pressure for patients with acute respiratory distress syndrome in France (the LIVE study): a multicentre, single-blind, randomised controlled trial. Lancet Respir Med. 2019; 7:870–80.
12. ARDS Definition Task Force, Ranieri VM, Rubenfeld GD, Thompson BT, Ferguson ND, Caldwell E, et al. Acute respiratory distress syndrome: the Berlin Definition. JAMA. 2012; 307:2526–33.
13. Hu SL, He HL, Pan C, Liu AR, Liu SQ, Liu L, et al. The effect of prone positioning on mortality in patients with acute respiratory distress syndrome: a meta-analysis of randomized controlled trials. Crit Care. 2014; 18:R109.
crossref
14. Coppola S, Pozzi T, Gurgitano M, Liguori A, Duka E, Bichi F, et al. Radiological pattern in ARDS patients: partitioned respiratory mechanics, gas exchange and lung recruitability. Ann Intensive Care. 2021; 11:78.
crossref
15. Costamagna A, Pivetta E, Goffi A, Steinberg I, Arina P, Mazzeo AT, et al. Clinical performance of lung ultrasound in predicting ARDS morphology. Ann Intensive Care. 2021; 11:51.
crossref
16. Hao D, Low S, Di Fenza R, Shenoy ES, Ananian L, Prout LA, et al. Prone Positioning of Intubated Patients with an Elevated Body-Mass Index. N Engl J Med. 2022; 386:e34.
crossref
17. Schmidt M, Pham T, Arcadipane A, Agerstrand C, Ohshimo S, Pellegrino V, et al. Mechanical ventilation management during extracorporeal membrane oxygenation for acute respiratory distress syndrome. an international multicenter prospective cohort. Am J Respir Crit Care Med. 2019; 200:1002–12.
crossref
18. Peduzzi P, Concato J, Kemper E, Holford TR, Feinstein AR. A simulation study of the number of events per variable in logistic regression analysis. J Clin Epidemiol. 1996; 49:1373–9.
crossref
19. Gattinoni L, Vagginelli F, Carlesso E, Taccone P, Conte V, Chiumello D, et al. Decrease in PaCO2 with prone position is predictive of improved outcome in acute respiratory distress syndrome. Crit Care Med. 2003; 31:2727–33.
20. Sjoding MW, Hofer TP, Co I, Courey A, Cooke CR, Iwashyna TJ. Interobserver reliability of the Berlin ARDS definition and strategies to improve the reliability of ARDS diagnosis. Chest. 2018; 153:361–7.
crossref
21. Bellani G, Laffey JG, Pham T, Fan E, Brochard L, Esteban A, et al. Epidemiology, patterns of care, and mortality for patients with acute respiratory distress syndrome in intensive care units in 50 countries. JAMA. 2016; 315:788–800.
crossref
22. Rouby JJ, Puybasset L, Nieszkowska A, Lu Q. Acute respiratory distress syndrome: lessons from computed tomography of the whole lung. Crit Care Med. 2003; 31(4 Suppl):S285–95.
crossref
23. Chiumello D, Langer T, Vecchi V, Luoni S, Colombo A, Brioni M, et al. Low-dose chest computed tomography for quantitative and visual anatomical analysis in patients with acute respiratory distress syndrome. Intensive Care Med. 2014; 40:691–9.
crossref
24. Simon M, Braune S, Laqmani A, Metschke M, Berliner C, Kalsow M, et al. Value of computed tomography of the chest in subjects with ARDS: a retrospective observational study. Respir Care. 2016; 61:316–23.
crossref
25. Richter T, Bellani G, Scott Harris R, Vidal Melo MF, Winkler T, Venegas JG, et al. Effect of prone position on regional shunt, aeration, and perfusion in experimental acute lung injury. Am J Respir Crit Care Med. 2005; 172:480–7.
crossref
26. Petersson J, Glenny RW. Gas exchange and ventilation-perfusion relationships in the lung. Eur Respir J. 2014; 44:1023–41.
crossref
27. Amato MB, Meade MO, Slutsky AS, Brochard L, Costa EL, Schoenfeld DA, et al. Driving pressure and survival in the acute respiratory distress syndrome. N Engl J Med. 2015; 372:747–55.
crossref
28. Balzer F, Menk M, Ziegler J, Pille C, Wernecke KD, Spies C, et al. Predictors of survival in critically ill patients with acute respiratory distress syndrome (ARDS): an observational study. BMC Anesthesiol. 2016; 16:108.
crossref
29. Song M, Liu Y, Lu Z, Luo H, Peng H, Chen P. Prognostic factors for ARDS: clinical, physiological and atypical immunodeficiency. BMC Pulm Med. 2020; 20:102.
crossref
30. Wu Z, Liu X, Liu J, Zhu F, Liu Y, Liu Y, et al. Correlation between ground-glass opacity on pulmonary CT and the levels of inflammatory cytokines in patients with moderate-to-severe COVID-19 pneumonia. Int J Med Sci. 2021; 18:2394–400.
crossref
31. Chen YY, Kuo JS, Ruan SY, Chien YC, Ku SC, Yu CJ, et al. Prognostic value of computed tomographic findings in acute respiratory distress syndrome and the response to prone positioning. BMC Pulm Med. 2022; 22:71.
crossref
32. Scaramuzzo G, Gamberini L, Tonetti T, Zani G, Ottaviani I, Mazzoli CA, et al. Sustained oxygenation improvement after first prone positioning is associated with liberation from mechanical ventilation and mortality in critically ill COVID-19 patients: a cohort study. Ann Intensive Care. 2021; 11:63.
crossref

Figure 1.
Flowchart of the study population. ARDS: acute respiratory distress syndrome; CT: computed tomography.
acc-2022-00367f1.tif
Figure 2.
Median and interquartile range (error bars) of changes in the partial pressure of arterial oxygen to fraction of inspired oxygen (PaO2/FiO2) ratio during the first session of prone positioning. Time P8–12: approximately 8–12 hours after initiation of prone positioning; Time S4–12: approximately 4–12 hours after resuming the supine position.
acc-2022-00367f2.tif
Table 1.
Characteristics of the patients at baseline
Variable Diffuse ARDS (n=72) Focal ARDS (n=23) P-value
Age (yr) 65.6±12.5 63.3±17.2 0.566
Male 48 (66.7) 18 (78.3) 0.429
Body mass index (kg/m2) 23.7±3.9 23.2±4.2 0.589
Cause of ARDS >0.999
 Pulmonary 70 (97.2) 23 (100.0)
 Extrapulmonary 2 (2.8) 0 (0.0)
Comorbidity
 Cardiovascular disease 11 (15.3) 4 (17.4) >0.999
 Diabetes mellitus 21 (29.2) 12 (52.2) 0.077
 COPD 5 (6.9) 1 (4.3) >0.999
 Moderate to severe CKDa 7 (9.7) 1 (4.3) 0.706
 Chronic liver disease 9 (12.5) 0 0.170
 Solid tumor 32 (44.4) 8 (34.8) 0.566
 Hematological malignancy 11 (15.3) 9 (39.1) 0.032
 Connective tissue disease 10 (13.9) 1 (4.3) 0.384
 Chronic neurologic disease 5 (6.9) 1 (4.3) >0.999
Charlson comorbidity index 6.1±3.1 5.2±2.8 0.226
SOFA score 12.0±3.0 12.7±2.9 0.325
APACHE II score 26.3±6.6 28.1±7.8 0.282
SAPS II 58.7±15.5 63.1±14.4 0.226

Values are presented as mean±standard deviation or number (%).

ARDS: acute respiratory distress syndrome; COPD: chronic obstructive pulmonary disease; CKD: chronic kidney disease; SOFA: Sequential Organ Failure Assessment; APACHE: Acute Physiology and Chronic Health Evaluation; SAPS: simplified acute physiology score.

a Moderate CKD was defined as creatinine >3 mg/dL (0.27 mmol/L), and severe CKD was defined on dialysis, status post kidney transplant, and uremia.

Table 2.
Pre-prone ventilator settings and arterial blood gas measurements
Variable Diffuse ARDS (n=72) Focal ARDS (n=23) P-value
Ventilator setting
 Tidal volume (mL/kg PBW) 6.7±1.5 7.1±1.8 0.283
 Respiratory rate (breaths/min) 24.4±5.0 24.4 4.9 0.974
 PEEP (cm H2O) 10.0 (8.0–12.0) 8.0 (7.0–10.5) 0.243
 Driving pressure (cm H2O) 16.9±4.9 17.0±4.8 0.954
 FiO2 0.8 (0.6–1.0) 0.9 (0.7–1.0) 0.402
 Total minute ventilation (L/min) 9.2 (8.0–10.0) 9.2 (8.4–11.2) 0.435
 Dynamic compliance of lung (mL/cm H2O) 21.3 (17.2–28.5) 26.0 (20.0–29.7) 0.195
Arterial-blood gas
 pH 7.3±0.1 7.3±0.1 0.796
 PaO2 (mm Hg) 76.5 (64.9–91.0) 68.0 (62.2–76.5) 0.081
 PaO2/FiO2 (mm Hg) 104.0 (77.6–135.7) 79.9 (67.7–112.6) 0.042
 PaCO2 (mm Hg) 47.0 (37.8–51.5) 44.7 (37.6–53.8) 0.924
 Bicarbonate (mmol/L) 23.7 (21.0–27.0) 23.3 (22.1–25.9) 0.924
 Lactate (mmol/L) 2.5 (1.7–3.3) 2.6 (2.0–4.4) 0.490

Values are presented as mean±standard deviation or median (interquartile range).

ARDS: acute respiratory distress syndrome; PBW: predicted body weight; PEEP: positive end expiratory pressure; FiO2: fraction of inspired oxygen; PaO2: partial pressure of oxygen; PaCO2: partial pressure of carbon dioxide.

Table 3.
Characteristics of adjunctive therapies and prone positioning sessions
Variable Diffuse ARDS (n=72) Focal ARDS (n=23) P-value
Adjunctive therapy
 Neuromuscular blockera 68 (94.4) 21 (91.3) 0.630
 Glucocorticoidsa 66 (91.7) 20 (87.0) 0.683
 Vasopressorsa 54 (75.0) 17 (73.9) >0.999
 Inhaled nitric oxidea 12 (16.7) 8 (34.8) 0.080
 Renal replacement therapya 12 (16.7) 2 (8.7) 0.506
 Cross over to extracorporeal membrane oxygenation 1 (1.4) 0 >0.999
Prone positioning session
 Total number of sessions of prone positioning (day) 2.0 (1.0–4.0) 2.0 (1.0–2.0) 0.153
 Median duration of prone positioning per session (hr) 17.5 (16.3–19.1) 19.0 (16.4–19.6) 0.192
 Duration of the first prone positioning session (hr) 17.5 (16.1–20.0) 18.3 (16.4–19.9) 0.417
 Interval between intubation and the first prone positioning session (day) 1.1 (0.6–2.4) 1.2 (0.5–2.1) 0.751

Values are presented as number (%) or median (interquartile range).

ARDS: acute respiratory distress syndrome.

a During the first prone positioning session.

Table 4.
Primary and secondary outcomes
Variable Entire group
PaO2/FiO2-matched
Diffuse ARDS (n=72) Focal ARDS (n=23) P-value Diffuse ARDS (n=46) Focal ARDS (n=23) P-value
Primary outcome
 PaO2/FiO2 change from baseline to 8–12 hours after prone positioning (mm Hg) 42.8 (11.6–83.2) 55.8 (11.1–109.2) 0.705 48.2 (14.0–108.9) 55.8 (11.1–109.2) 0.904
 PaO2/FiO2 change from baseline to 4–12 hours after resuming the supine position (mm Hg) 41.4 (3.8–88.3) 43.3 (24.0–98.0) 0.419 54.1 (9.4–88.5) 43.3 (24.0–98.0) 0.800
Secondary outcome
 Change of Cdyn from baseline to 8–12 hours after prone positioning (mL/cm H2O) –1.0 (–4.0 to 1.5) –1.1 (–4.6 to 4.6) 0.364 –1.2 (–4.0 to 1.7) –1.1 (–4.6 to 4.6) 0.379
 Change of Cdyn from baseline to 4–12 hours after resuming the supine position(mL/cm H2O) 0.9 (–1.9 to 5.3) 2.3 (–0.9 to 4.5) 0.475 0.9 (–2.1 to 3.7) 2.3 (–0.9 to 4.5) 0.423
 Mortality at 28 days 37 (51.4) 10 (43.5) 0.674 23 (50.0) 10 (43.5) 0.798
 ICU mortality 35 (48.6) 9 (39.1) 0.58 20 (43.5) 9 (39.1) 0.931

Values are presented as median (interquartile range) or number (%).

ARDS: acute respiratory distress syndrome; PaO2: partial pressure of oxygen; FiO2: fraction of inspired oxygen; Cdyn: dynamic lung compliance; ICU: intensive care unit.

Table 5.
Univariable and multivariable Cox regression analysis of the prognostic factors associated with 28-day mortality
Factor Univariable analysis
Multivariable analysis
HR (95% CI) P-value HR (95% CI) P-value
Focal ARDS 0.83 (0.41–1.67) 0.603
Age (yr) 1.00 (0.98–1.02) 0.650
Male sex 0.80 (0.44–1.46) 0.467
Body mass index (kg/m2) 1.02 (0.94–1.10) 0.684
SOFA score 1.09 (0.99–1.21) 0.072 1.12 (0.97–1.29) 0.122
APACHE II score 1.04 (0.99–1.08) 0.124
SAPS II 1.01 (0.99–1.03) 0.190
Charlson comorbidity index 1.03 (0.94–1.13) 0.508
Solid tumor 1.32 (0.75–2.35) 0.339
Hematologic malignancy 1.49 (0.77–2.87) 0.236
Lactate (mmol/L) 1.26 (1.06–1.49) 0.007 1.25 (1.05–1.48) 0.013
Baseline PaO2/FiO2 ratio (mm Hg) 1.00 (0.99–1.01) 0.960
Baseline driving pressure (mm Hg) 1.01 (0.95–1.08) 0.732
Interval of intubation and prone positioning (day) 1.02 (0.96–1.09) 0.525 1.12 (0.99–1.27) 0.072
Change of PaO2/FiO2 ratio from the baseline to 8–12 hours after prone positioning session (mm Hg) 0.99 (0.98–1.00) <0.001 0.99 (0.98–1.00) 0.002
Change of Cdyn from the baseline to 8–12 hours after prone positioning session (mL/cm H2O) 0.98 (0.95–1.02) 0.329
Neuromuscular blocker 1.21 (0.38–3.92) 0.741
Glucocorticoids 1.64 (0.51–5.30) 0.405
Vasopressors 1.02 (0.53–1.96) 0.957
Inhaled nitric oxide 1.24 (0.63–2.43) 0.538
Renal replacement therapy 1.54 (0.72–3.29) 0.268
Cross over to Extracorporeal membrane oxygenation 0.37 (0.05–2.69) 0.326

HR: hazard ratio; CI: confidence intervals; ARDS: acute respiratory distress syndrome; SOFA: Sequential Organ Failure Assessment; APACHE: Acute Physiology and Chronic Health Evaluation; SAPS: Simplified Acute Physiology Score; PaO2: partial pressure of oxygen; FiO2: fraction of inspired oxygen; Cdyn: dynamic lung compliance.

TOOLS
Similar articles