INTRODUCTION
MATERIALS AND METHODS
RESULTS
Table 1.
| Characteristics | Placebo (n=11) | Nandrolone (n=11) |
|---|---|---|
| Demographics | ||
| Female | 5 (45.5) | 4 (36.4) |
| Age (yr) | 62.7±11.9 | 69.7±9.6 |
| BMI (kg/m2) | 26.9±5.9 | 26.9±7.4 |
| <18.5 kg/m2 | 1 (9.1) | 2 (18.2) |
| >30 kg/m2 | 4 (36.4) | 4 (36.4) |
| Residence prior to admission | ||
| Own home | 11 (100) | 8 (72.7) |
| Supports at home | 0 | 3 (27.3) |
| APACHE III score | 37.8±14.7 | 41.6±37.8 |
| Duration of ICU admission prior to enrolment (day) | 15.2±7.6 | 14.2±9.5 |
| Indication for ICU admission | ||
| Post-general surgical | 4 (36.4) | 4 (36.4) |
| Neurological | 2 (18.2) | 1 (9.1) |
| Respiratory | 3 (27.3) | 0 |
| Cardiovascular | 2 (18.2) | 1 (9.1) |
| Post-cardiac surgery | 0 | 3 (27.3) |
| Renal failure | 0 | 1 (9.1) |
| Toxicological | 0 | 1 (9.1) |
| Testosterone levela | ||
| Male | 3.2±3.8 | 3.0±1.3 |
| Female | 1.0±0.7 | 0.5±0.3 |
| Baseline physical score (at enrollment) | ||
| Mid-arm circumference (cm) | ||
| Right | 27.6±5.0 | 27.2±6.1 |
| Left | 27.4±4.4 | 27.3±5.8 |
| MRC sum score | 28.2±14.5 | 40.5±8.2 |
| CPAx score | 14.8±7.5 | 24.7±8.9 |
| CPAx score ≤18 (at risk) | 6 (54.5) | 4 (36.4) |
| IMS score | 2.7±1.3 | 5.1±1.9 |
| IMS score <8b | 10 | 9 |
| Grip strength | ||
| Left | 2.9 (0.4–7.3) | 6.5 (2.8–10.2) |
| Right | 3.4 (0.3–6.2) | 9.6 (3.2–12.0) |
Values are presented as number (%), mean±standard deviation, or median (interquartile range).
BMI: body mass index; APACHE: Acute Physiology and Chronic Health Evaluation; ICU: intensive care unit; MRC: Medical Research Council; CPAx: Chelsea critical care assessment tool; IMS: intensive care mobility scale.
Table 2.
Table 3.
| Outcome | Placebo | Nandrolone | P-value |
|---|---|---|---|
| Primary outcome, mean (95% CI) | |||
| MRC changea | 17.0 (12.3–21.7) | 9.3 (5.0–13.6) | 0.017 |
| Grip strength change (R+L)b | 8.5 (3.9–13.1) | 13.0 (8.1–17.9) | 0.185 |
| Grip strength change (R+L) adjusteda,b | 8.4 (3.8–13.0) | 12.9 (8.0–17.8) | 0.182 |
| ICU mobility score changea | 3.0 (1.8–4.2) | 3.5 (2.3–4.6) | 0.614 |
| CPAx score changea | 17.0 (11.5–22.4) | 17.7 (12.3–23.2) | 0.865 |
| Secondary outcome | |||
| Length of invasive ventilation (hr), median (IQR) | 377 (189–454) | 168 (166–305) | 0.032 |
| ICU length of stay (day), median (IQR) | 23 (16–27) | 12 (10–15) | 0.065 |
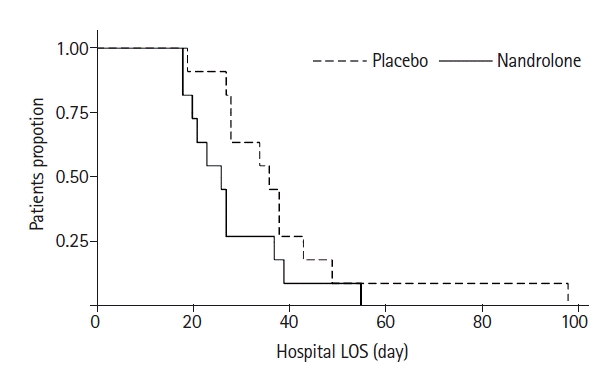
| Hospital length of stay (day), median (IQR) | 36 (28–38) | 26 (20–27) | 0.023 |
| ICU readmission rate | 3 (30) | 1 (11) | 0.582 |
| ICU survival | 9 (82) | 11 (100) | 0.476 |
| 90 Day survival | 9 (82) | 11 (100) | 0.476 |
| Discharge destination | 0.010 | ||
| Home | 0 | 6 (54) | |
| Other (rehab/other hospital) | 9 (82) | 5 (45) | |
| Death in hospital | 2 (18) | 0 | |
| Discharge MRC sum score | 42.7±13.4 | 49.8±7.6 | 0.006 |
| MRC sum score ≥48 | 4 (36.4) | 6 (54.5) | 0.673 |
| Discharge ICU mobility scale score | 5.8±2.2 | 8.4±1.7 | 0.005 |
| IMS score ≥8 (walking with one assist) | 3 (27.3) | 6 (54.5) | 0.637 |
| Discharge CPAx score | 31.6±11.1 | 42.8±6.0 | 0.011 |
| CPAx score >18 | 7 (63.6) | 8 (72.7) | 0.471 |
Values are presented as number (%) or mean±standard deviation unless otherwise indicated. P-value for primary outcomes reflect the interaction effect of change over time.
CI: confidence interval; MRC: Medical Research Council; R+L: right+left; ICU: intensive care unit; CPAx: Chelsea critical care physical assessment tool; IQR: interquartile range; IMS: intensive care mobility scale.
b Change relates to difference from baseline measurement at enrolment, to last measured score prior to discharge. For data outlining baseline and end results, see Supplementary Table 1.


 PDF
PDF Citation
 Print
Print


 XML Download