Abstract
Background
Methods
Results
REFERENCES
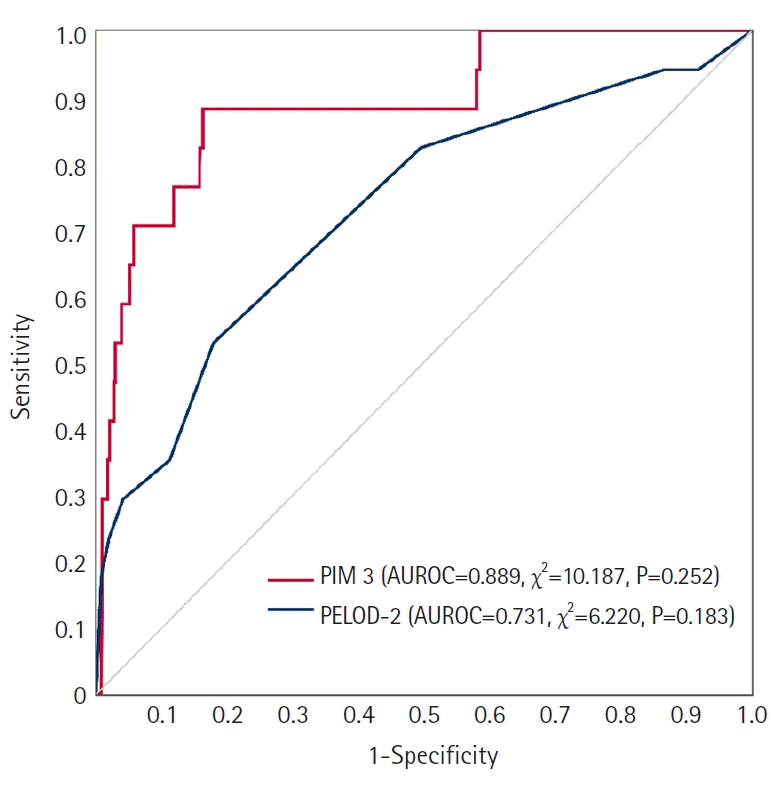
Figure 2.

Table 1.
| Variable | Values (n=945) |
|---|---|
| Age (yr) | 3.0 (0.0 to 8.0) |
| Female | 422 (44.7) |
| Length of stay in ICU (hr) | 24.2 (19.0 to 77.7) |
| Underlying disease | |
| Cardiovascular disease | 138 (13.3) |
| Endocrinologic disease | 48 (4.6) |
| Gastrointestinal disease | 84 (8.1) |
| Genetic disease | 108 (10.4) |
| Genitourinary disease | 62 (6) |
| Hemato-oncologic disease | 174 (16.8) |
| Infectious disease | 42 (4.1) |
| Neuromuscular disease | 171 (16.5) |
| Ophthalmologic disease | 27 (2.6) |
| Psychologic disease | 38 (3.7) |
| Respiratory disease | 119 (11.5) |
| Trauma | 25 (2.4) |
| Physical finding | |
| Z-score of SBP by age | 0.0 (–0.7 to 0.7) |
| Z-score of DBP by age | –0.0 (–0.7 to 0.6) |
| Z-score of MBP by age | 0.0 (–0.6 to 0.6) |
| Z-score of HR by age | 0.0 (–0.7 to 0.7) |
| Z-score of RR by age | 0.0 (–0.7 to 0.7) |
| Body temperature (℃) | 36.8 (36.3 to 37.2) |
| Oxygen saturation (%) | 99.0 (95.0 to 100.0) |
| Glasgow coma scale | |
| Eye | 4.0 (4.0 to 4.0) |
| Verbal | 5.0 (5.0 to 5.0) |
| Motor | 6.0 (6.0 to 6.0) |
| Fixed pupil reflex, both | 14 (1.5) |
| Clinical finding | |
| Vasoactive-inotropic score | 0.0 (0.0–3.2) |
| Mechanical ventilation application | 696 (73.7) |
| Laboratory finding | |
| pH | 7.4 (7.3 to 7.4) |
| Partial pressure of CO2 (mm Hg) | 41.0 (36.0 to 47.0) |
| Total CO2 (mmol/L) | 24.0 (21.5 to 27.2) |
| Base excess (mmol/L) | –0.8 (–3.5 to 1.4) |
| Leukocyte (×103 cells/μl) | 9.4 (5.6 to 13.9) |
| Platelet (×103 cells/μl) | 192.0 (106.0 to 282.0) |
| Glucose (mg/dl) | 115.0 (87.0 to 156.0) |
| Potassium (mg/dl) | 4.0 (3.6 to 4.4) |
| Lactate (mmol/L) | 1.5 (0.9 to 2.5) |
| BUN (mg/dl) | 8.0 (5.0 to 10.0) |
| Creatinine (mg/dl) | 0.3 (0.1 to 0.4) |
| Bilirubin (mg/dl) | 0.6 (0.3 to 1.0) |
| PT-INR | 1.2 (1.1 to 1.3) |
| aPTT (sec) | 34.7 (29.9 to 42.0) |
| Elective admission to ICUa | 773 (81.8) |
| Association between ICU admission and surgerya | |
| Not related to surgery | 200 (21.2) |
| Bypass cardiac surgery | 209 (22.1) |
| Non-bypass cardiac surgery | 44 (4.7) |
| Non-cardiac surgery | 492 (52.1) |
| Low-risk diagnosisa | |
| None | 909 (96.2) |
| Bronchiolitis | 4 (0.4) |
| Diabetic ketoacidosis | 6 (0.6) |
| Seizure | 26 (2.8) |
| High-risk diagnosisa | |
| None | 908 (96.1) |
| Spontaneous cerebral hemorrhage | 12 (1.3) |
| Cardiomyopathy or myocarditis | 15 (1.6) |
| Hypoplastic left heart syndrome | 1 (0.1) |
| Neurodegenerative disorder | 3 (0.3) |
| Necrotizing enterocolitis | 6 (0.6) |
| Very high-risk diagnosisa | |
| None | 913 (96.6) |
| Cardiac arrest | 15 (1.6) |
| Severe combined immune deficiency | 2 (0.2) |
| Leukemia or lymphoma after first induction | 3 (0.3) |
| Bone marrow transplant recipient | 6 (0.6) |
| Liver failure | 6 (0.6) |
| Predicted mortality rate by PIM 3 | 2.0 (0.9 to 2.7) |
| Predicted mortality rate by PELOD-2 | 0.9 (0.5 to 1.4) |
| Observed all-cause ICU mortality | 17 (1.8) |
Values are presented as median (interquartile range) or number (%).
ICU: intensive care unit; SBP: systolic blood pressure; DBP: diastolic BP; MBP: mean BP; HR: heart rate; RR: respiratory rate; CO2: carbon dioxide; BUN: blood urea nitrogen; PT INR: prothrombin time international normalized ratio; aPTT: activated partial thromboplastin time; PIM 3: pediatric index of mortality 3; PELOD-2: pediatric logistic organ dysfunction-2.
a For this classification, the criteria of the PIM 3 calculation formula were used [4].
Table 2.
| Variable |
Univariable analysis |
Multivariable analysis |
||||
|---|---|---|---|---|---|---|
| Estimate | SE | P-value | Estimate | SE | P-value | |
| Age (yr) | 0.059 | 0.031 | 0.055 | |||
| Sex | ||||||
| Male | Reference | |||||
| Female | –0.466 | 0.310 | 0.133 | |||
| Physical finding | ||||||
| Z-score of SBP by age | 0.247 | 0.155 | 0.113 | |||
| Z-score of HR by age | 0.140 | 0.154 | 0.364 | |||
| Z-score of RR by age | 0.142 | 0.155 | 0.359 | |||
| Body temperature (℃) | 0.075 | 0.192 | 0.696 | |||
| Oxygen saturation (%) | –0.091 | 0.015 | <0.001 | –0.065 | 0.012 | <0.001 |
| Glasgow coma scale | ||||||
| Eye | 0.700 | 0.183 | <0.001 | |||
| Verbal | 0.407 | 0.121 | 0.001 | |||
| Motor | 0.718 | 0.143 | <0.001 | |||
| Fixed pupil reflex | 0.948 | 1.277 | 0.458 | |||
| Clinical finding | ||||||
| Vasoactive-inotropic score | –0.006 | 0.008 | 0.410 | |||
| Mechanical ventilation | ||||||
| No | Reference | |||||
| Yes | 0.672 | 0.350 | 0.055 | |||
| Laboratory finding | ||||||
| pH | –15.690 | 1.656 | <0.001 | |||
| Partial pressure of CO2 (mm Hg) | 0.082 | 0.014 | <0.001 | 0.041 | 0.010 | <0.001 |
| Total CO2 (mmol/L) | –0.028 | 0.032 | 0.372 | |||
| Base excess (mmol/L) | –0.223 | 0.035 | <0.001 | –0.124 | 0.024 | <0.001 |
| Leukocyte (×103 cells/μl) | 0.053 | 0.021 | 0.013 | |||
| Platelet (×103 cells/μl) | 0.005 | 0.001 | <0.001 | 0.004 | 0.001 | <0.001 |
| Glucose (mg/dl) | 0.000 | 0.002 | 0.786 | |||
| Potassium (mg/dl) | 0.266 | 0.124 | 0.033 | |||
| Lactate (mmol/L) | 0.435 | 0.089 | <0.001 | |||
| BUN (mg/dl) | 0.081 | 0.020 | <0.001 | 0.045 | 0.017 | 0.008 |
| Creatinine (mg/dl) | 0.377 | 0.295 | 0.202 | |||
| Bilirubin (mg/dl) | 0.114 | 0.096 | 0.234 | |||
| PT | 0.070 | 0.024 | 0.004 | |||
| PT INR | 1.588 | 0.436 | <0.001 | |||
| aPTT (sec) | –0.002 | 0.009 | 0.808 | |||
| Elective admission to ICUa | ||||||
| No | Reference | |||||
| Yes | –2.825 | 0.389 | <0.001 | |||
| Association between ICU admission and surgerya | ||||||
| Not related to surgery | Reference | Reference | ||||
| Bypass cardiac surgery | –2.786 | 0.361 | <0.001 | –2.083 | 0.264 | <0.001 |
| Non-bypass cardiac surgery | 1.908 | 0.730 | 0.009 | |||
| Non-cardiac surgery | 0.018 | 0.309 | 0.955 | |||
| Low-risk diagnosisa | ||||||
| None | Reference | Reference | ||||
| Bronchiolitis | –3.210 | 2.375 | 0.177 | |||
| Diabetic ketoacidosis | –2.215 | 1.942 | 0.254 | |||
| Seizure | –2.998 | 0.938 | 0.001 | -3.598 | 0.723 | <0.001 |
| High-risk diagnosisa | ||||||
| None | Reference | Reference | ||||
| Spontaneous cerebral hemorrhage | 2.024 | 1.377 | 0.142 | |||
| Cardiomyopathy or myocarditis | 3.281 | 1.230 | 0.008 | 3.810 | 0.948 | <0.001 |
| Hypoplastic left heart syndrome | 0.654 | 4.747 | 0.891 | |||
| Neurodegenerative disorder | 0.934 | 2.743 | 0.733 | |||
| Necrotizing enterocolitis | 5.547 | 1.935 | 0.004 | 4.356 | 1.356 | 0.001 |
| Very high-risk diagnosisa | ||||||
| None | Reference | Reference | ||||
| Cardiac arrest | 23.157 | 0.978 | <0.001 | 20.691 | 0.813 | <0.001 |
| Severe combined immune deficiency | 4.838 | 3.355 | 0.150 | |||
| Leukemia or lymphoma after first induction | 6.826 | 2.734 | 0.013 | 9.066 | 2.163 | <0.001 |
| Bone marrow transplant recipient | 6.635 | 1.931 | 0.001 | 6.255 | 1.542 | <0.001 |
| Liver failure | 5.937 | 1.933 | 0.002 | 5.907 | 1.257 | <0.001 |
SE: standard error; SBP: systolic blood pressure; HR: heart rate; RR: respiratory rate; CO2: carbon dioxide; BUN: blood urea nitrogen; PT INR: prothrombin time international normalized ratio; aPTT: activated partial thromboplastin time; ICU: intensive care unit.
a For this classification, the criteria of the PIM 3 calculation formula were used [4].


 PDF
PDF Citation
 Print
Print


 XML Download