Journal List > Korean J Physiol Pharmacol > v.26(6) > 1516080093

Chang, Kim, Lee, Leem, Kim, and Park: Cell-cell contacts via N-cadherin induce a regulatory renin secretory phenotype in As4.1 cells

Abstract

The lack of a clonal renin-secreting cell line has greatly hindered the investigation of the regulatory mechanisms of renin secretion at the cellular, biochemical, and molecular levels. In the present study, we investigated whether it was possible to induce phenotypic switching of the renin-expressing clonal cell line As4.1 from constitutive inactive renin secretion to regulated active renin secretion. When grown to postconfluence for at least two days in media containing fetal bovine serum or insulin-like growth factor-1, the formation of cell-cell contacts via N-cadherin triggered downstream cellular signaling cascades and activated smooth muscle-specific genes, culminating in phenotypic switching to a regulated active renin secretion phenotype, including responding to the key stimuli of active renin secretion. With the use of phenotype-switched As4.1 cells, we provide the first evidence that active renin secretion via exocytosis is regulated by phosphorylation/dephosphorylation of the 20 kDa myosin light chain. The molecular mechanism of phenotypic switching in As4.1 cells described here could serve as a working model for full phenotypic modulation of other secretory cell lines with incomplete phenotypes.

INTRODUCTION

Research into the regulatory mechanisms of secretion at the cellular, biochemical, and molecular levels has been severely impeded due to the difficulties in obtaining sufficient quantities of homogeneous secretory cells from living organisms. To overcome this impediment, a number of clonal cell lines have been established. However, phenotypic switching and instability are common problems encountered with all established secretory cell lines. For example, in the most intensively studied insulin-secreting cell lines, cell-cell contacts via E-cadherin have been shown to restore the secretory response to glucose, albeit not to the level of pancreatic β cells in vivo [1-3]. The underlying molecular mechanism of how cell-cell contacts via E-cadherin improve the secretory response to glucose remains unknown.
Juxtaglomerular (JG) cells, which are located in the afferent arterioles at the entrance to the glomerulus in the kidney, synthesize, store, and secrete renin in response to diverse stimuli [4]. Renin plays important roles in the control of blood pressure and salt and water balance in the body, but it is also involved in the pathogenesis of diverse cardiovascular and metabolic diseases [4,5]. Given the important roles of renin in health and diseases, control of renin secretion has been an intensive subject of study for decades [4]. As JG cells constitute 0.001%–0.01% of the total renal cell population [6], and isolated JG cells in culture stop expressing renin after only a few days [7]. Thus, there have been continuous efforts to establish immortal JG cell lines [7-10]. All JG cell lines established to date, including As4.1, which were established from transgenic mice using gene-fused Ren-2 and nuclear oncogene SV40 T antigen [10], have been shown to constitutively secrete inactive renin (prorenin) without responding to any known stimuli of active renin secretion [11-17]. The elucidation of the molecular mechanisms underlying phenotype switching of JG cell lines from constitutive inactive renin secretion to regulatory active renin secretion is currently a challenging and unresolved issue in the research field of renin secretion.
Renal JG cells express both renin and smooth muscle contractile proteins [6]. Smooth muscle cells are interesting in that they are not terminally differentiated and have many phenotypes that range from a highly proliferative/synthetic state to a fully differentiated/contractile state in response to multiple factors [18,19]. For example, differentiated smooth muscle cells have been reported to express smooth muscle-specific contractile proteins such as smooth muscle myosin heavy chain (sm MHC), whereas subconfluent and rapidly proliferating smooth muscle cells have been reported to express non-contractile proteins, including nonmuscle myosin heavy chain (nm MHC) [19-21]. Thus, sm MHC and nm MHC have been considered as the most representative and stringent molecular markers of differentiated and proliferative smooth muscle cells, respectively. In 1981, Chamley-Campbell & Campbell demonstrated that densely seeding to the point of confluence of vascular smooth muscle cells in culture was an important factor in maintaining a contractile phenotype. Cell-to-cell contact via N-cadherin (N-cad) in smooth muscle cells is also among the key factors determining their differentiated phenotype [22-24], similar to what has been observed for insulin-secreting cell lines. In particular significance, the altered phenotypes of SV40 T-induced transformed cells can be reversed by high-density culture [25]. Based on the common importance of homotypic cell-cell contacts in the phenotypic modulation of insulin-secreting cells and smooth muscle cells, we explored the possibility that As4.1 cells cultured to confluence to induce cell-cell contacts might recapitulate the regulatory active renin secretory phenotype of JG cells in vivo.

METHODS

Materials

The clonal murine JG cell line As4.1 was obtained from the American Type Culture Collection (ATCC CRL2193, batch F-13056, passage number 16; ATCC, Manassas, VA, USA). Dulbecco's modified eagle medium (DMEM) and fetal bovine serum (FBS) were purchased from Gibco (Grand Island, NY, USA). Forskolin, isoproterenol, ML-7 [1-(5-chloronaphthalene-1-sulfonyl)-1H-hexahydro-1,4-diazepine], neutral red (2-methyl-3-amino-7-dimethylamino-phenazine), and 3-(4,5-dimethylthiazole-2-yl)-2,5-diphenyl-2H-tetrazolium bromide (MTT) were purchased from Sigma Chemical (St. Louis, MO, USA). The following antibodies were used: anti-non-muscle and smooth muscle-type myosin heavy chain (K-39; Sigma Chemical), polyclonal antibodies to smooth muscle myosin light chain of 20 kD (MLC20; unphospho, #3672; monophospho-Ser19, #3671; Cell Signaling, Denver, MA, USA), polyclonal anti-protein phosphatase 1β (Upstate Biotechnology, Lake Placid, NY, USA), anti-N-cadherin (#610920; BD Bioscience, San Jose, CA, USA), and monoclonal anti-mouse submandibular gland renin (CH-1723 Marly 1; Swant, Bellinzona, Switzerland). Antibodies against myocardin related transcription factor-A [MRTF-A (C-19) sc-21558] and SRF [(A-11) sc-25290] were obtained from Santa Cruz Biotechnology (Santa Cruz, CA, USA). Genes encoding N-cad, MRTF-A, and serum response factor (SRF) were knocked out by clustered regularly interspaced short palindromic repeats (CRISPR)/CRISPR-associated (Cas) 9 knockout plasmids of murine MRTF-A (sc-432390), SRF (sc-423154-HDR) and N-cad (sc-419593). Small interfering RNA for MYLK (sc-35942) and PP1β (sc-36296) were obtained from Santa Cruz Biotechnology; we used 30%–50% more plasmids than the supplier recommended. Recombinant IGF-1 (#GF138) and IGF-antibodies (#05-172) were purchased from Millipore (Darmstadt, Germany). N-[2-[4(4-chlorophenyl)amino]-1-methyl-2-oxooethoxy]-3,5-bis(trifluoromethyl)-benzamide (CCG-1423) was purchased from Cayman Chemical (Ann Arbor, MI, USA). An angiotensin I (ANG I) radioimmunoassay (RIA) kit was purchased from NEN Life Science Products (Boston, MA, USA). Mouse renin and prorenin enzyme-linked immunosorbent assay (ELISA) kits were obtained from Ray Biotech Inc. (Norcross, GA, USA) and Molecular Innovations (Novi, MI, USA), respectively. All other chemicals were of the highest reagent grade available and were obtained from Sigma Chemical.

Cell culture

The JG cell line at passage 20–30 was maintained in DMEM supplemented with 10% FBS, penicillin (100 U/ml), and streptomycin (100 μg/ml) at 37°C in a humidified atmosphere of 5% CO2. To characterize As4.1 cell growth, cells were seeded on 24-well plastic plates (surface area, 2 cm2; Corning Glass Works, Corning, NY, USA) at an initial density of approximately of 5 × 10³ cells/well and grown for up to 10 days. Cells were detached with trypsin/EDTA every day and cell numbers were counted using a hemocytometer. For determination of active renin secretion, cells were seeded in 24-well plates at an initial density of 5 × 10⁴ cells/well and grown to 100% confluence for four days after plating. After confluence was reached, cells were maintained in the presence of 10% FBS or FBS-free DMEM for two additional days, and experiments were conducted. Mycoplasma infection was checked once per month.

Cell viability

Cell viability was assessed using 3-(4,5-dimethylthiazol-2-yl)-2,5-diphenyl-2H-tetrazolium bromide (MTT) as described [26]. MTT was dissolved in 500 μl of dimethyl sulfoxide and added to cells plated in 24-well plastic plates at a final concentration of 1 mg/ml. Then, cells were incubated for 3 h at 37°C. The optical density of media was read at 540 nm using a microplate reader (Molecular Devices, Palo Alto, CA, USA). Each experiment was performed in triplicate and repeated six times.

Nuclear extraction

Nuclear extracts were prepared from As4.1 cells using the NE-PER Nuclear Extraction Kit from Pierce Biotechnology (Rockford, IL, USA) according to the manufacturer’s recommendations.

Assessment of renin activity and content by RIA and ELISA

In preliminary experiments, As4.1 cells were cultured in DMEM + 10% FBS in 24-well plates to 70%–80% confluence or to 100% confluence and maintained at 37°C either in the presence of 10% FBS or in FBS-free DMEM. After confluence was reached, culture media were collected every day for four days and measured for active renin activity. Since the rate of active renin secretion was significantly increased and maintained in the presence of 10% FBS, most subsequent experiments were conducted on day 2 postconfluence in DMEM containing 10% FBS. Unless stated otherwise, on day 2 postconfluence, media were replaced with 1 ml of fresh DMEM containing 10% FBS for 1 h (control period) and then at subsequent 1-h intervals with either the same DMEM + 10 % FBS (time control sample) or DMEM containing various agents (experimental period). An aliquot of the collected incubation medium was incubated with plasma from 48-h nephrectomized rabbits, and renin activity was measured by RIA based on the generation of ANG I, as previously described [27]. To assay inactive renin, an aliquot of incubation medium was first incubated with ~1,000 μg/ml trypsin for 30 min on ice; then, a two-fold excess of soybean trypsin inhibitor was added to inactivate the trypsin. The samples were assayed for ANG I as described above. Inactive renin activity was calculated by subtracting the active renin activity from the total renin activity. Recently, renin ELISA kits have become available; secreted active renin and inactive renin (prorenin) were measured using commercial mouse renin ELISA kits from Ray Biotech and Molecular Innovations, respectively. Since the measured values of secreted renin were found to vary with the amount of sample volume, a fixed volume of 50 µl was always used.

Western blot analysis

At the end of the incubation period, the reaction was stopped by aspiration of the incubation medium, and cells were immediately disrupted by scraping them in 1 ml of lysis buffer (1% Nonidet P-40, 100 mM sodium pyrophosphate, 250 mM NaCl, 50 mM NaF, 5 mM EGTA, 0.1 mM PMSF, 10 ug/ml leupeptin, 15 mM β-mercaptoethanol, and 20 mM Tris-HCl [pH 7.9]), which is known to prevent dephosphorylation of phosphorylated proteins, including myosin [28]. The lysates were centrifuged at 100,000 × g for 60 min. Protein concentrations of the supernatants were measured by the Bradford method [29] using a BSA standard. Proteins (40–80 μg/lane) were resolved on a 7.5% or 15% SDS-PAGE slab gel as previously described [28]. Separated proteins were transferred to polyvinylidene difluoride membranes and incubated first with primary antibodies and then with secondary antibodies conjugated with horseradish peroxidase. Immunoreactive bands were visualized with an enhanced chemiluminescence (ECL) detection kit (Amersham Bioscience, Piscataway, NJ, USA) and quantified by densitometry.

Confocal immunofluorescence microscopy

Dispersed cells were fixed with 4% formaldehyde for 10 min and permeabilized with 0.2% Triton X-100 in PBS for 10 min at room temperature. After blocking with 5% BSA in PBS for 60 min, cells were immunostained with antibodies against-N-cad or MRTF-A overnight at 4°C and visualized with FITC-labelled secondary antibodies. For nuclear staining, cells were incubated with propidium iodide (DAPI) for 5 min at room temperature. Coverslips were imaged using a Carl Zeiss LSM 700 confocal microscope coupled to Zen imaging software (Carl Zeiss, Jena, Germany).

Imaging of cytoplasmic renin and its secretion

To visualize renin secretory granules and observe renin discharge, As4.1 cells on day 2 postconfluence were plated onto coverslips, fixed, and permeabilized. Cells were then immunostained with primary antibodies (1:100) and visualised with FITC-conjugated secondary antibodies (1:1,000; control). Another group of cells were incubated with ML-7 (6 × 10⁻⁵ M) for 2 min and then washed. Cells were then immunostained as above (ML-7) (n = 3 for each group). For real-time imaging, As4.1 cells plated on coverslips were loaded with neutral red by incubation in DMEM containing 100 μM neutral red for 3 h at 37°C. Neutral red was used for vital staining of granules in JG cells in mice [30]. The neutral red preloaded cells were washed three times with DMEM to remove extracellular dye. The chamber containing the cells was then mounted on the bottom of the perfusion chamber. This chamber was placed on the stage of an inverted microscope (TE-300; Nikon, Tokyo, Japan) and perfused for 30 min with 1 ml/min DMEM and then with DMEM containing 6 × 10⁻⁵ M ML-7. The cells were illuminated with a monochromatic light through a 470 ± 12-nm filter (Chroma Technologies, Brattleboro, VT, USA); this elicits a pH-independent, isosbestic absorbance for the wavelength of neutral red. Images observed through an objective lens (×100, oil lens, numerical aperture 1.3) with a differential interference contrast prism were recorded using a black and white charge-coupled device camera (FTM800; Crescent electronics, Sandy, UT, USA). Images were captured and recorded every 33 ms (30 frames/s) using Image-Pro software (Mediacybernetic Inc., Silver Spring, MD, USA).

Statistical analysis

All values are reported as the mean ± 1 SD. Groups were compared using Student’s paired and unpaired t-tests. For more than two groups, analysis of variance followed by the Bonferroni test was used. Differences were considered statistically significant at p < 0.05.

RESULTS

Cell growth and N-cad expression
As4.1 cells seeded at an initial density of 3 × 10³ cells/well in DMEM supplemented with 10% FBS grew with a doubling time of 1.96 ± 0.14 days (n = 3) and reached a plateau (1.7 × 10⁶ cells) 10 days after plating (Fig. 1A). Phase-contrast micrographs showed 70% confluence (Fig. 1B, left panel, ×200) and 100% confluence with a completely covered monolayer (Fig. 1B, right panel, ×200). Upon confluence, cell-to-cell contacts among neighboring As4.1cells are likely mediated by homophilic interactions of cadherin [22,31]. However, the subfamilies of cadherins expressed in As4.1 cells are unknown. When we investigated the expression in confluent As4.1cells, we found that among the three classical cadherins, only N-cadherin (N-Cad, 130 kDa) was expressed in As4 cells after reaching confluence (Fig. 1C, third panel). Fig. 1D shows that As4.1 cells at ~70% confluence (upper panel) expressed far less N-cad than cells at 100% confluence (lower panel).

Effect of confluence on active and inactive renin secretion

In our preliminary experiments, As4.1 cells cultured to 70%–80% confluence in DMEM supplemented with 10% FBS on 24-well culture plates secreted 36.8 ± 4.50 ng of ANG I/well/h of active renin and 1,449 ± 209 ng of ANG I/well/h inactive renin (n = 6) (Table 1), indicating that inactive renin is the primary secreted form, as reported previously [10,13]. ML-7, an inhibitor of myosin light-chain kinase [32], which was found to be a potent stimulator of renin secretion in our previous study with renal cortical slices [27,33], affected neither active nor inactive renin secretion (Table 1). These results confirmed that As4.1 cells constitutively secrete inactive renin and do not respond to a potent stimulus of active renin secretion. However, after confluence, the general trend of active renin secretion tended to be greater and was maintained better in the presence of 10% FBS than in its absence (Table 2). Secretion of active renin (37 kDa) and inactive prorenin (47 kDa), as previously reported in As4.1 cells. Before and after confluence in the presence of 10% FBS, cell viability was determined using a microtiter plate-based MTT assay [26]. There was no significant difference in cell viability after confluence compared with preconfluent cells after normalization for the ~30% more cells in the 100% confluence sample. Based on these preliminary studies, subsequent experiments were conducted on day 2 postconfluence in DMEM + 10% FBS.
Our first concern was whether the FBS included in the incubation media possessed active renin activity, which might yield a difference in the renin activity of day 1 postconfluent cells in DMEM compared with those in DMEM + 10% FBS. However, the renin activity of DMEM alone and DMEM + 10% FBS was extremely low (0.35 ± 0.08 and 0.33 ± 0.24 ng ANG I/ml/h, respectively) without significant difference (n = 4, p > 0.40). The renin concentration of cells in DMEM + 10% FBS as determined by ELISA was below the lower limit of detection of 6 pg/ml. Our results are consistent with those of a previous report that FBS does not have active renin activity [8].
To confirm the preliminary results, the rate of active renin secretion from pre- and postconfluent cells in the absence or presence of 10% FBS was assayed using a renin ELISA kit from Ray Biotech. The rate of active renin secretion was significantly higher in postconfluent cells in the presence of 10% FBS than in preconfluent cells in the presence of 10% FBS or in postconfluent cells in the absence of FBS after reaching 100% confluence (Tables 3 and 4). The mouse active renin kit from Ray Biotech did not react with prorenin.

Identification of FBS components that modulates renin secretion

Among the multiple components of FBS, the specific molecules that stimulate active renin secretion is unknown. Insulin-like growth factor-1 (IGF-1) has been reported to maintain smooth muscle cells in a differentiated state [34]. Therefore, we cultured As4.1 cells in DMEM containing IGF-1 (2.6 × 10⁻¹⁰ M) as a replacement for 10% FBS. The active renin secretion on day 2 postconfluence in the presence of IGF-1 was significantly greater than in the presence of 10% FBS either preconfluence or postconfluence (Table 3). The effect of IGF-1 on active renin secretion was inhibited by 85% upon the addition of an IGF-1-neutralizing antibody (10 µg/ml), suggesting that IGF-1 has a direct and specific effect on active renin secretion (Table 3). To further determine whether the effect of FBS is mediated by IGF-1, an IGF-1 antibody was added to the DMEM + 10% FBS media when cells reached 100% confluence, and cells were cultured for an additional two days. The addition of the IGF-1 antibody completely abolished not only the stimulatory effect of FBS on active renin secretion but also its inhibitory effect on inactive renin secretion (Table 4).

Relationship between active renin and inactive prorenin secretion
Since ELISA kits for active renin and inactive prorenin have become commercially available, we used these kits to determine the relationship between secretion of active renin and inactive renin (prorenin) from As4.1 cells (Figs. 2 and 3). ML-7 and forskolin, both of which are known to increase active renin secretion from JG cells in vivo and in vitro [4,33,35,36], stimulated active renin secretion from postconfluent As4.1 cells (Fig. 3C, E) but inhibited inactive renin secretion (Table 5). Calyculin A, an inhibitor of protein phosphatase [37], inhibited active renin secretion [33,38], increased prorenin secretion (Table 5). Interestingly, FBS and IGF-1 also stimulated active renin secretion (Tables 3 and 4) but reduced prorenin secretion following confluence (Table 4), which was completely reversed by addition of the IGF-1 antibody (Tables 3 and 4). All these results indicate an inverse relationship between active and inactive renin secretion. This experiment is the first to demonstrate the feasibility of measuring secreted active renin and inactive renin directly under specified assay conditions rather than indirectly by measuring ANG I generated by enzymatic activity of renin, which has been traditionally used since 1960s [39].

Identification of an ANG I-generating enzyme in As4.1 cell incubation medium

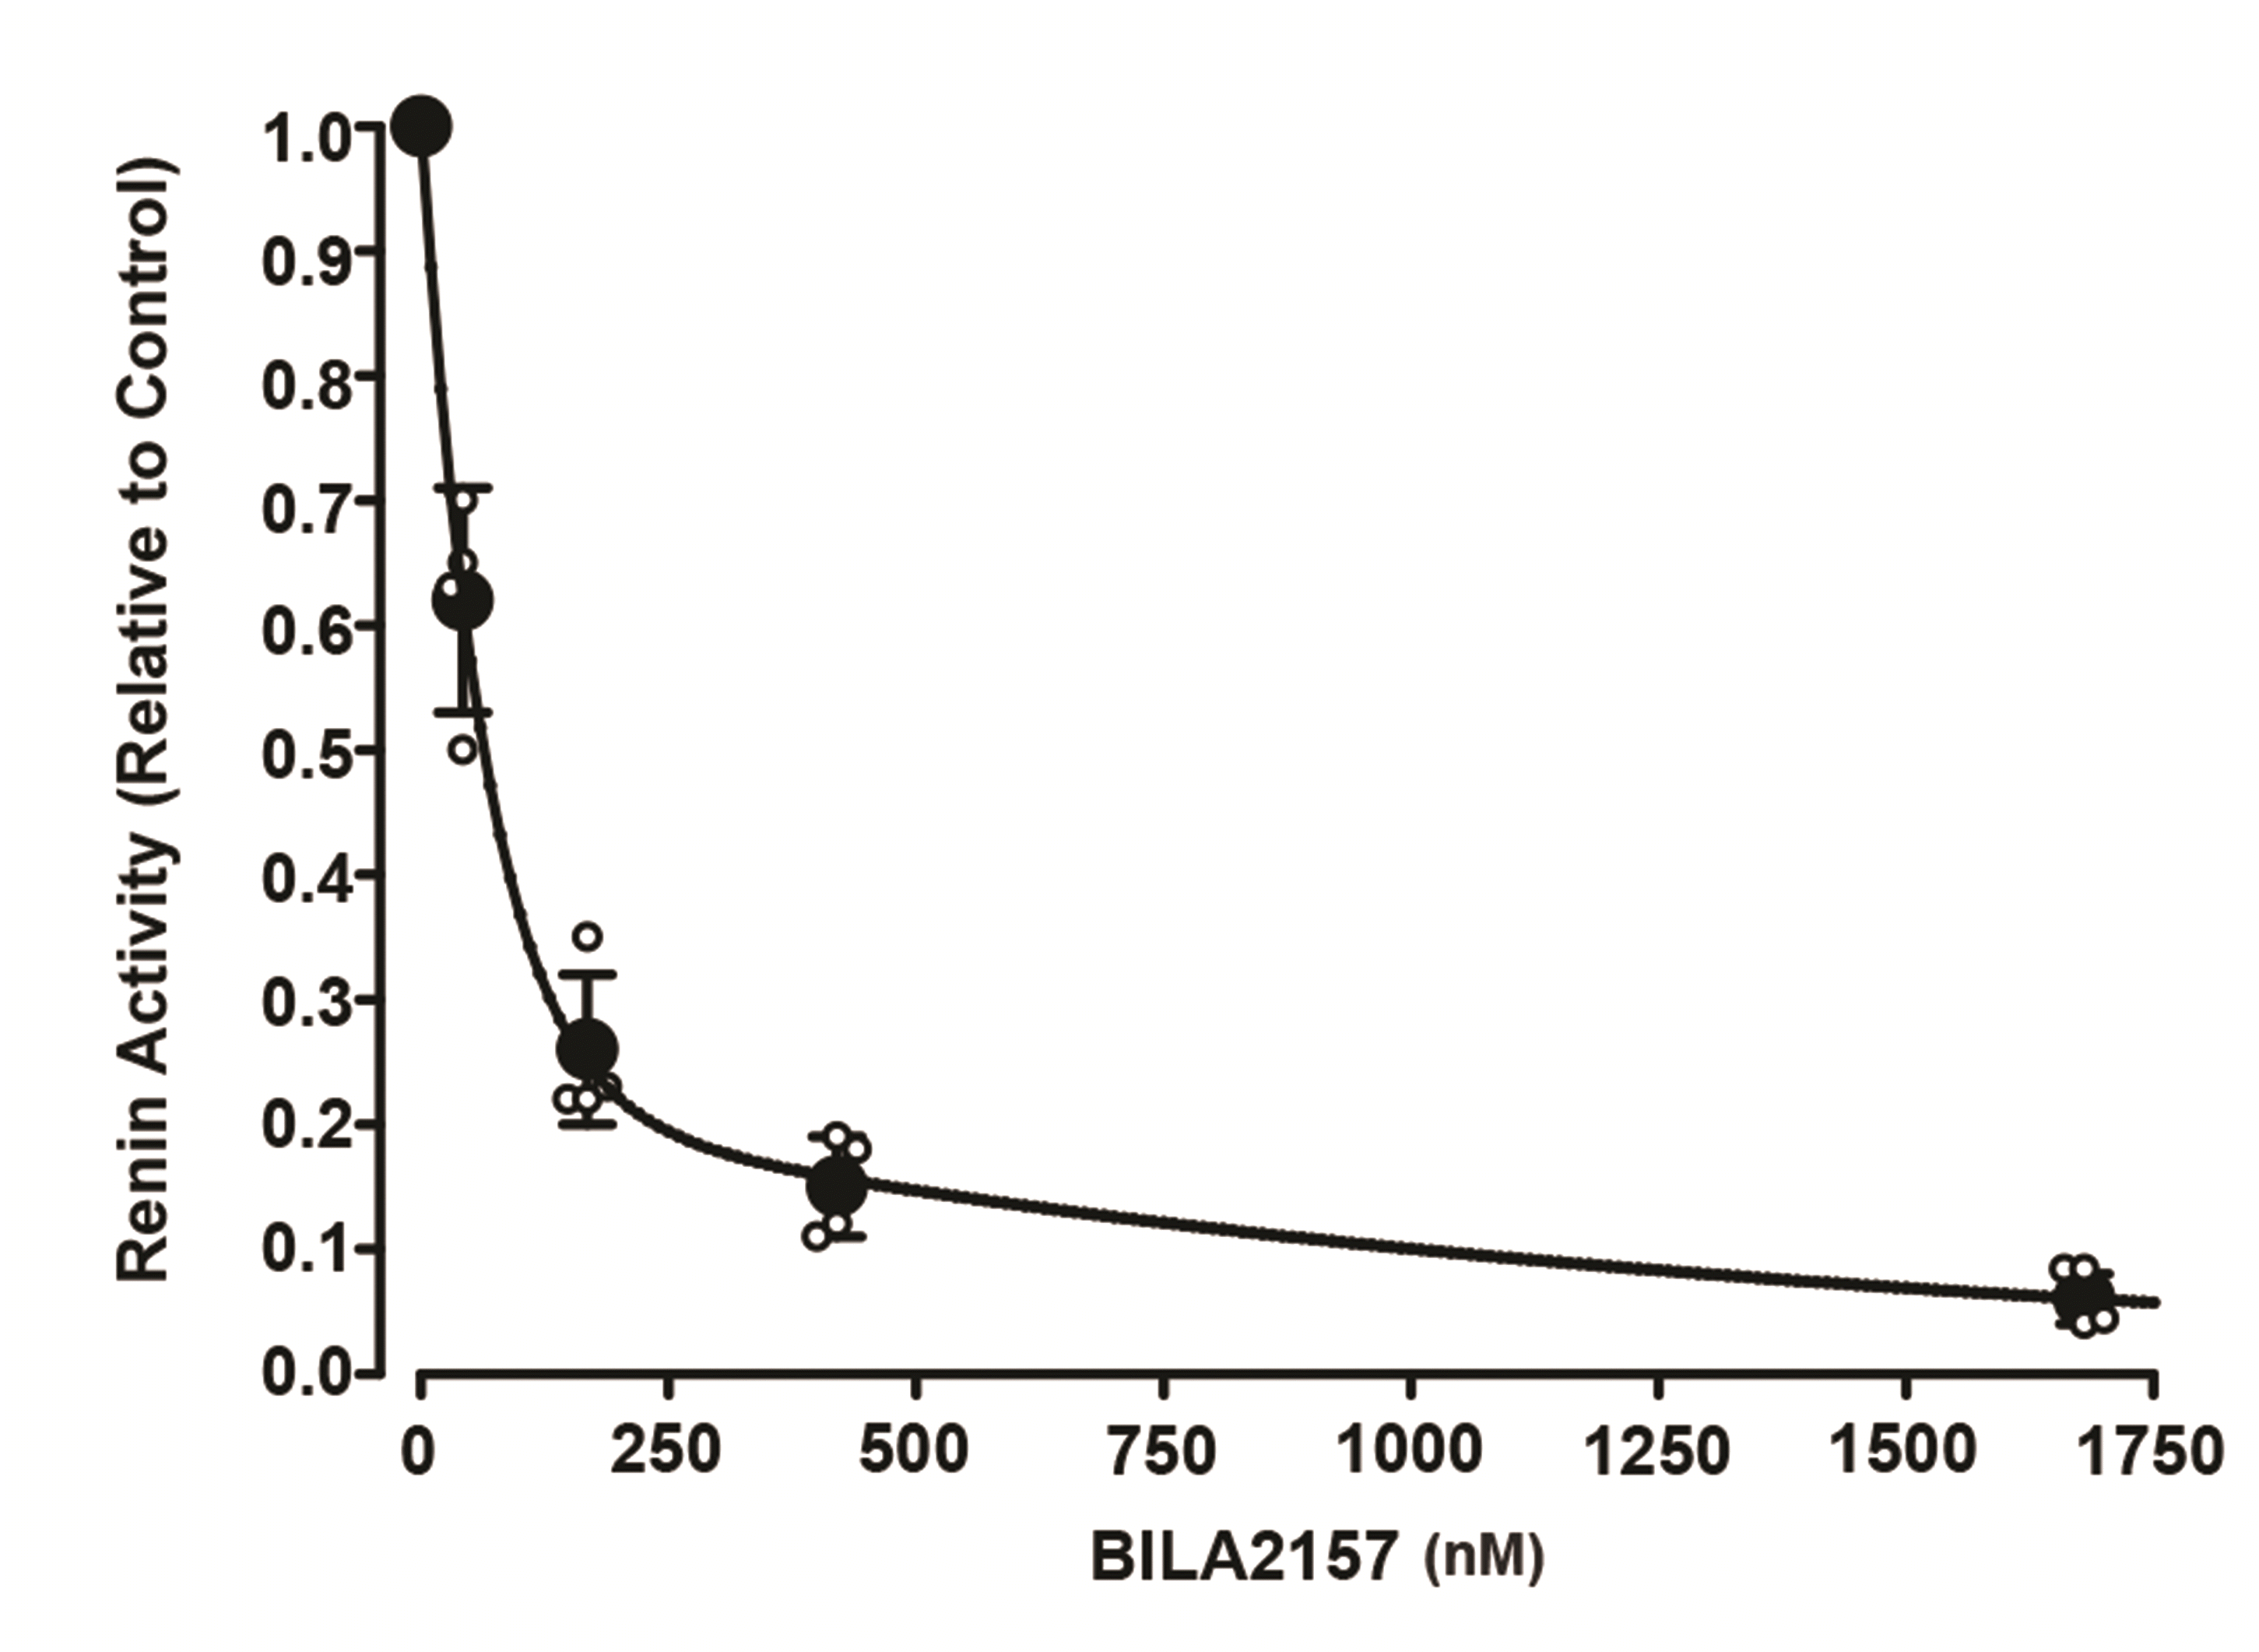
In the 1980s, ultrastructural immunocytochemical studies revealed that renin secretory granules contain lysosomal enzymes such as cathepsin D [13,40]. This lysosomal enzyme has a similar amino acid sequence to renin and possesses renin-like activity [41]. Thus, we investigated whether As4.1 cells secreted active renin or other lysosomal enzymes capable of generating ANG l from angiotensinogen. We investigated this possibility using BILA 2157 BS, which is a synthetic structural analogue of angiotensinogen and thus a potent and selective renin inhibitor with little effect on cathepsin D (IC50 = 540 nM) or pepsin (IC50 = 11,000 nM) [42]. The active renin activity in the absence of BILA 2157 BS was 268.3 ± 56 ng ANG I/ml/h (relative value of 1.0). As seen in Fig. 2, BILA 2157 BS virtually inhibited all renin activity at 1,680 nM, with an IC50 of ~40 nM. This result, along with direct measurements of renin by ELISA (above), strongly indicated that As4.1 cells secreted active renin and generated ANG I with little contribution from lysosomal enzymes.

Effects of known stimuli on active renin secretion

An increase in the intracellular Ca2+ concentration [Ca2+]i inhibited renin secretion by JG cells in renal cortical slices [35,36,43,44]. We tested whether or not Ca2+ inhibited renin secretion in postconfluent As4.1 cells. On day 2 postconfluence, As4.1 cells were incubated at 37°C in Ca2+ -free DMEM containing 1 mM ethylene glycol-bis (β-aminoethyl ether)-N,N,N’,N’,-tetraacetic acid (EGTA) and 10% FBS (−Ca2+ DMEM) followed by 2 mM Ca2+ (+Ca2+ DMEM) for 1 h each. Active renin secretion was significantly inhibited by Ca2+ addition (Fig. 3A, left panel). Conversely, cells were incubated in + Ca2+ DMEM and then in –Ca2+ DMEM for 1 h each. Renin secretion was significantly stimulated by Ca2+ removal (Fig. 3A, right panel). In addition, ionomycin (10−5 M) significantly inhibited renin secretion by 43% (Table 6). These results indicate that an increased [Ca2+]i inhibits renin secretion in As4.1 cells.
Intracellular Ca2+ is thought to inhibit renin secretion via calmodulin (CaM) mediation in renal cortical slices [4,36,43,45]. Calmidazolium, a potent inhibitor of CaM [46], potently stimulated renin secretion in As4.1 cells (Fig. 3B). Another putative inhibitor, ophiobolin A, also stimulated renin secretion (Table 6). ML-7, an inhibitor of myosin light-chain kinase [32], stimulated renin secretion in a dose-dependent manner (10−6–10−4 M) in renal cortical slices [27,35,38,45]. Similarly, ML-7 at 6 × 10⁻⁵ M significantly increased renin secretion in As4.1 cells (Fig. 3C).
Isoproterenol, an unequivocally representative in vivo stimulator of renin secretion [4], significantly stimulated renin secretion at 10−8 M and higher concentrations, with maximal stimulation at 10−6 M (Fig. 3D). Forskolin, a direct activator of adenylyl cyclase [47], significantly stimulated renin secretion at 1 µM and higher concentrations in the presence of 100 µM 3-isobutyl-1-methylxantane (IBMX), a general phosphodiesterase inhibitor (Fig. 3E).

Postconfluent phenotypic switching of As4.1 cells in the presence and absence of FBS
As4.1 cells expressed N-cadherin after confluence (Fig. 1C, D); therefore, we investigated whether the signaling cascade triggered by N-cad induced phenotypic switching. First, we assessed N-cad expression in As4.1 cells. On day 2 postconfluence in the presence of 10% FBS after reaching 100% confluence, the expression levels of N-cad (Fig. 4A, first panel, lane 2; 130 kDa), sm MHC (Fig. 4A, third panel, lane 2; 200 kDa) and protein phosphatase 1β (PP1β; Fig. 4A, fifth panel, lane 2; 37 kDa) were significantly greater than those of preconfluent cells in the presence of 10% FBS (Fig. 4A, lane 1). In postconfluent cells, the expression levels of N-cad, sm MHC, and PP1β were significantly higher in the presence of 10% FBS than in its absence (Fig. 4A, third and fifth panels, lane 2 vs. 3). The expression level of nm MHC (200 kDa) in postconfluent cells was significantly lower than that in preconfluent cells (Fig. 4A, fourth panel, lane 2 vs. 1). The expression level of β-actin, used as a loading control, was not different among group lanes. Myocardin related factor-A (MRTF-A; 160 kDa) is a ubiquitously expressed transcriptional cofactor of serum response factor (SRF) and undergoes signal-dependent nucleocytoplasmic shuttling [48,49]. We subsequently sought to determine the intracellular distribution of MRTF-A. The relative levels of whole cellular MRTF-A were not significantly different between preconfluent and postconfluent cells with or without 10% FBS (Fig. 4A, second panel; p > 0.05). However, the MRTF-A level in the nuclear fraction of postconfluent cells both in the presence and absence of 10% FBS was significantly greater than that in the nuclear fraction of preconfluent cells (Fig. 4B, upper panel, lane 2 and 3 vs. lane 1). We confirmed these results by visualizing nuclear MRTF-A by immunofluorescence. The MRTF-A fluorescence overlaid on nuclear DAPI staining of postconfluent As4.1 cells in the presence of 10% FBS was significantly greater than in preconfluent cells (Fig. 4B, lower panel, lane 2 vs. 1). The function of MRTF-A translocated to the nucleus was examined using CCG-1423, a putative MRTF-A nuclear translocation inhibitor [50]. CCG-1423 treatment decreased active renin secretion under control conditions as well as upon stimulation by ML-7 (Fig. 4C).
To further examine the role of MRTF-A in phenotype switching, the MRTF-A gene was knocked out using CRISPR-associated 9 (Cas9) [51]. Compared with cells transfected with control plasmids (Fig. 5A, first panel, lane 1), MRTF-A levels in knockout cells were significantly reduced by 80% (Fig. 5A, first panel, lane 2 vs. 1). This reduced expression of MRTF-A was accompanied by a significant decrease in the expression of sm MHC (Fig. 5A, third panel, lane 2 vs. 1) and PP1β (Fig. 5A, fifth panel, lane 2 vs. 1) and a significant increase in nm MHC expression (Fig. 5A, fourth panel, lane 2 vs. 1). The rate of active renin secretion in MRTF-A knockout cells before and after stimulation with ML-7 was significantly decreased compared with control cells (Fig. 5B). Notably, MRTF-A knockout did not affect N-cad expression (Fig. 5A, second panel, lane 1 vs. 2).
Next, we evaluated the roles of SRF, a serum-induced ubiquitously expressed master transcriptional factor that regulates many genes associated with cell growth and differentiation, as well as smooth muscle-specific genes [52], in the phenotypic switching of As4.1 cells. The SRF gene was knocked out using SRF homology directed repair (HDR) CRISPR/Cas9 plasmids. The SRF (42 kDa) expression in the knockout cells was significantly reduced by 90% (Fig. 6A, first panel, lane 2 vs. 1). In SRF knockout cells, the expression levels of N-cad (Fig. 6A, second panel, lane 2 vs. 1), sm MHC (Fig. 6A, third panel, lane 2 vs. 1), and PP1β (Fig. 6A, fifth panel, lane 2 vs. 1) were significantly decreased, whereas nm MHC expression was significantly increased compared with that in control cells (Fig. 6A, fourth panel, lane 2 vs. 1). The rate of renin secretion from SRF knockout cells was significantly decreased before and after ML-7 stimulation (Fig. 6B). The possibility of FBS-dependent expression of N-cad is mediated by IGF-1 was tested. An IGF-1 neutralizing antibody was added to the DMEM + 10% FBS media when cells reached 100% confluence, and cells were cultured for an additional two days. Addition of the IGF-1 antibody significantly decreased the expression levels of N-cad (Fig. 7, first panel, lane 2 vs. 1) and PP1β (Fig. 7, third panel, lane 2 vs. 1) with increased levels of phosphorylated 20 kDa myosin light chain (pMLC20) (Fig. 7, second panel, lane 2 vs. 1).
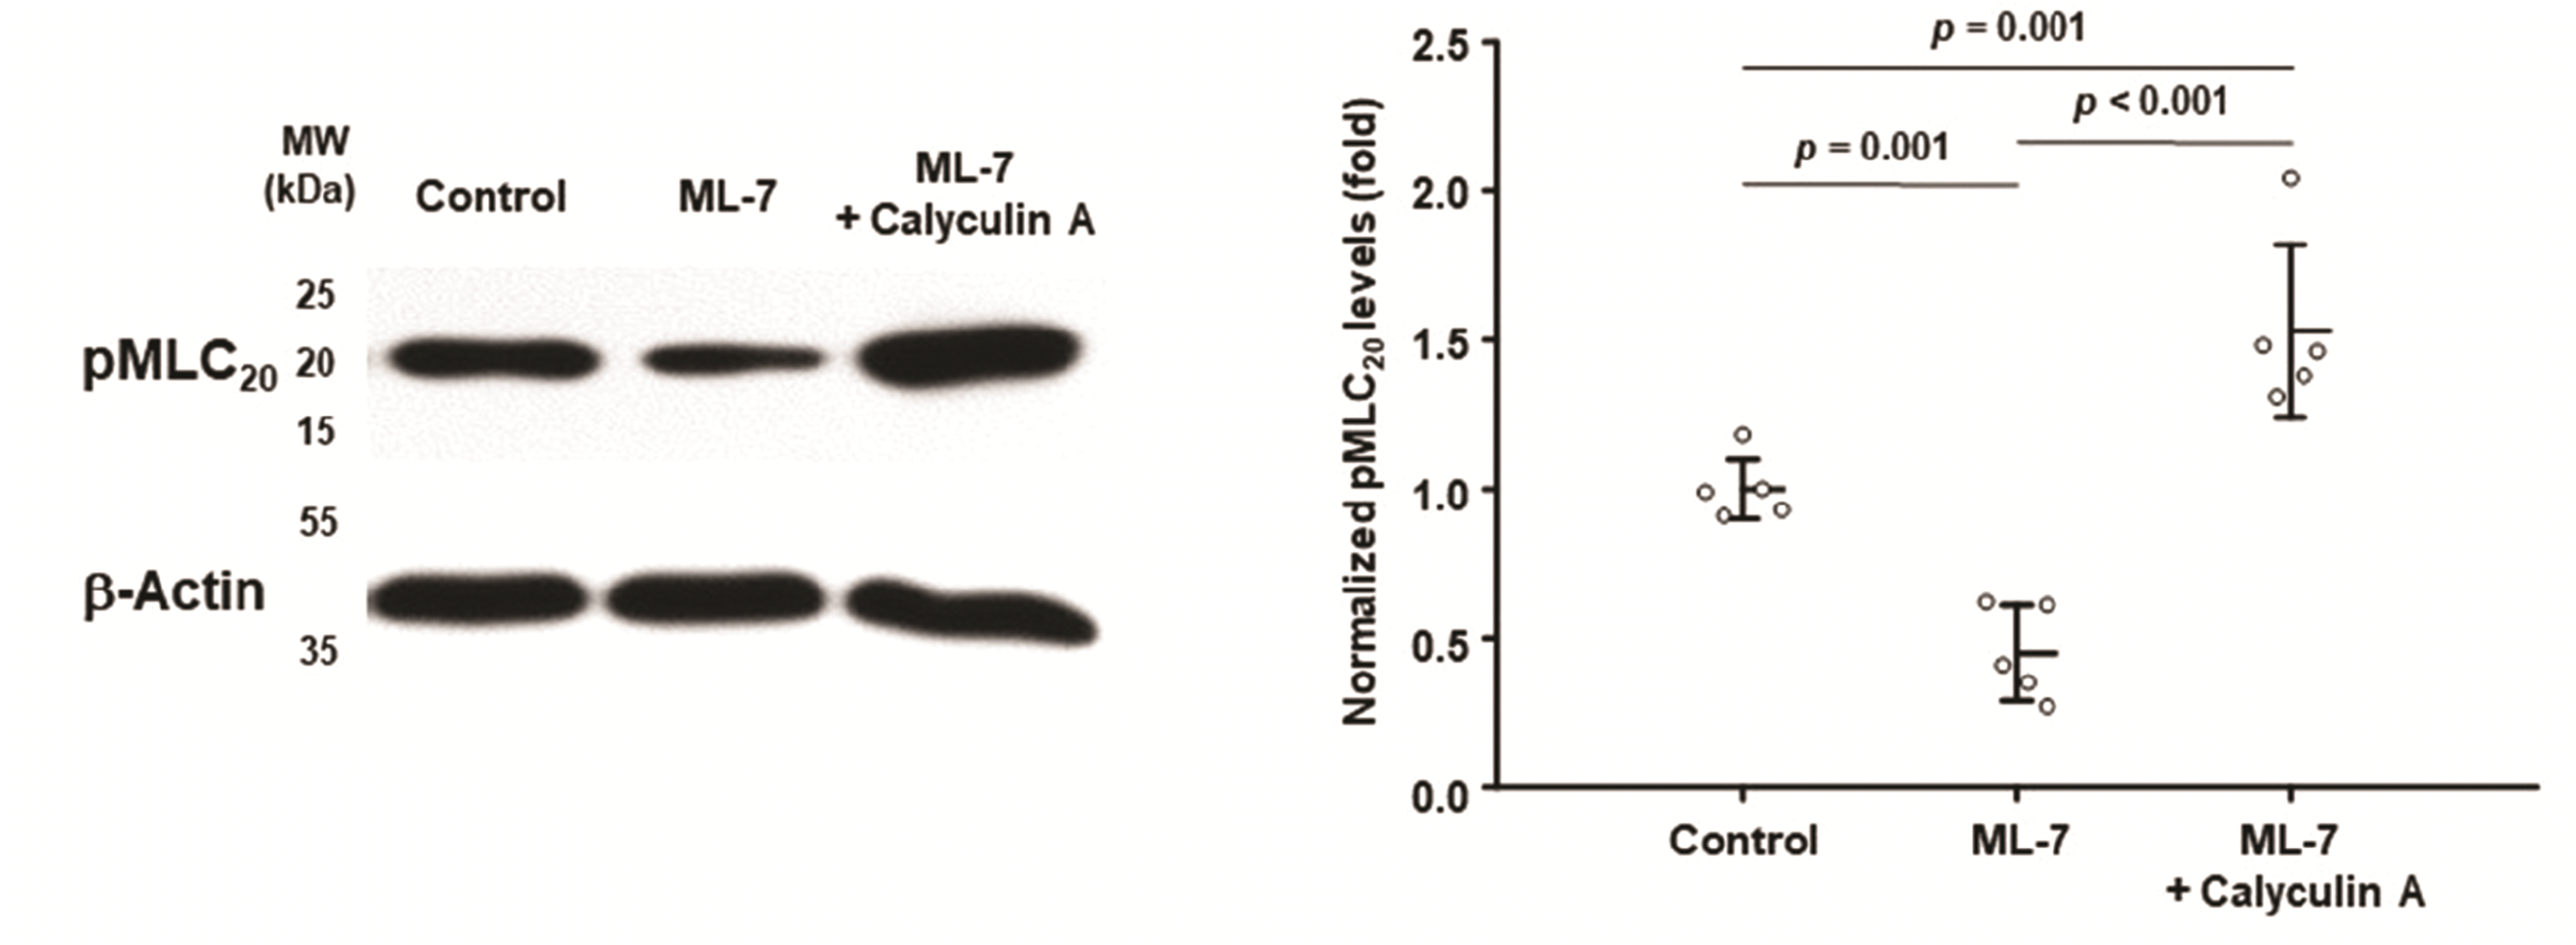
Finally, we tested our hypothesis that active renin secretion is regulated by phosphorylation of MLC20 by MLCK and then dephosphorylation of pMLC20 by PP1β [33,35,38]. First, when cells were treated with siRNA for MYLK, the expression of MLCK (130 kDa) was significantly reduced (Fig. 8, first panel, lane 2 vs. 1). This was accompanied by a significant decrease in pMLC20 (Fig. 8, second panel, lane 2 vs. 1). The rate of active renin secretion from MLCK knockdown cells was significantly increased compared with controls (Fig. 8B). When cells were treated with PP1β siRNA, PP1β (37 kDa) expression was decreased by 80% (Fig. 9, first panel, lane 2 vs. 1), and the pMLC20 level was increased 2-fold (Fig. 9, second panel, lane 2 vs. 1). Active renin secretion with and without ML-7 stimulation was significantly decreased in PP1β knockdown cells (Fig. 9, third panel). When postconfluent As4.1 cells were incubated in DMEM + 10% FBS in the presence of ML-7 (ML-7) or in the presence of both calyculin A and ML-7 (ML-7 + Caly), the level of pMLC20 was significantly decreased by ML-7 (Fig. 10, second lane) but was significantly increased by simultaneous treatment with calyculin A and ML-7 (Fig. 10, third lane) as compared with the control (Fig. 10, first lane).

Visualization and imaging of renin secretory granules and secretion
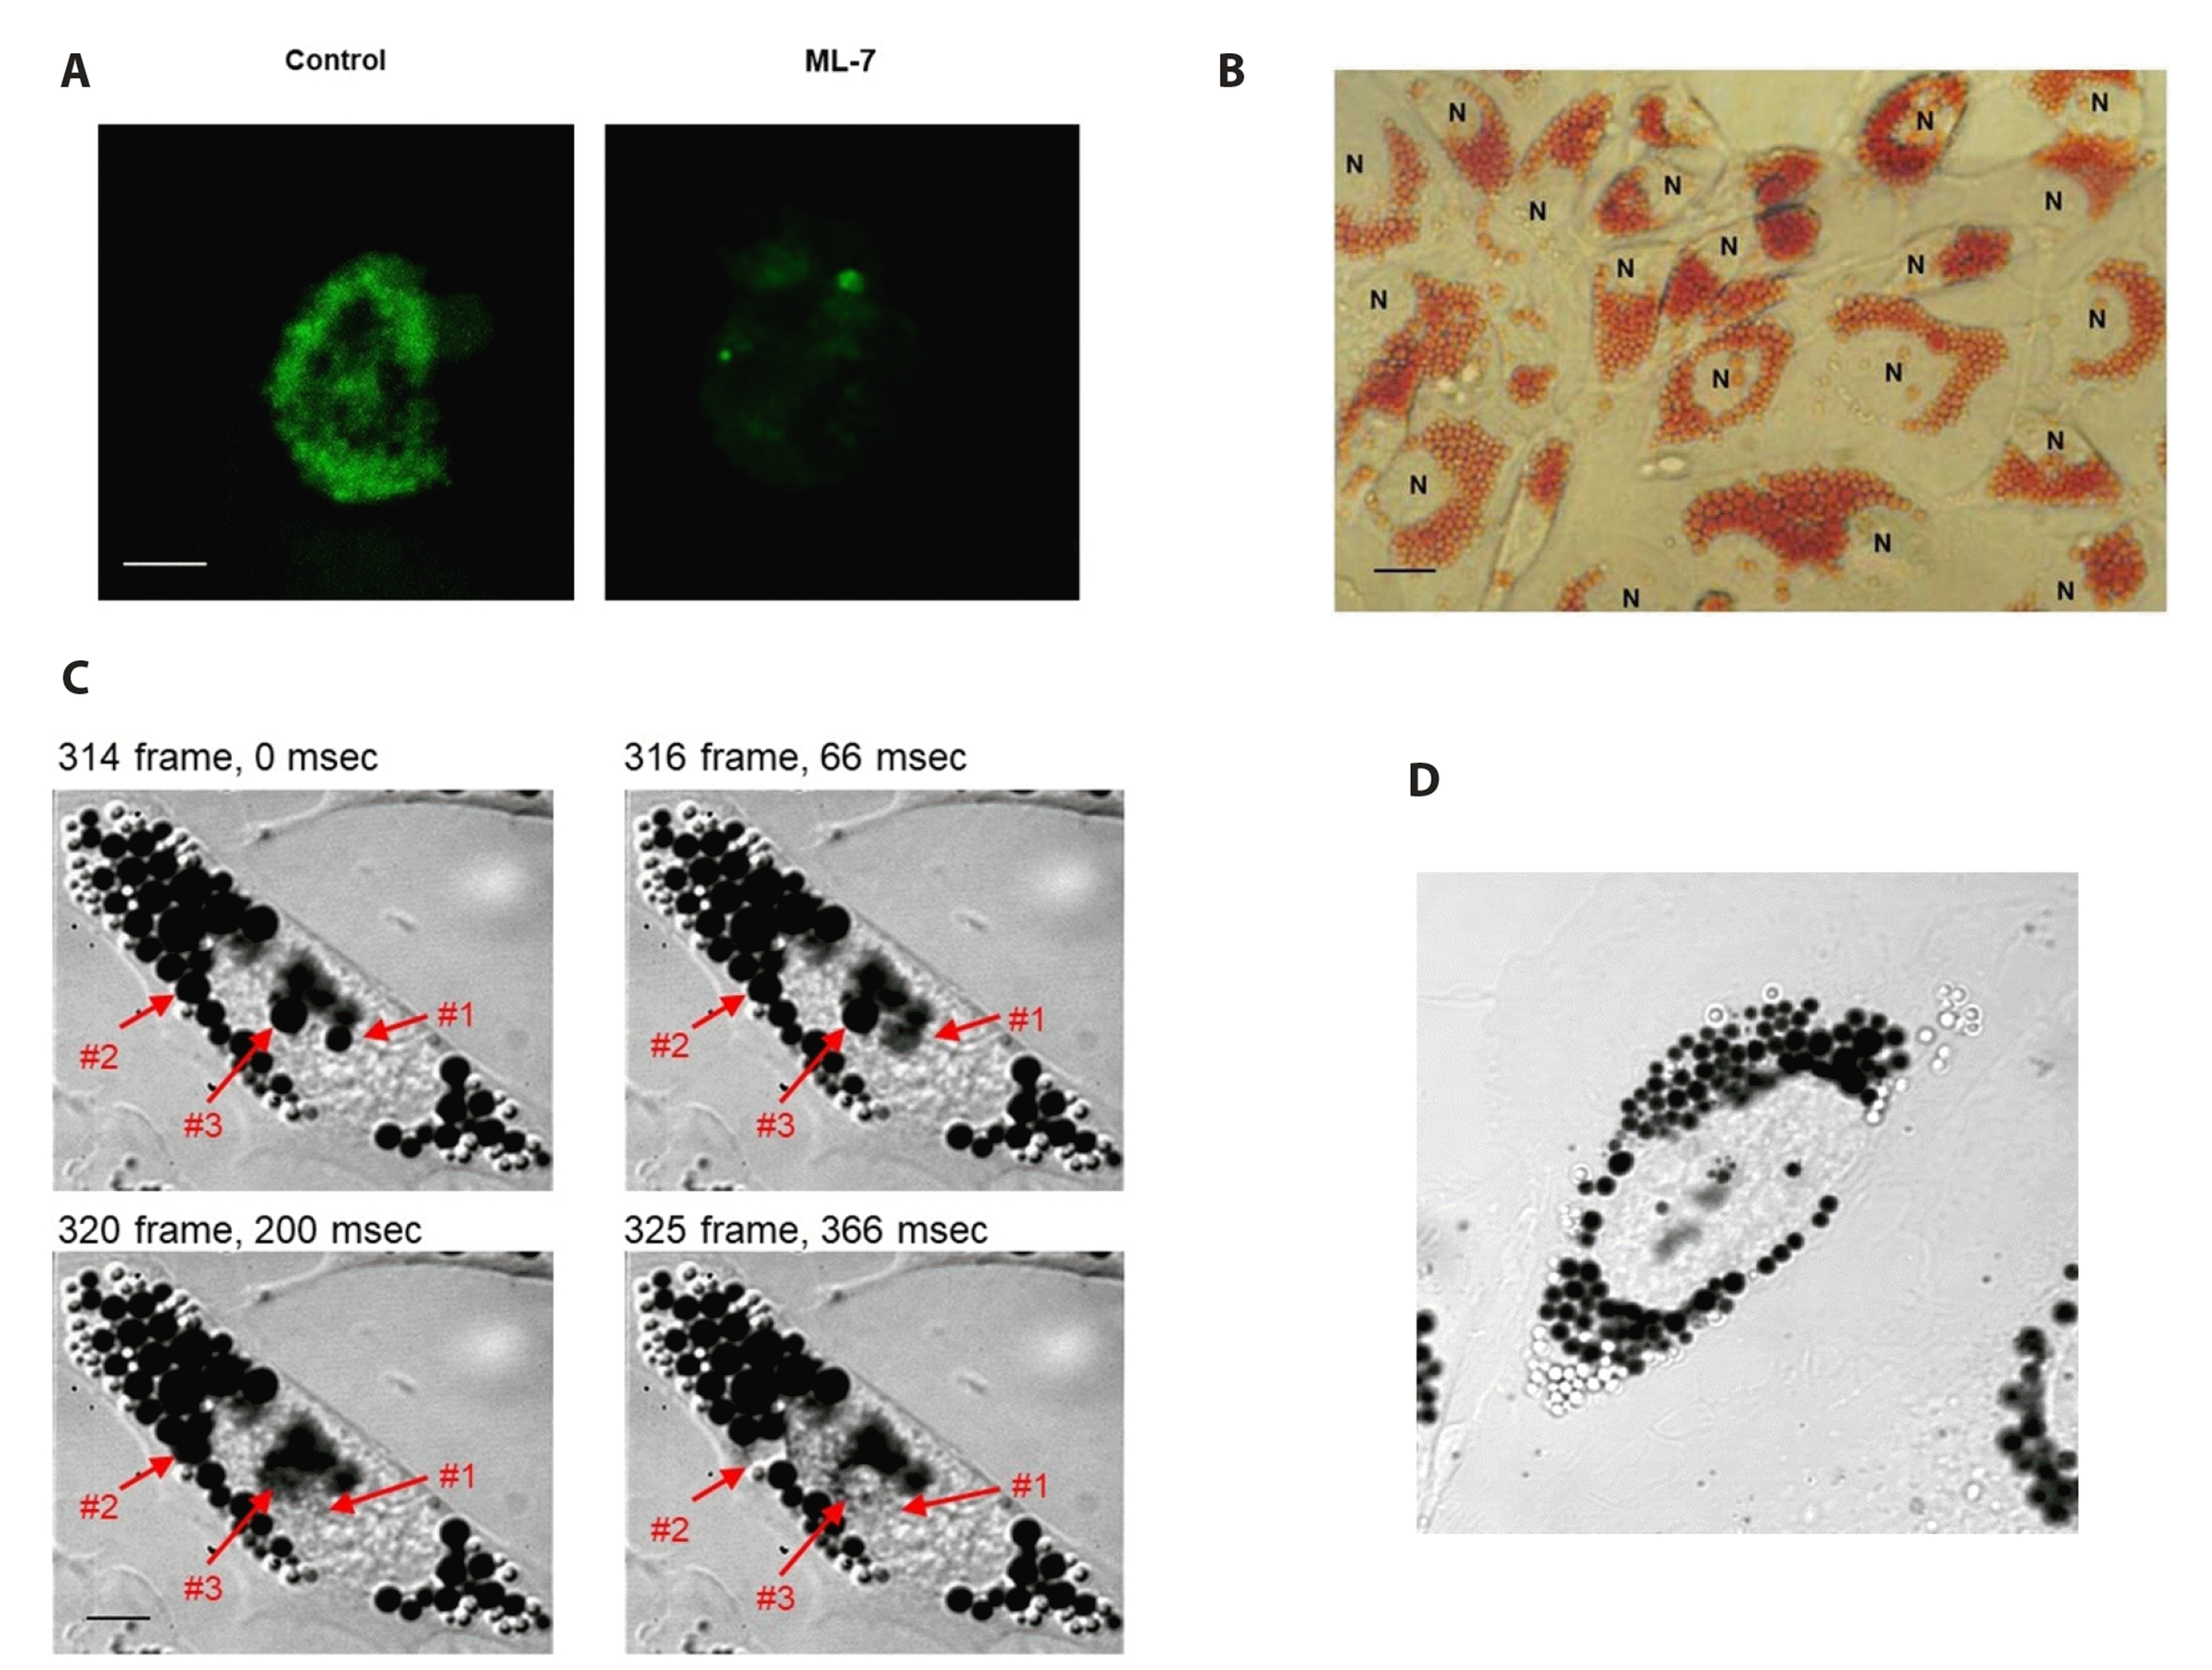
On the day 2 postconfluence, intracellular renin granules were stained with renin antibody, followed by incubation with an FITC-conjugated secondary antibody to visualize renin secretory granules and observe their discharge. A number of spots with a granular appearance were present (Fig. 11A, left panel). When cells were treated with 6 × 10⁻⁵ M ML-7 for 2 min followed by washing with ML-7-free DMEM, almost all of the intracellular granular staining disappeared (Fig. 11A, right panel). When As4.1 cells were preloaded with neutral red, many cytoplasmic granules were seen under light microscopy (Fig. 11B). When cells were viewed at isosbestic absorbance with 470-nm monochromatic light, the cytoplasmic granules appeared dark and round (Fig. 11C). Upon perfusion with ML-7, the granule marked #1 appeared dark round with a sharp margin at time 0, and this granule was covered with a gray cloud with blurred margins at 66 msec. At 200 msec, the granules had completely disappeared. The granules marked #2 and #3 were discharged over ~200 ms (Fig. 11C). The gray cloud over the granules appeared to be neutral red that had been released from the fused granules though through the fusion pore. Exocytic discharge of neutral red without any cellular movement is shown (Fig. 11D, Supplementary Video).

DISCUSSION

Induction of the regulated renin secretory phenotype

Three decades ago, an immortalized clonal renin-expressing As4.1 cell line was established from JG cell tumors of transgenic mice generated by renin-2 promoter-directed expression of the SV 40 T antigen [10]. Unfortunately, As4.1 cells were shown to constitutively secrete mostly inactive prorenin with little active renin and did not respond to known stimuli of active renin secretion [11-17]. In the present study, we were able to induce As4.1 cell phenotype switching from constitutive inactive renin (prorenin) secretion to regulated active renin secretion by growing As4.1 cells to confluence in the presence of 10% FBS or IGF-1 (2.6 × 10⁻¹⁰ M). The rate of active renin secretion determined either indirectly by the amount of generated ANG I by renin or directly by renin ELISA was found not to be from FBS, consistent with previous results that FBS does not have active renin activity [8]. Furthermore, BILA 2157 BS, a potent and specific synthetic inhibitor of renin activity [42], almost completely inhibited ANG I generation and excluded the possible involvement of other proteases such as cathepsins (Fig. 2). Taken together, these results indicate that active renin is secreted from As4.1 cells cultured to postconfluence in the presence of FBS or IGF-1.
We next investigated whether active renin secretion by As4.1 cells occurred through a regulated pathway. Active renin secretion was inhibited by Ca2+ (Fig. 3A), ANG II (Table 6), and calyculin A (Table 6) and stimulated by calmidazolium (Fig. 3B), ML-7 (Fig. 3C), isoproterenol (Fig. 4D), and forskolin (Fig. 4E). In addition, the phospholipase C (PLC) inhibitor, U73122 [53], stimulated renin secretion from As4.1 cells (Table 6). Taken together, these results support that As4.1 cells fully regained the regulatory active renin secretory phenotype via Ca2+-CaM-MLCK-, calyculin A-sensitive PP1β-, and cAMP-dependent stimulatory signaling cascades as well as via a PLC-dependent signaling cascade, reflecting what has been observed in JG cells in situ [4,33,35,36,38,43-45]. Thus, As4.1 cells grown to confluence in the presence of FBS or IGF-1 switched to a regulated active renin secretory phenotype and responded to many, if not all, known stimuli of active renin secretion. The magnitude of renin secretory response in As4.1 cells was comparable with that in renal cortical slices or isolated kidneys in response to Ca2+ (Fig. 3A vs. [36,43,44]), calmidazolium (Fig. 3B vs. [36,43]), ML-7 or ML-9 (Fig. 3C vs. [27,35,38,45]), isoproterenol (Fig. 3D vs. [54]), and forskolin (Fig. 3E vs. [36]). Furthermore, we directly measured active and inactive renin secretion using commercially available prorenin ELISA kits rather than the indirect measurement of ANG I produced by secreted renin used since 1969 [39]. We found that the ratio of secretion of inactive renin to active renin in postconfluent As4.1 cells in the presence of 10% FBS was approximately 3 (Table 4), which is similar to the ratio found in healthy adults [55]. Taken together, these results indicate that after reaching confluence in the presence of 10% FBS or IGF-1, As4.1 cells fully recapitulate not only active but also inactive prorenin secretory phenotypes of JG cells in vivo. Therefore, the present study resolved a long-standing and severe impediment to investigating the mechanism of renin secretion at the cellular, biochemical, and molecular levels. At this juncture, notably, As4.1 cells most likely in preconfluent culture secreted active renin in response to 8-bromo—cAMP after 4 and 15 h of incubation [10]. In a subsequent study, c-AMP and forskolin were found not to stimulate active renin secretion within 2 h of incubation [15]. To the best of our knowledge, the As4.1 cell line cultured to confluence in the presence of 10% FBS or IGF-1 would be the first cell line to fully recapitulate the secretory phenotype in the literature. Thus, As4.1 cell line cultures as described here can now be used as an in vitro model of active as well as inactive renin secretion.

N-cad expression at cell-cell contacts triggers phenotype changes
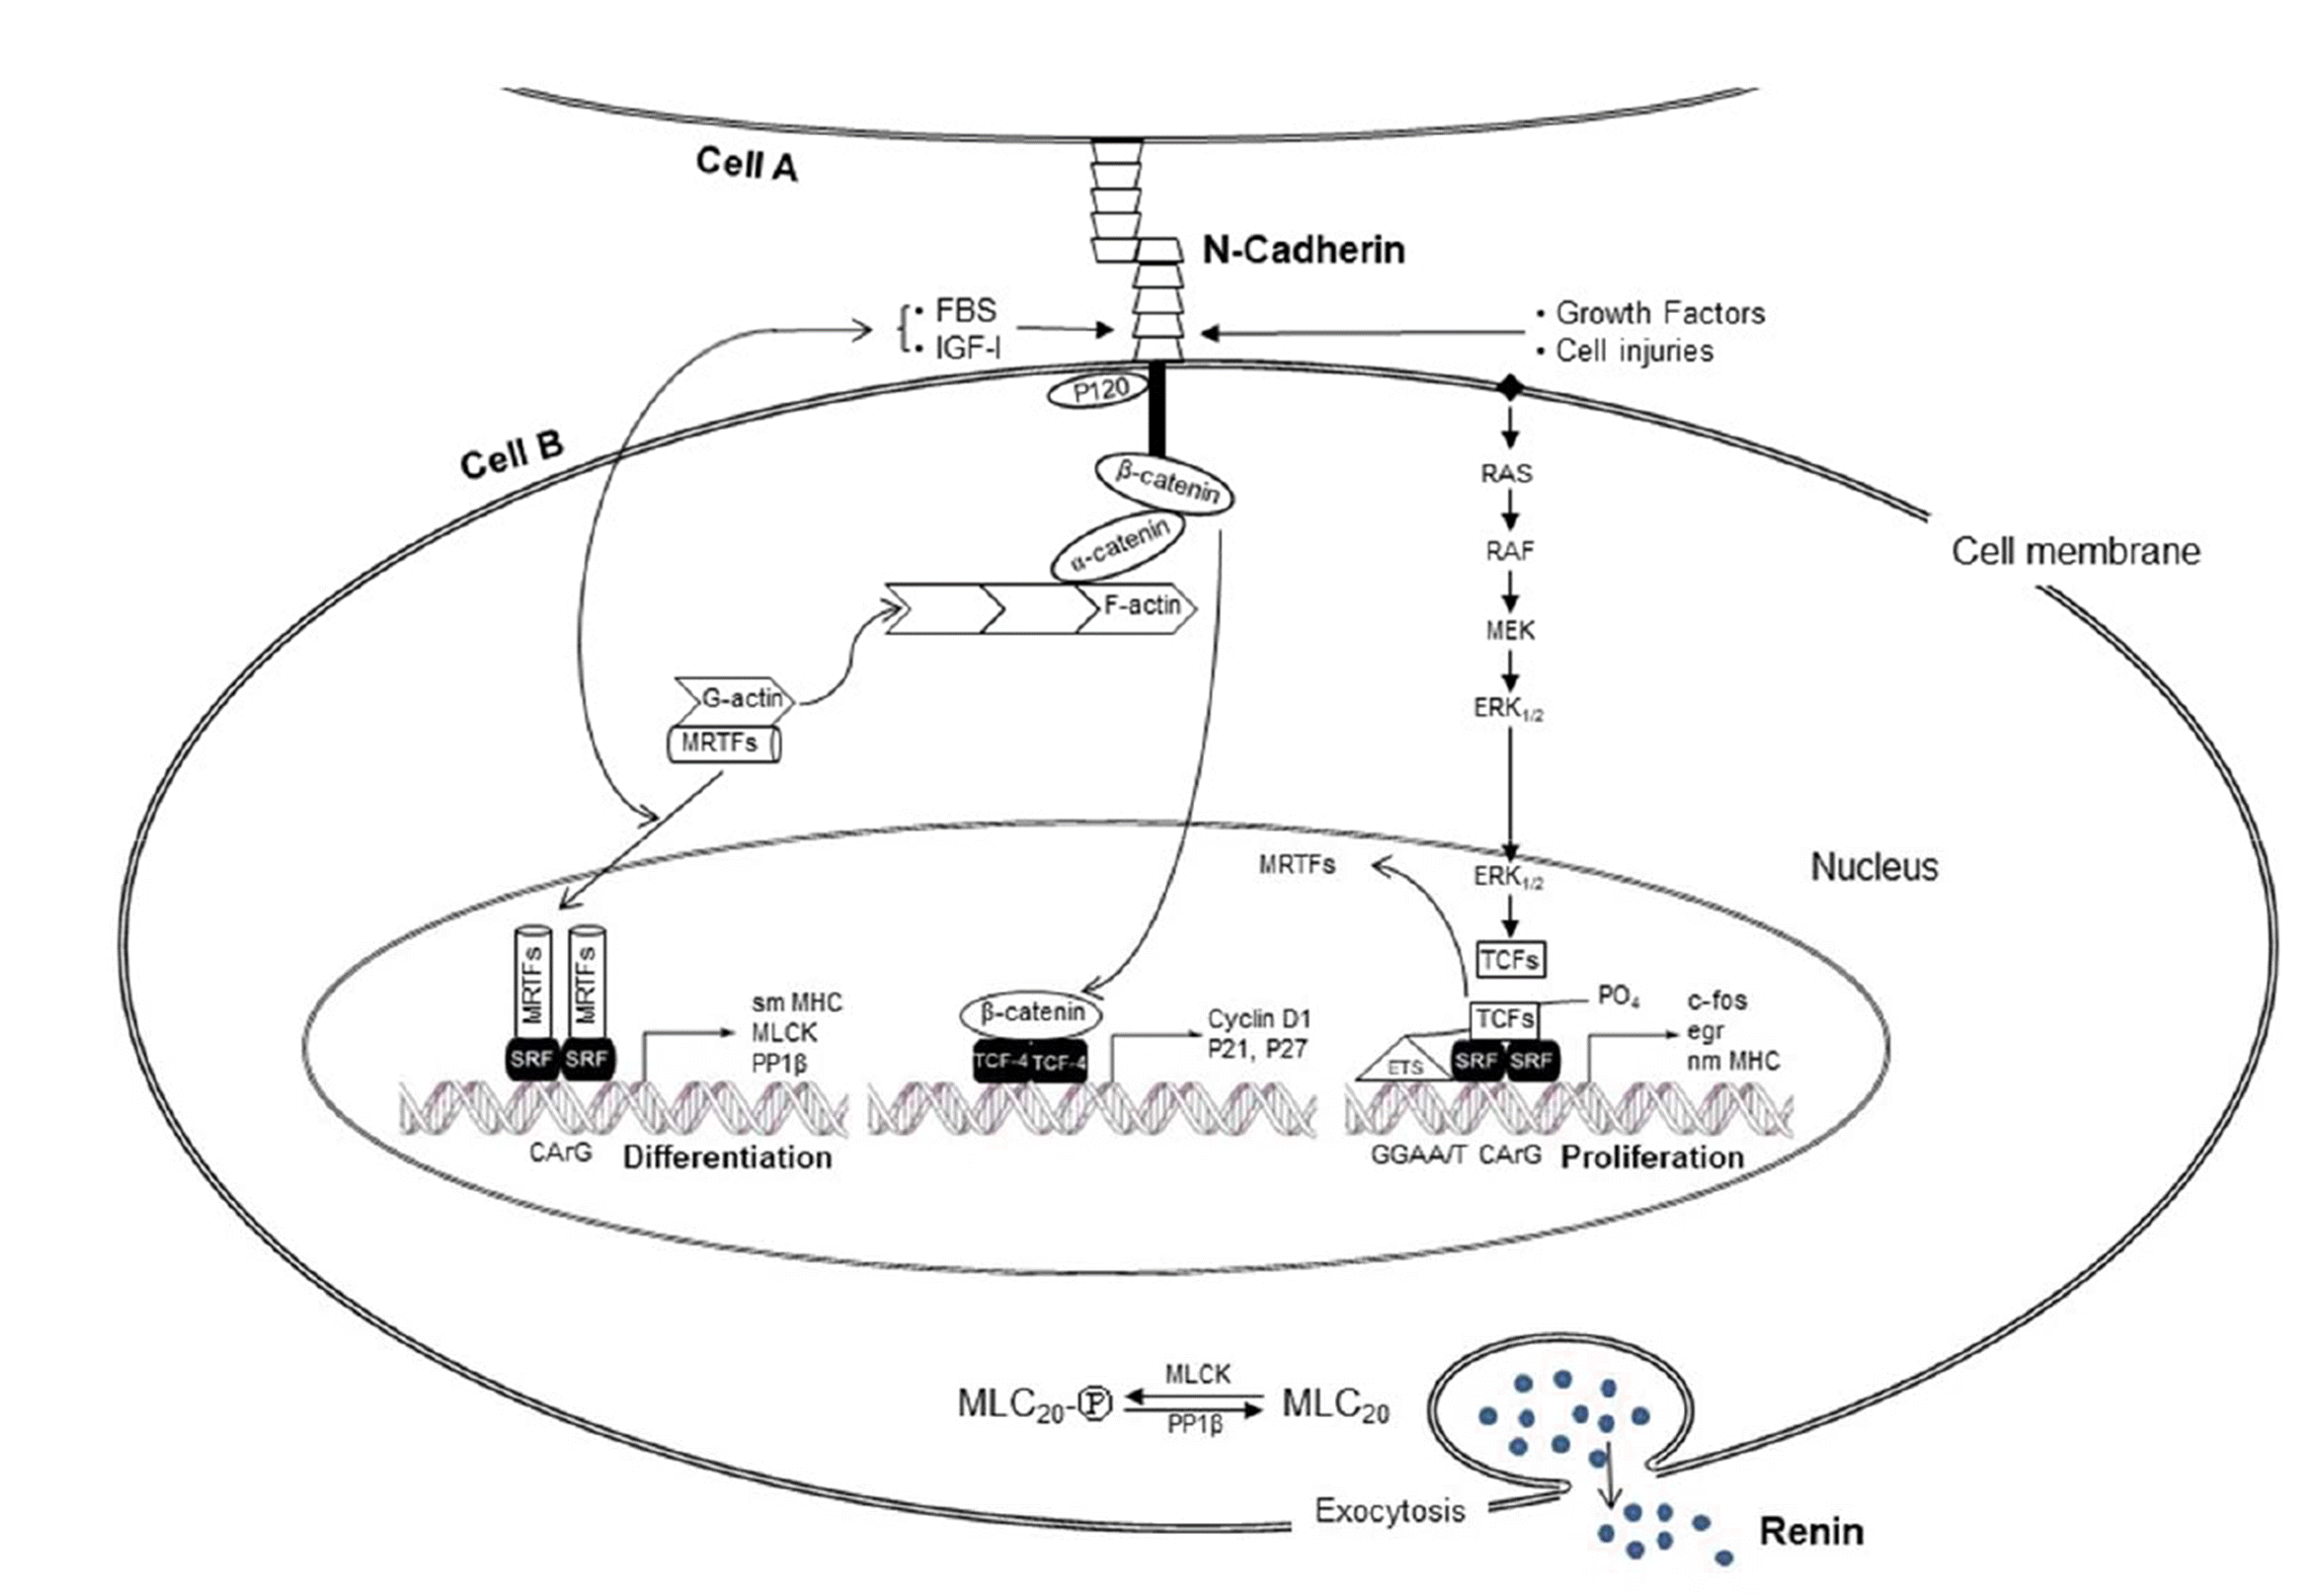
One of the major findings in the present study is that N-cad expression upon cell-cell contact after confluence in the presence of 10% FBS (Fig. 4A, lane 2 and 3 vs. 1) or IGF-1 (Fig. 7, first panel, lane 2 vs. 1) triggers signaling cascades of gene activation and the expression of target proteins such as sm MHC (Fig. 4A, third panel) and PP1β (Fig. 4A, fifth panel and Fig. 7, third panel). These results strongly support the possibility that N-cad expression at the plasma membrane triggers transcriptional activities responsible for inducing phenotype changes. To explain our results before and after expression of N-cad at the plasma membrane, we expect that three signaling cascades, including a G-actin-MRTF-A dependent signaling cascade (Fig. 12, left signaling cascade), a β-catenin-dependent signaling cascade (Fig. 12, middle signaling cascade) and a growth factor/ternary complex-dependent signaling cascade (Fig. 12, right side signaling cascade), are likely to be involved.
Upon N-cad expression at the plasma membrane upon cell-cell contact in As4.1 cells or density-dependent inhibition of cell growth and proliferation of other cell lines [56], signaling for phenotypic switching is likely to be triggered. In this connection, notably, an overexpression of N-cad blocked the mitogenic effects of FBS by inhibiting cyclin D1 expression as well as by increasing the expression of cyclin-dependent kinase inhibitors p21 and p27, resulting in cell cycle arrest [23,24]. Martin and colleagues [21,34] also reported that rapamycin, a potent immunosuppressant, specifically arrests the cell cycle at the G1 phase via activation of p27 [57] and induces expression of smooth muscle-specific genes, such as sm MHC, leading to cell cycle arrest. Notably, SV40-T antigen-transformed SVT2 cells at high density were also found to be arrested at G1 phase [25]. Thus, it might be a universal mechanism that N-cad expression in both normal and SV40-T antigen-transformed cells, including As4.1 cells, could arrest the cell cycle via expression of specific proteins involving cell cycle transition.
N-cad (Fig. 4), MRTF-A (Fig. 5) and SRF (Fig. 6) showed common shared effects on the expression of sm MHC, PPβ1, and nm MHC as well as on active renin secretion. These results are consistent with the possibility that they are signaling molecules sequentially involved in phenotypic switching to differentiated sm MHC along with active renin secretion. MRTF-A is a transcriptional coactivator of SRF and is predominantly cytoplasmic in a G-actin-bound state under resting conditions [48,58]. Upon stimulation with FBS, it is known to activate the RhoA kinase ROCK, which in turn polymerizes G-actin to F-actin [48,58]. Consequently, MRTF-A is freed from its G-actin-bound form in the cytoplasm, thereby allowing free MRTF-A to translocate to the nucleus (Fig. 4B, lane 2 vs. 1). Thus, in postconfluent cells, in the presence of 10% FBS compared with in its absence, a greater amount of MRTF-A would be translocated to the nucleus (Fig. 4B, lane 2 vs. 3; Fig. 12, left side signaling cascade). Under cell-cell contact alone in the absence of FBS (Fig. 4B, lane 3), i.e., without ROCK activation, the amount of both G-actin polymerized to F-actin and MRTF-A nuclear translocation should be limited, thereby producing only limited transcriptional activation with expression of proteins such as sm MHC and PPβ1 (Fig. 4A, third and fifth panel, lane 3 vs. 2). However, notably, the level of MRTF-A in postconfluent cells even in the absence of 10% FBS was significantly greater than that before confluence in the presence of FBS (Fig. 4B, upper panel, lane 3 vs. 1), indicating that N-cad expression alone can promote nuclear translocation of MRTF-A.
In the nucleus, MRTF-A binds SRF [48,58], and this complex in turn binds to two or more CC(AT)6GG DNA sequences, termed CArG boxes, activating smooth muscle-specific genes [19,59]. Consistent with the information in the literature, inhibited expression of MRTF-A (Fig. 5A, first panel) and SRF (Fig. 6A, first panel) abolished the increased expression of sm MHC (Fig. 5A, third panel) and PPβ1 (Fig. 6A, third panel) in postconfluent cells in the presence of 10% FBS. Inhibition of MRTF-A expression resulted in inhibition of active renin secretion (Fig. 5B), similar to its inhibition by CCG-1423 (Fig. 4C), an inhibitor of MRTF-A nuclear translocation [50]. These results support that MRTF-A and SRF are involved in the signaling cascade of active renin secretion through the signaling cascade of N-cad-MRTF-A-SRF in association with increased expression of sm MHC and other smooth muscle-specific genes (Fig. 12, left signaling cascade). Myocardin is a representative transcriptional cofactor that controls the differentiation of smooth muscle lineage and has been reported to play a determining role in smooth muscle differentiation; this protein is also constitutively localized in the nucleus [59]. Our finding that expression of sm MHC is mediated by transcriptional coactivator MRTF-A, rather than myocardin, is a novel finding. The expression of PP1β was in parallel with sm MHC expression (Figs. 46, panel third vs. fifth) and suggests that PP1β expression is likely regulated via a similar or identical transcriptional pathway, another novel finding of present study. Interestingly, the expression of N-cad was SRF-dependent (Fig. 6A, second panel), suggesting positive feedback between the two genes (Fig. 12, left side signaling cascade). In summary, N-cad expression itself at the plasma membrane at cell-cell contacts induces cell cycle arrest, promoting cellular differentiation. In addition, N-cad triggers downstream signaling cascades involving the MRTF-A-SRF-CArG box, leading to the activation of genes including sm MHC and PP1β (Fig. 12, left signaling cascade) and to switching from the secretory phenotype to a regulated active renin secretion (Figs. 4C, 5B, and 6B).
At this juncture, it seems worth noting that FBS is a well-known growth factor [23,56,58]; however, paradoxically, it promoted expression of one of the differentiation marker protein, sm MHC [19-21] (Fig. 4A, third panel, lane 2 vs. 3), whereas it inhibited expression of the dedifferentiated marker protein nm MHC (Fig. 4A, fourth panel, lane 2 vs. 3). Since antibodies against IGF-1 blocked the differential effects of 10% FBS on N-cad, PP1β and pMLC20 (Fig. 7), and active and inactive renin secretion (Table 4), IGF-1 could be a principal factor of the above mentioned FBS-induced transcriptional modulation. Furthermore, IGF-1 induced expression of N-cad triggered a signal at the plasma membrane (Fig. 7, upper panel) that was transduced to the expression of a final target molecule PP1β (Fig. 7, third panel) with increased dephosphorylation of pMLC20 (Fig. 7, second panel), ultimately resulting in increased regulated active renin secretion (Table 3). These results elucidate for the first time the signaling proteins involved in signal initiation and the final target proteins along with the intervening steps (Fig. 12, left signal cascade). Further work is necessary to confirm whether IGF-1 has universal molecular effects on cellular differentiation with associated gene transcription in other cells.
Although it is beyond the aims of this study, it is worth briefly mentioning preconfluent cells. When N-cad is not expressed at the plasma membrane, such as in preconfluent As4.1 cells (Fig. 1B–D), the linkage between N-cad and F-actin via β-catenin and α-catenin cannot be formed ([22-24]; Fig. 12, middle signaling cascade). Consequently, β-catenin released from N-cad at the membrane is translocated to the nucleus and binds T-cell factor-4 (Tcf-4), promoting expression of cyclin D1 and activation of cyclin-dependent kinase, facilitating progression from the G1 to S phase, and resulting in cell growth and proliferation [22-24]. Second, growth factors such as FBS and platelet-derived growth factor in culture media activate the Ras-Raf-mitogen-activated protein kinase MEK-extracellular signal-regulated kinase (ERK), which then phosphorylates transcription cofactors of the ternary complex factor (TCF) with Ets domains (Elk-1, Sap-1, and Net; Fig. 12, right side of signaling cascade). This signaling cascade has been reported to displace myocardin from the CArG box and to inhibit transcription of smooth muscle-specific genes such as sm MHC [58,60]. In our study, it is likely that MRTF-A rather than myocardin was displaced by TCF (Figs. 4A, 5A). In addition, phosphorylated TCF binds to the promotor of the immediate early gene c-fos [60]. Thus, growth factors could promote cell cycle progression with subsequent cell growth and proliferation. Activation of these signaling cascades is likely to increase expression of nm MHC (Figs. 46). Consistent with this possibility is that inhibition of nm MHC expression by its antisense nucleotide or proto-oncogene c-myb phosphorothiolate oligonucleotides suppressed smooth muscle cell proliferation [61]. We defined the molecular mechanisms underlying increased expression of nm MHC in preconfluent As4.1 cells and confirmed that nm MHC expression is a specific molecular marker of cell proliferation. Taken together, the cadherin/MRTF-A/SRF/CArG box signaling cascade, β-catenin/TCF-4 signaling cascade, and Ras/ERK/TCF/SRF/c-fos signaling cascade seem to reciprocally interact, and the net balance between proliferative and differentiation signals lead to expression of proteins specific for differentiation (e.g., sm MHC) or proliferation (e.g., nm MHC), thereby determining the constitutive vs. regulated phenotype of renin secretion in As4.1 cells.

Correlation of expression of specific proteins and induction of regulated renin secretory phenotypes

Our results (Table 1) that preconfluent As4.1 cells secreted a profuse amount of inactive renin secretion without responding to strong stimuli of active renin such as ML-7 [35,38], confirming the findings of a previous report [10]. On the other hand, postconfluent As4.1 cells secreted active renin secretion through regulated pathways. As mentioned above, active renin secretion from postconfluent cells is most likely mediated via an N-cad-MRTF-A-SRF/sm MHC/PP1β signaling pathway (Fig. 12, left signaling cascade). In this connection, notably, JG cells in vivo have been reported to express myocardin-SRF-sm MHC [6]. Unlike preconfluent As4.1 cells with constitutive inactive renin secretion (Table 1), inactive renin secretion from postconfluent cells was inhibited by stimulators of active renin secretion such as 10% FBS (Table 4), ML-7 and forskolin (Table 5). On the other hand, calyculin A inhibited active renin secretion (Table 6) but stimulated inactive renin secretion (Table 5). These results suggest an inverse relationship between active and inactive renin secretion, a noble finding of this study. ML-7, an inhibitor of myosin light chain kinase [32], decreased pMLC20 but calyculin A, an inhibitor of myosin light-chain phosphatase [37] increased pMLC20 (Fig. 10). Accordingly, these results suggests that unphosphorylated MLC20 promotes active renin secretion and pMLC20 promotes inactive renin secretion in an antagonistic and competitive manner. This is a notable finding of this study.
Finally, the ultimate aim of the present study with the use of As4.1 cells with a regulated active renin secretory phenotype was to validate whether renin secretion is a result of two consecutive steps of phosphorylation of MLC20 by MLCK and then dephosphorylation of pMLC20 by PP1β [33,35,38]. MLCK knockdown (Fig. 8, third panel) and the MLCK inhibitor ML-7 stimulated active renin secretion (Fig. 3C) with a decreased pMLC20 (Fig. 8, second panel), whereas PP1β knockdown (Fig. 9, first panel) increased pMLC20 (Fig. 9, second panel) with a decreased renin secretory response to ML-7 (Fig. 9, third panel). These results were independently confirmed by the findings that ML-7 decreased pMLC20, whereas calyculin A increased it (Fig. 10). According to these results, the reduced stimulatory effect of ML-7 on active renin secretion in cells treated with calyculin A [33] is likely attributable to its inability to reduce pMLC20 in the presence of calyculin A. Overall, these results support our proposal that active renin secretion is a two-step process: phosphorylation of MLC20 by MLCK (primed step) and then dephosphorylation of pMLC20 by PP1β (exocytotic step). In this regard, the results of the stimulatory effects of MLCK knockdown (Fig. 8B) and that of ML-7 (Fig. 3C) on active renin secretion seem paradoxical. However, considering the fact that MLC20 exists in an equilibrium between its phosphorylated state of pMLC20 (primed state) and its dephosphorylated state of MLC20 (exocytotic state), MLCK knockdown and treatment of cells with ML-7 would shift this equilibrium to unphosphorylated MLC20 in favor of the exocytotic step. Immunostaining with the renin antibody showed many cytosolic granules (Fig. 11A, left panel), confirming the presence of renin secretory granules in As4.1 cells, as reported previously [10,13,15]. ML-7 treatment discharged intracellular renin-stained granules (Fig. 11A, right panel). In addition, many neutral red-preloaded pink granules were visualized by light microscopy (Fig. 11B), and black granules were observed at absorbance light (Fig. 11C). These granules were also discharged by ML-7 (Fig. 11C, D of Supplementary Video). Although we did not directly colocalize renin secretory granules and neutral loaded granules, it is unlikely that As4.1 cells have many granules other than renin secretory granules. Since the large molecule renin (34,000 Dalton; [13]) and the small molecule neutral red (252 Dalton; [30]) were both discharged at a similar time course of 200 msec at a single secretory granular level and approximately 1–2 min on a single cellular level (Fig. 11C and Supplementary Video), we concluded that active renin is secreted via an exocytotic pathway. On a more detailed view, neutral red was discharged as if the granules had popped or broke open, one after another, without any granule movement. Such a mode of discharge of neutral red likely reflects an osmotic swelling of renin secretory granules by dephosphorylation of pMLC20 by ML-7 (Fig. 10, middle lane), which is most likely located on renin secretory granules, as we previously speculated [35,45]. Taken together, these results demonstrate that ML-7 dephosphorylates MLC20 on the active renin secretory granule membrane and allows osmotic swelling, leading to fusion of the granule membrane with the plasma membrane and discharging of stored renin via exocytosis.
In summary, we successfully induced an active renin secretory phenotype in renin-expressing As4.1 cells from a state of constitutive unregulated inactive renin secretion to a state of regulated active renin secretion as well as inactive renin secretion by culturing cells to confluence for at least two days in the presence of FBS or IGF-1. N-cad expression at cell-cell contacts plays a key role in activating MRTF-A/serum response factor-mediated transcriptional signaling cascades and elicited transcription of genes encoding smooth muscle-specific proteins. The phenotype-switched As4.1 cells secreted active renin upon dephosphorylation of smooth muscle myosin light chain, allowing osmotic swelling of renin secretory granules and discharging of active renin via exocytosis. Conversely, inactive renin secretion is likely mediated by phosphorylation of smooth muscle myosin light chain.

SUPPLEMENTARY MATERIALS

Supplementary data including video can be found with this article online at https://doi.org/10.4196/kjpp.2022.26.6.479.

ACKNOWLEDGEMENTS

This article is dedicated to my mentor, distinguished professor Suk Ki Hong (October 16, 1928–October 4, 1999) at the University at Buffalo. His unrelenting enthusiasm, optimism, and encouragement have been instrumental in shaping the course my scientific career as a physiologist (CS Park) and many other young scientists at Yonsei University, Seoul Korea and the State University of New York at Buffalo, USA. We would like to thank to Dr. Astrid C. Hauge-Evans at the University of Roehampton, UK, for information regarding differences in insulin secretion between MIN6 monolayers and pseudoislets and Dr. Kathleen A. Martin at Yale University, USA, for her very insightful discussion. We are also indebted to Mrs. Julie Edwards at Boehringer Ingelheim for providing the compound BILA 2157 BS.

Notes

FUNDING

This study was supported by grants from the Korea Research Foundation (No. 1997-001-F00035), the Korea Science and Engineering Foundation (No. 98-0403-09-01-5), and the Asan Institute for Life Sciences, Seoul, Republic of Korea, awarded to CS Park (No. 2001-035).

CONFLICTS OF INTEREST

The authors declare no conflicts of interest.

REFERENCES

1. Halban PA, Wollheim CB, Blondel B, Meda P, Niesor EN, Mintz DH. 1982; The possible importance of contact between pancreatic islet cells for the control of insulin release. Endocrinology. 111:86–94. DOI: 10.1210/endo-111-1-86. PMID: 6123433. PMID: https://www.scopus.com/inward/record.uri?partnerID=HzOxMe3b&scp=0020164058&origin=inward.
crossref
2. Hauge-Evans AC, Squires PE, Persaud SJ, Jones PM. 1999; Pancreatic beta-cell-to-beta-cell interactions are required for integrated responses to nutrient stimuli: enhanced Ca2+ and insulin secretory responses of MIN6 pseudoislets. Diabetes. 48:1402–1408. DOI: 10.2337/diabetes.48.7.1402. PMID: 10389845. PMID: https://www.scopus.com/inward/record.uri?partnerID=HzOxMe3b&scp=0032992378&origin=inward.
crossref
3. Lilla V, Webb G, Rickenbach K, Maturana A, Steiner DF, Halban PA, Irminger JC. 2003; Differential gene expression in well-regulated and dysregulated pancreatic beta-cell (MIN6) sublines. Endocrinology. 144:1368–1379. DOI: 10.1210/en.2002-220916. PMID: 12639920. PMID: https://www.scopus.com/inward/record.uri?partnerID=HzOxMe3b&scp=0037390423&origin=inward.
crossref
4. Hackenthal E, Paul M, Ganten D, Taugner R. 1990; Morphology, physiology, and molecular biology of renin secretion. Physiol Rev. 70:1067–1116. DOI: 10.1152/physrev.1990.70.4.1067. PMID: 2217555. PMID: https://www.scopus.com/inward/record.uri?partnerID=HzOxMe3b&scp=0025005906&origin=inward.
crossref
5. Cabandugama PK, Gardner MJ, Sowers JR. 2017; The renin angiotensin aldosterone system in obesity and hypertension: roles in the cardiorenal metabolic syndrome. Med Clin North Am. 101:129–137. DOI: 10.1016/j.mcna.2016.08.009. PMID: 27884224. PMCID: PMC5125542. PMID: https://www.scopus.com/inward/record.uri?partnerID=HzOxMe3b&scp=84996743333&origin=inward.
6. Brunskill EW, Sequeira-Lopez ML, Pentz ES, Lin E, Yu J, Aronow BJ, Potter SS, Gomez RA. 2011; Genes that confer the identity of the renin cell. J Am Soc Nephrol. 22:2213–2225. DOI: 10.1681/ASN.2011040401. PMID: 22034642. PMCID: PMC3279933. PMID: https://www.scopus.com/inward/record.uri?partnerID=HzOxMe3b&scp=82655173696&origin=inward.
crossref
7. Della Bruna R, Kurtz A. 1995; Juxtaglomerular cells in culture. Exp Nephrol. 3:219–222. PMID: 8590034. PMID: https://www.scopus.com/inward/record.uri?partnerID=HzOxMe3b&scp=0029101966&origin=inward.
8. Galen FX, Devaux C, Houot AM, Menard J, Corvol P, Corvol MT, Gubler MC, Mounier F, Camilleri JP. 1984; Renin biosynthesis by human tumoral juxtaglomerular cells. Evidences for a renin precursor. J Clin Invest. 73:1144–1155. DOI: 10.1172/JCI111300. PMID: 6323535. PMCID: PMC425128. PMID: https://www.scopus.com/inward/record.uri?partnerID=HzOxMe3b&scp=0021270652&origin=inward.
crossref
9. Pinet F, Corvol MT, Dench F, Bourguignon J, Feunteun J, Menard J, Corvol P. 1985; Isolation of renin-producing human cells by transfection with three simian virus 40 mutants. Proc Natl Acad Sci U S A. 82:8503–8507. DOI: 10.1073/pnas.82.24.8503. PMID: 3001706. PMCID: PMC390944. PMID: https://www.scopus.com/inward/record.uri?partnerID=HzOxMe3b&scp=0022371679&origin=inward.
crossref
10. Sigmund CD, Okuyama K, Ingelfinger J, Jones CA, Mullins JJ, Kane C, Kim U, Wu CZ, Kenny L, Rustum Y, Dzau VJ, Gross KW. 1990; Isolation and characterization of renin-expressing cell lines from transgenic mice containing a renin-promoter viral oncogene fusion construct. J Biol Chem. 265:19916–19922. DOI: 10.1016/S0021-9258(17)45460-3. PMID: 2174057.
crossref
11. Grünberger C, Obermayer B, Klar J, Kurtz A, Schweda F. 2006; The calcium paradoxon of renin release: calcium suppresses renin exocytosis by inhibition of calcium-dependent adenylate cyclases AC5 and AC6. Circ Res. 99:1197–1206. DOI: 10.1161/01.RES.0000251057.35537.d3. PMID: 17068292. PMID: https://www.scopus.com/inward/record.uri?partnerID=HzOxMe3b&scp=33751335626&origin=inward.
12. Jensen BL, Lehle U, Müller M, Wagner C, Kurtz A. 1998; Interleukin-1 inhibits renin gene expression in As4.1 cells but not in native juxtaglomerular cells. Pflugers Arch. 436:673–678. DOI: 10.1007/s004240050688. PMID: 9716699. PMID: https://www.scopus.com/inward/record.uri?partnerID=HzOxMe3b&scp=0031693541&origin=inward.
crossref
13. Jones CA, Petrovic N, Novak EK, Swank RT, Sigmund CD, Gross KW. 1997; Biosynthesis of renin in mouse kidney tumor As4.1 cells. Eur J Biochem. 243:181–190. DOI: 10.1111/j.1432-1033.1997.0181a.x. PMID: 9030738. PMID: https://www.scopus.com/inward/record.uri?partnerID=HzOxMe3b&scp=0031019662&origin=inward.
crossref
14. Klar J, Sandner P, Müller MW, Kurtz A. 2002; Cyclic AMP stimulates renin gene transcription in juxtaglomerular cells. Pflugers Arch. 444:335–344. DOI: 10.1007/s00424-002-0818-9. PMID: 12111241. PMID: https://www.scopus.com/inward/record.uri?partnerID=HzOxMe3b&scp=0036448341&origin=inward.
crossref
15. Laframboise M, Reudelhuber TL, Jutras I, Brechler V, Seidah NG, Day R, Gross KW, Deschepper CF. 1997; Prorenin activation and prohormone convertases in the mouse As4.1 cell line. Kidney Int. 51:104–109. DOI: 10.1038/ki.1997.13. PMID: 8995723. PMID: https://www.scopus.com/inward/record.uri?partnerID=HzOxMe3b&scp=0031042265&origin=inward.
crossref
16. Peti-Peterdi J, Fintha A, Fuson AL, Tousson A, Chow RH. 2004; Real-time imaging of renin release in vitro. Am J Physiol Renal Physiol. 287:F329–F335. DOI: 10.1152/ajprenal.00420.2003. PMID: 15082450. PMID: https://www.scopus.com/inward/record.uri?partnerID=HzOxMe3b&scp=3242716881&origin=inward.
crossref
17. Beierwaltes WH. 2012; Hydrogen sulfide, renin, and regulating the second messenger cAMP. Focus on "Hydrogen sulfide regulates cAMP homeostasis and renin degranulation in As4.1 and rat renin-rich kidney cell.". Am J Physiol Cell Physiol. 302:C21–C23. DOI: 10.1152/ajpcell.00375.2011. PMID: 21998138. PMCID: PMC3328909. PMID: https://www.scopus.com/inward/record.uri?partnerID=HzOxMe3b&scp=83455223699&origin=inward.
18. Chamley-Campbell JH, Campbell GR. 1981; What controls smooth muscle phenotype? Atherosclerosis. 40:347–357. https://doi.org/10.1016/0021-9150(81)90145-3. DOI: 10.1016/0021-9150(81)90145-3. PMID: https://www.scopus.com/inward/record.uri?partnerID=HzOxMe3b&scp=0019458817&origin=inward.
crossref
19. Owens GK, Kumar MS, Wamhoff BR. 2004; Molecular regulation of vascular smooth muscle cell differentiation in development and disease. Physiol Rev. 84:767–801. DOI: 10.1152/physrev.00041.2003. PMID: 15269336. PMID: https://www.scopus.com/inward/record.uri?partnerID=HzOxMe3b&scp=3042588831&origin=inward.
crossref
20. Kawamoto S, Adelstein RS. 1987; Characterization of myosin heavy chains in cultured aorta smooth muscle cells. A comparative study. J Biol Chem. 262:7282–7288. DOI: 10.1016/S0021-9258(18)48234-8. PMID: 2438275.
crossref
21. Martin KA, Rzucidlo EM, Merenick BL, Fingar DC, Brown DJ, Wagner RJ, Powell RJ. 2004; The mTOR/p70 S6K1 pathway regulates vascular smooth muscle cell differentiation. Am J Physiol Cell Physiol. 286:C507–C517. DOI: 10.1152/ajpcell.00201.2003. PMID: 14592809. PMID: https://www.scopus.com/inward/record.uri?partnerID=HzOxMe3b&scp=1442325390&origin=inward.
crossref
22. George SJ, Beeching CA. 2006; Cadherin:catenin complex: a novel regulator of vascular smooth muscle cell behaviour. Atherosclerosis. 188:1–11. DOI: 10.1016/j.atherosclerosis.2005.12.017. PMID: 16438974. PMID: https://www.scopus.com/inward/record.uri?partnerID=HzOxMe3b&scp=33746478732&origin=inward.
crossref
23. Quasnichka H, Slater SC, Beeching CA, Boehm M, Sala-Newby GB, George SJ. 2006; Regulation of smooth muscle cell proliferation by beta-catenin/T-cell factor signaling involves modulation of cyclin D1 and p21 expression. Circ Res. 99:1329–1337. DOI: 10.1161/01.RES.0000253533.65446.33. PMID: 17122440. PMID: https://www.scopus.com/inward/record.uri?partnerID=HzOxMe3b&scp=33845620229&origin=inward.
crossref
24. Uglow EB, Slater S, Sala-Newby GB, Aguilera-Garcia CM, Angelini GD, Newby AC, George SJ. 2003; Dismantling of cadherin-mediated cell-cell contacts modulates smooth muscle cell proliferation. Circ Res. 92:1314–1321. DOI: 10.1161/01.RES.0000079027.44309.53. PMID: 12775583. PMID: https://www.scopus.com/inward/record.uri?partnerID=HzOxMe3b&scp=0038801626&origin=inward.
crossref
25. Gurney EG, Gurney T Jr. 1979; Density dependent inhibition of both growth and T-antigen expression in revertants isolated from simian virus 40-transformed mouse SVT2 cells. J Virol. 32:667–671. DOI: 10.1128/jvi.32.2.667-671.1979. PMID: 228083. PMCID: PMC353598. PMID: https://www.scopus.com/inward/record.uri?partnerID=HzOxMe3b&scp=0018538248&origin=inward.
crossref
26. Ganot N, Meker S, Reytman L, Tzubery A, Tshuva EY. 2013; Anticancer metal complexes: synthesis and cytotoxicity evaluation by the MTT assay. J Vis Exp. (81):e50767. DOI: 10.3791/50767. PMID: 24300943. PMCID: PMC3989495. PMID: https://www.scopus.com/inward/record.uri?partnerID=HzOxMe3b&scp=84903080854&origin=inward.
crossref
27. Park CS, Lee HS, Chang SH, Honeyman TW, Hong CD. 1996; Inhibitory effect of Ca2+ on renin secretion elicited by chemiosmotic stimuli through actomyosin mediation. Am J Physiol. 271(1 Pt 1):C248–C254. DOI: 10.1152/ajpcell.1996.271.1.C248. PMID: 8760053. PMID: https://www.scopus.com/inward/record.uri?partnerID=HzOxMe3b&scp=0030192099&origin=inward.
28. Ludowyke RI, Peleg I, Beaven MA, Adelstein RS. 1989; Antigen-induced secretion of histamine and the phosphorylation of myosin by protein kinase C in rat basophilic leukemia cells. J Biol Chem. 264:12492–12501. DOI: 10.1016/S0021-9258(18)63885-2. PMID: 2473073.
crossref
29. Bradford MM. 1976; A rapid and sensitive method for the quantitation of microgram quantities of protein utilizing the principle of protein-dye binding. Anal Biochem. 72:248–254. DOI: 10.1016/0003-2697(76)90527-3. PMID: 942051. PMID: https://www.scopus.com/inward/record.uri?partnerID=HzOxMe3b&scp=0017184389&origin=inward.
crossref
30. Harada K. 1954; Histochemical studies of the juxta glomerular apparatus. Rev Belg Pathol Med Exp. 23:311–320. PMID: 14372543. PMID: https://www.scopus.com/inward/record.uri?partnerID=HzOxMe3b&scp=77049215216&origin=inward.
31. Knudsen KA, Frankowski C, Johnson KR, Wheelock MJ. 1998; A role for cadherins in cellular signaling and differentiation. J Cell Biochem. 72(S30-S31):168–176. DOI: 10.1002/(SICI)1097-4644(1998)72:30/31+<168::AID-JCB21>3.0.CO;2-V. PMID: 29345834.
crossref
32. Saitoh M, Ishikawa T, Matsushima S, Naka M, Hidaka H. 1987; Selective inhibition of catalytic activity of smooth muscle myosin light chain kinase. J Biol Chem. 262:7796–7801. DOI: 10.1016/S0021-9258(18)47638-7. PMID: 3108259.
crossref
33. Park CS, Kim MH, Leem CH, Jang YJ, Kim HW, Kim HS, et al. 1998; Inhibitory effect of calyculin A, a Ser/Thr protein phosphatase type I inhibitor, on renin secretion. Am J Physiol. 275:F664–F670. DOI: 10.1152/ajprenal.1998.275.5.F664. PMID: 9815125. PMID: https://www.scopus.com/inward/record.uri?partnerID=HzOxMe3b&scp=17344364413&origin=inward.
crossref
34. Martin KA, Merenick BL, Ding M, Fetalvero KM, Rzucidlo EM, Kozul CD, Brown DJ, Chiu HY, Shyu M, Drapeau BL, Wagner RJ, Powell RJ. 2007; Rapamycin promotes vascular smooth muscle cell differentiation through insulin receptor substrate-1/phosphatidylinositol 3-kinase/Akt2 feedback signaling. J Biol Chem. 282:36112–36120. DOI: 10.1074/jbc.M703914200. PMID: 17908691. PMID: https://www.scopus.com/inward/record.uri?partnerID=HzOxMe3b&scp=37249046846&origin=inward.
crossref
35. Park CS, Chang SH, Lee HS, Kim SH, Chang JW, Hong CD. 1996; Inhibition of renin secretion by Ca2+ through activation of myosin light chain kinase. Am J Physiol. 271(1 Pt 1):C242–C247. DOI: 10.1152/ajpcell.1996.271.1.C242. PMID: 8760052. PMID: https://www.scopus.com/inward/record.uri?partnerID=HzOxMe3b&scp=0043062950&origin=inward.
36. Park CS, Sigmon DH, Han DS, Honeyman TW, Fray JC. 1986; Control of renin secretion by Ca2+ and cyclic AMP through two parallel mechanisms. Am J Physiol. 251(3 Pt 2):R531–R536. DOI: 10.1152/ajpregu.1986.251.3.R531. PMID: 3019164. PMID: https://www.scopus.com/inward/record.uri?partnerID=HzOxMe3b&scp=0023019413&origin=inward.
37. Ishihara H, Martin BL, Brautigan DL, Karaki H, Ozaki H, Kato Y, Fusetani N, Watabe S, Hashimoto K, Uemura D, Hartshorne DJ. 1989; Calyculin A and okadaic acid: inhibitors of protein phosphatase activity. Biochem Biophys Res Commun. 159:871–877. DOI: 10.1016/0006-291X(89)92189-X. PMID: 2539153. PMID: https://www.scopus.com/inward/record.uri?partnerID=HzOxMe3b&scp=0024517280&origin=inward.
crossref
38. Kim MH, Kim SH, Kim HS, Chang JW, Hong YS, Kim HW, Park CS. 1998; Regulation of renin secretion through reversible phosphorylation of myosin by myosin light chain kinase and protein phosphatase type 1. J Pharmacol Exp Ther. 285:968–974. PMID: 9618396. PMID: https://www.scopus.com/inward/record.uri?partnerID=HzOxMe3b&scp=7144261705&origin=inward.
39. Haber E, Koerner T, Page LB, Kliman B, Purnode A. 1969; Application of a radioimmunoassay for angiotensin I to the physiologic measurements of plasma renin activity in normal human subjects. J Clin Endocrinol Metab. 29:1349–1355. DOI: 10.1210/jcem-29-10-1349. PMID: 4311082. PMID: https://www.scopus.com/inward/record.uri?partnerID=HzOxMe3b&scp=0014584257&origin=inward.
crossref
40. Taugner R, Whalley A, Angermüller S, Bührle CP, Hackenthal E. 1985; Are the renin-containing granules of juxtaglomerular epithelioid cells modified lysosomes? Cell Tissue Res. 239:575–587. DOI: 10.1007/BF00219236. PMID: 3886148. PMID: https://www.scopus.com/inward/record.uri?partnerID=HzOxMe3b&scp=0021999739&origin=inward.
crossref
41. Faust PL, Kornfeld S, Chirgwin JM. 1985; Cloning and sequence analysis of cDNA for human cathepsin D. Proc Natl Acad Sci U S A. 82:4910–4914. DOI: 10.1073/pnas.82.15.4910. PMID: 3927292. PMCID: PMC390467. PMID: https://www.scopus.com/inward/record.uri?partnerID=HzOxMe3b&scp=0011288815&origin=inward.
crossref
42. Beaulieu PL, Gillard J, Bailey M, Beaulieu C, Duceppe JS, Lavallée P, Wernic D. 1999; Practical synthesis of BILA 2157 BS, a potent and orally active renin inhibitor: use of an enzyme-catalyzed hydrolysis for the preparation of homochiral succinic acid derivatives. J Org Chem. 64:6622–6634. DOI: 10.1021/jo990321x. PMID: 11674665. PMID: https://www.scopus.com/inward/record.uri?partnerID=HzOxMe3b&scp=0032885570&origin=inward.
crossref
43. Park CS, Honeyman TW, Chung ES, Lee JS, Sigmon DH, Fray JC. 1986; Involvement of calmodulin in mediating inhibitory action of intracellular Ca2+ on renin secretion. Am J Physiol. 251(6 Pt 2):F1055–F1062. DOI: 10.1152/ajprenal.1986.251.6.F1055. PMID: 3538904. PMID: https://www.scopus.com/inward/record.uri?partnerID=HzOxMe3b&scp=0023007879&origin=inward.
44. Park CS, Malvin RL. 1978; Calcium in the control of renin release. Am J Physiol. 235:F22–F25. DOI: 10.1152/ajprenal.1978.235.1.F22. PMID: 98060. PMID: https://www.scopus.com/inward/record.uri?partnerID=HzOxMe3b&scp=18144444810&origin=inward.
crossref
45. Park CS, Hong CD, Honeyman TW. 1992; Calcium-dependent inhibitory step in control of renin secretion. Am J Physiol. 262(5 Pt 2):F793–F798. DOI: 10.1152/ajprenal.1992.262.5.F793. PMID: 1590424.
crossref
46. Van Belle H. 1981; R 24 571: a potent inhibitor of calmodulin-activated enzymes. Cell Calcium. 2:483–494. https://doi.org/10.1016/0143-4160(81)90007-5. DOI: 10.1016/0143-4160(81)90007-5. PMID: https://www.scopus.com/inward/record.uri?partnerID=HzOxMe3b&scp=0019718498&origin=inward.
crossref
47. Seamon KB, Daly JW. 1981; Forskolin: a unique diterpene activator of cyclic AMP-generating systems. J Cyclic Nucleotide Res. 7:201–224. PMID: 6278005. PMID: https://www.scopus.com/inward/record.uri?partnerID=HzOxMe3b&scp=0019811368&origin=inward.
48. Miralles F, Posern G, Zaromytidou AI, Treisman R. 2003; Actin dynamics control SRF activity by regulation of its coactivator MAL. Cell. 113:329–342. DOI: 10.1016/S0092-8674(03)00278-2. PMID: 12732141. PMID: https://www.scopus.com/inward/record.uri?partnerID=HzOxMe3b&scp=0038737042&origin=inward.
crossref
49. Wang Z, Wang DZ, Pipes GC, Olson EN. 2003; Myocardin is a master regulator of smooth muscle gene expression. Proc Natl Acad Sci U S A. 100:7129–7134. DOI: 10.1073/pnas.1232341100. PMID: 12756293. PMCID: PMC165841. PMID: https://www.scopus.com/inward/record.uri?partnerID=HzOxMe3b&scp=0037795465&origin=inward.
crossref
50. Evelyn CR, Wade SM, Wang Q, Wu M, Iñiguez-Lluhí JA, Merajver SD, Neubig RR. 2007; CCG-1423: a small-molecule inhibitor of RhoA transcriptional signaling. Mol Cancer Ther. 6:2249–2260. DOI: 10.1158/1535-7163.MCT-06-0782. PMID: 17699722. PMID: https://www.scopus.com/inward/record.uri?partnerID=HzOxMe3b&scp=34548066554&origin=inward.
crossref
51. Cong L, Ran FA, Cox D, Lin S, Barretto R, Habib N, Hsu PD, Wu X, Jiang W, Marraffini LA, Zhang F. 2013; Multiplex genome engineering using CRISPR/Cas systems. Science. 339:819–823. DOI: 10.1126/science.1231143. PMID: 23287718. PMCID: PMC3795411. PMID: https://www.scopus.com/inward/record.uri?partnerID=HzOxMe3b&scp=84873729095&origin=inward.
crossref
52. Miano JM, Long X, Fujiwara K. 2007; Serum response factor: master regulator of the actin cytoskeleton and contractile apparatus. Am J Physiol Cell Physiol. 292:C70–C81. DOI: 10.1152/ajpcell.00386.2006. PMID: 16928770. PMID: https://www.scopus.com/inward/record.uri?partnerID=HzOxMe3b&scp=33846301667&origin=inward.
crossref
53. Heemskerk JW, Farndale RW, Sage SO. 1997; Effects of U73122 and U73343 on human platelet calcium signalling and protein tyrosine phosphorylation. Biochim Biophys Acta. 1355:81–88. DOI: 10.1016/S0167-4889(96)00113-9. PMID: 9030204. PMID: https://www.scopus.com/inward/record.uri?partnerID=HzOxMe3b&scp=0031037686&origin=inward.
crossref
54. Aldehni F, Tang T, Madsen K, Plattner M, Schreiber A, Friis UG, Hammond HK, Han PL, Schweda F. 2011; Stimulation of renin secretion by catecholamines is dependent on adenylyl cyclases 5 and 6. Hypertension. 57:460–468. DOI: 10.1161/HYPERTENSIONAHA.110.167130. PMID: 21282557. PMCID: PMC3106204. PMID: https://www.scopus.com/inward/record.uri?partnerID=HzOxMe3b&scp=79953241859&origin=inward.
crossref
55. Luetscher JA, Kraemer FB, Wilson DM, Schwartz HC, Bryer-Ash M. 1985; Increased plasma inactive renin in diabetes mellitus. A marker of microvascular complications. N Engl J Med. 312:1412–1417. DOI: 10.1056/NEJM198505303122202. PMID: 3887168. PMID: https://www.scopus.com/inward/record.uri?partnerID=HzOxMe3b&scp=0021889169&origin=inward.
crossref
56. Todaro GJ, Lazar GK, Green H. 1965; The initiation of cell division in a contact-inhibited mammalian cell line. J Cell Physiol. 66:325–333. DOI: 10.1002/jcp.1030660310. PMID: 5884360. PMID: https://www.scopus.com/inward/record.uri?partnerID=HzOxMe3b&scp=0013831072&origin=inward.
crossref
57. Nourse J, Firpo E, Flanagan WM, Coats S, Polyak K, Lee MH, Massague J, Crabtree GR, Roberts JM. 1994; Interleukin-2-mediated elimination of the p27Kip1 cyclin-dependent kinase inhibitor prevented by rapamycin. Nature. 372:570–573. DOI: 10.1038/372570a0. PMID: 7990932. PMID: https://www.scopus.com/inward/record.uri?partnerID=HzOxMe3b&scp=0028172867&origin=inward.
crossref
58. Posern G, Treisman R. 2006; Actin' together: serum response factor, its cofactors and the link to signal transduction. Trends Cell Biol. 16:588–596. DOI: 10.1016/j.tcb.2006.09.008. PMID: 17035020. PMID: https://www.scopus.com/inward/record.uri?partnerID=HzOxMe3b&scp=33750343214&origin=inward.
crossref
59. Wang D, Chang PS, Wang Z, Sutherland L, Richardson JA, Small E, Krieg PA, Olson EN. 2001; Activation of cardiac gene expression by myocardin, a transcriptional cofactor for serum response factor. Cell. 105:851–862. DOI: 10.1016/S0092-8674(01)00404-4. PMID: 11439182. PMID: https://www.scopus.com/inward/record.uri?partnerID=HzOxMe3b&scp=0035967868&origin=inward.
crossref
60. Wang Z, Wang DZ, Hockemeyer D, McAnally J, Nordheim A, Olson EN. 2004; Myocardin and ternary complex factors compete for SRF to control smooth muscle gene expression. Nature. 428:185–189. DOI: 10.1038/nature02382. PMID: 15014501. PMID: https://www.scopus.com/inward/record.uri?partnerID=HzOxMe3b&scp=1642297200&origin=inward.
crossref
61. Simons M, Rosenberg RD. 1992; Antisense nonmuscle myosin heavy chain and c-myb oligonucleotides suppress smooth muscle cell proliferation in vitro. Circ Res. 70:835–843. DOI: 10.1161/01.RES.70.4.835. PMID: 1551207. PMID: https://www.scopus.com/inward/record.uri?partnerID=HzOxMe3b&scp=0026536410&origin=inward.
crossref

Fig. 1

Growth curve and cadherin expression before (lane 1) and after confluence (lane 2).

(A) Growth curve. Cells were plated (3 × 10³ cells/well) onto 24-well plates (day 0), cultured for 10 days and counted on a hemocytometer every 2–3 days (n = 3). (B) Phase contrast microscopy of ~70% and 100% confluent cells (×200). Scale bar: 60 μm. (C) Expression of cadherins. Protein (40 μg) obtained from cell lysates of cells grown to ~70% confluence (lane 1) or from cells on day 2 postconfluence (lane 2) were resolved by 7% acrylamide SDS-PAGE, followed by Western blotting with antibodies against epithelial cadherin (E-cad), placental cadherin (P-Cad), or neural cadherin (N-Cad). The numbers on the left indicate the molecular masses of standard proteins in kilo Daltons (kDa). The density of the bands was compared by unpaired Student’s tests (n = 3 for each group). β-actin was used as the protein loading control for each gel. NS, no significant difference. (D) N-cad expression at ~70% confluence (upper panel) and 100% confluence (lower panel). Cell nuclei were stained with propidium iodide (DAPI). Scale bar: 10 μm.
kjpp-26-6-479-f1.tif
Fig. 2

BILA 2157 BS inhibits renin activity.

Incubation media from postconfluent cells with a renin activity of 268.3 ± 51 ng ANG I/ml/h (relative value 1.0) was incubated with varying concentrations of BILA 2157 BS for 1 h. Active renin activity was determined by radioimmunoassay for ANG I. Each data point represents the mean ± SD of three samples. ANG I, angiotensin I.
kjpp-26-6-479-f2.tif
Fig. 3

Effects of Ca2+, calmidazolium, ML-7, isoproterenol and forskolin on active renin secretion in postconfluent As4.1 cells.

Cells on day 2 postconfluence were incubated in Ca2+-free DMEM containing 1 mM EGTA (–Ca2+ DMEM) (A, left panel) and then in 2 mM Ca2+-containing DMEM and 10% FBS (+Ca2+ DMEM) successively for 1 h each or in the reverse order (A, right panel, p < 0.001, n = 6). In the next series of experiments, cells were incubated in +Ca2+ DMEM for 1 h (control) and then another 1 h in +Ca2+ DMEM + 10 % FBS containing either calmidazolium (3 × 10⁻⁵ M) (B, n = 6), ML-7 (6 × 10⁻⁵M) (C, n = 6), isoproterenol (10−8–10−5 M) (D, n = 6) or forskolin (3 × 10⁻⁵ M) plus IBMX (10−4 M) (E, n = 6). The rate of active renin secretion was determined by radioimmunoassay for ANG I in (A) and (B) or by ELISA in (C), (D), and (E). ANG I, angiotensin I; DMEM, Dulbecco’s modified eagle medium; FBS, fetal bovine serum. Samples within groups were compared using paired Student’s t-tests and between groups using unpaired Student’s t-tests (A–C, E) or ANOVA (D), *p < 0.001 vs. control, except between samples at the two highest concentrations, which were compared by unpaired Student’s t-tests. p < 0.001.
kjpp-26-6-479-f3.tif
Fig. 4

Expression of N-cadherin, MRTF-A, sm MHC, nm MHC and PP1β changes to As4.1 cells before and after confluence.

Cell lysates from cells grown to 70%–80% confluence in the presence of 10% FBS (A, lane 1), cells at day 2 postconfluence in the continuous presence of 10% FBS (A, lane 2) or in the absence of 10% FBS for two days after achieving 100% confluence (A, lane 3). After the aspiration of the incubation media, cells were lysed and centrifuged. Supernatant protein (60 μg) was resolved by SDS-PAGE on 7% or 15% acrylamide slab gels followed by Western blotting for N-cad, MRTF-A, sm MHC, nm MHC, and PP1β and then analyzed by densitometry. In the case of MRTF-A, a nuclear fraction was prepared, and 100 μg was resolved (B, upper panel). p-values were obtained by ANOVA. To assess nuclear localization of MRTF-A, cells were plated onto coverslips and fixed and permeabilized as described in the Methods section. Cells were then immunostained with primary MRTF-A antibody (1:100) and then with FITC-labelled goat anti-mouse secondary antibody to MRTF-A (1:1,000). Nuclei were stained with propidium iodide (DAPI) (B, lower panel). The density of preconfluent cells was arbitrarily set to 1. Fluorescence was analyzed by an image analyzer. Lane 1, preconfluent cells; lane 2, postconfluent cells in the presence of 10% FBS. p-values were obtained by unpaired Student’s t-tests (n = 4). Scale bar: 10 μM. (C) Postconfluent cells were incubated in DMEM + 10% FBS with or without CCG-1423 (5 × 10⁻⁶ M), an inhibitor of nuclear translocation of MRTF-A, for 1 h and then with ML-7 (6 × 10⁻⁵ M) for another 1 h. Secreted renin was measured by ELISA (C, n = 5). MRTF-A, myocardin related transcription factor-A; sm MHC, smooth muscle myosin heavy chain; nm MHC, nonmuscle myosin heavy chain; PP1β, protein phosphatase 1β; FBS, fetal bovine serum. NS, no significant difference. p-values within groups were obtained by paired Student’s t-tests, and those between groups were obtained by ANOVA.
kjpp-26-6-479-f4.tif
Fig. 5

Effects of MRTF-A knockout on phenotypic changes.

Cells at ~70% confluence were transfected with control plasmids (A, lane 1) or the MRTF-A gene was knocked out using MRTF-A HDR CRISPR-associated 9 (Cas9) (A, lane 2) for three days. On day 2 postconfluence, the expression of MRTF-A, N-cad, sm MHC, nm MHC, and PP1β in the supernatant fraction (80 μg) was determined as described in the legend of . p-values were obtained by unpaired Student’s t-tests. (B) Control and knockout cells were incubated before and after stimulation with ML-7 (6 × 10⁻⁵ M) for 1 h each, and secreted active renin was measured by ELISA (B, n = 4). MRTF-A, myocardin related transcription factor-A; HDR, homology directed repair; CRISPR, clustered regularly interspaced short palindromic repeats; sm MHC, smooth muscle myosin heavy chain; nm MHC, nonmuscle myosin heavy chain; PP1β, protein phosphatase 1β. NS, no significant difference. p-values were obtained either by paired Student’s t-tests (within groups) or by ANOVA (between groups).
kjpp-26-6-479-f5.tif
Fig. 6

Effects of SRF knockout on phenotypic changes.

Cells were transfected with control plasmids (A, lane 1) or SRF HDR CRISPR/Cas9 plasmids (A, lane 2) as described in the legend of . Then, the expression of each protein was determined in the supernatant fraction (80 μg). Both control and knockout cells were incubated with ML-7 (6 × 10⁻⁵ M) before and after stimulation for 1 h each, and secreted active renin was measured by ELISA (B, n = 5). SRF, serum response factor; HDR, homology directed repair; CRISPR, clustered regularly interspaced short palindromic repeats. p-values were obtained either by paired Student’s t-tests (within groups) or by ANOVA (between groups).
kjpp-26-6-479-f6.tif
Fig. 7

Effects of N-cad expression on pMLC20 and PP1β.

Cells were cultured to 100% confluence and maintained for two more days in the presence of 10% FBS (lane 1) or in the presence of both FBS and IGF-1 antibody (10 μg/ml) (lane 2). Proteins in the supernatant (40 μg) were resolved by Western blotting as described above (n = 4). pMLC20, phosphorylated 20 kDa myosin light chain; PP1β, protein phosphatase 1β; FBS, fetal bovine serum; IGF-I, insulin-like growth factor-I. p-values were obtained by unpaired Student’s t-tests.
kjpp-26-6-479-f7.tif
Fig. 8

Effects of MYLK knockdown on phenotypic changes.

Cells were transfected with control or siRNA of MYLK plasmids as described in the legend of . Expression of MYLK and the cytosolic pMLC20 level (A) were determined using supernatant protein (60 μg). p-values were obtained by unpaired Student’s t-tests (n = 3). Active renin secretion from control and knockdown cells was determined by incubating cells in DMEM + 10% FBS for 1 h (B, n =6). pMLC20, phosphorylated 20 kDa myosin light chain; DMEM, Dulbecco’s modified eagle medium; FBS, fetal bovine serum. p-values by unpaired Student’s t-tests.
kjpp-26-6-479-f8.tif
Fig. 9

Effects of PP1β knockdown on phenotypic changes.

Cells were transfected with control (lane 1) or siRNA of PP1β plasmids as described in the legend for . The expression of PP1β (A, upper panel) and cytosolic pMLC20 level (A, lower panel) were determined using supernatant protein (60 μg). p-values were obtained by unpaired Student’s t-tests (n = 4). Active renin secretion was determined before and after stimulation by ML-7 (6 × 10⁻⁵ M) for 1 h each, and secreted renin was measured by ELISA (B). PP1β, protein phosphatase 1β; pMLC20, phosphorylated 20 kDa myosin light chain. p-values were obtained either by paired Student’s t-tests (within groups) or by ANOVA (between groups) (n = 6).
kjpp-26-6-479-f9.tif
Fig. 10

Effects of ML-7 and calyculin A on the phosphorylation of MLC20.

On day 2, postconfluent cells were incubated in DMEM + 10% FBS (control) in the presence of ML-7 (6 × 10⁻⁵ M; ML-7) and in the presence of both calyculin A (2 × 10⁻⁷ M) and ML-7 (6 × 10⁻⁵ M; ML-7 + Caly) for 1 h. The level of pMLC20 was determined using supernatant protein (80 μg). MLC20, 20 kDa myosin light chain; DMEM, Dulbecco’s modified eagle medium; FBS, fetal bovine serum. p-values were obtained by ANOVA (n = 5).
kjpp-26-6-479-f10.tif
Fig. 11

Imaging of exocytotic discharge of renin and neutral red by ML-7.

Cells on postconfluent day 2 were plated on cover slips were permeabilized and stained with antibody to renin. Many cytoplasmic stained granules are seen (A, control). When cells were pretreated with ML-7 (6 × 10⁻⁵ M) for 2 min and stained with renin antibody, no granules were observed (ML-7). Scale bar: 10 μm. Cells were incubated with 100 μM neutral red for 3 h, washed with fresh DMEM, and photographed with a light microscope. Numerous neutral red stained pink granules are seen (B). N denotes nucleus. Scale bar: 3.33 μm. (C, D) When neutral red-loaded granules were viewed at the isosbestic absorbent light at 470 nm, the granules observed were black. White granules are likely discharged granules prior to imaging. When cells were perfused with ML-7 (6 × 10⁻⁵ M), #1, #2, and #3 neutral red-loaded granules were discharged over 200 msec. (D) The time-lapsed movie shows the discharge of neutral red-loaded secretory granules (Supplementary Video). DMEM, Dulbecco’s modified eagle medium.
kjpp-26-6-479-f11.tif
Fig. 12

Schematic summary of the transcriptional cascades regulating expression of proteins associated with renin secretory phenotypes in As4.1 cells.

N-cad expression at the plasma membrane upon cell-cell contact triggers MRTF-A-SRF-CArG box, which activates transcription of smooth muscle-specific genes encoding contractile proteins in association with the regulatory phenotype of active renin secretion (left side). Without N-cad expression, β-catenin (signaling cascade in the middle) and growth factors (signaling cascade of right side) trigger a signaling cascade of growth factors of cell proliferation. MRTF-A, myocardin related transcription factor-A; SRF, serum response factor; MLC20, 20 kDa myosin light chain; PP1β, protein phosphatase 1β; FBS, fetal bovine serum; IGF-I, insulin-like growth factor-I; sm MHC, smooth muscle myosin heavy chain; nm MHC, nonmuscle myosin heavy chain.
kjpp-26-6-479-f12.tif
Table 1
Secretion of active renin and inactive renin (prorenin) from preconfluent As4.1 cells in the absence and presence of ML-7
ng ANG I/well/h Inactive/total (%)
Total Active Inactive
DMEM + 10% FBS 1,486 ± 209 36.8 ± 4.5 1,449 ± 209 97.5 ± 0.4
DMEM + 10% FBS + ML-7 1,502 ± 209 26.9 ± 2.9 1,475 ± 220 98.2 ± 0.4

Values represent means ± SD from 6 wells. Preconfluent (70%–80% confluence) As4.1cells were incubated in DMEM + 10% FBS in the absence and presence of ML-7 (6 × 10⁻⁵ M) for 1 h each at 37°C in a humidified atmosphere of 5% CO2. Collected media were centrifuged at 1,000 ×g for 10 min at 4°C to remove detached cells. Renin activity was determined with (total) and without (active) trypsin (1 mg/ml) after 30 min on ice. Inactive renin was calculated by subtracting active renin from the total. ANG I, angiotensin I; DMEM, Dulbecco's modified eagle medium; FBS, fetal bovine serum. No significant difference before vs. after ML-7 by paired Student’s t-test.

Table 2
Secretion of active renin from As4.1 cells during 100% confluence day 1 to 4
Post-confluent day (ng ANG I/well/day)
Day 1 Day 2 Day 3 Day 4
DMEM 2.68 ± 1.03 10.00 ± 3.53 6.94 ± 2.82 3.10 ± 0.47
DMEM + 10% FBS 5.33 ± 1.74* 9.00 ± 5.12 13.40 ± 1.65 8.29 ± 4.04*

Values are means ± SD from 6 wells. When cells grown to 100% confluent, incubation media were switched with fresh media of DMEM or DMEM + 10% FBS every day, and incubated for 1 h. Secreted renin activity was determined as described in Table 1. ANG I, angiotensin I; DMEM, Dulbecco's modified eagle medium; FBS, fetal bovine serum. *p < 0.005 DMEM vs. DMEM + 10% FBS.

Table 3
Effects of confluence, FBS, and insulin-like growth factor-I (IGF-I) on active renin secretion
Pre-confluence Postconfluence
DMEM + 10% FBS DMEM + 10% FBS IGF-I IGF-I + Antibody
Renin secretion (ng/well/h) 10.5 ± 3.47 31.6 ± 1.25* 73.9 ± 5.72** 20.1 ± 1.70***

Values represent means ± SD from five wells. As4.1 cells were cultured in DMEM + 10% FBS to pre-confluence (70%–80% confluence) or day 2 postconfluence (postconfluence). Alternatively, cells were cultured in DMEM + IGF-I (2.6 × 10⁻¹⁰ M) or DMEM + IGF-I (2.6 × 10⁻¹⁰ M) + antibodies against IGF-I (10 μg/ml) to day 2 postconfluence (postconfluence). Culture media were replaced with fresh media and incubated for 1 h to measure the rate of renin secretion by ELISA. DMEM, Dulbecco's modified eagle medium; FBS, fetal bovine serum. p-values were calculated using the unpaired Student’s t-test. *p < 0.001 DMEM + 10% FBS at Pre-confluence vs. DMEM + 10% FBS at Postconfluence; **p < 0.001 DMEM + 10% FBS at Postconfluence vs. DMEM + IGF-I at Postconfluence; ***p = 0.001 DMEM + IGF-I at Postconfluence vs. DMEM + IGF-I + Antibody at Postconfluence.

Table 4
Renin secretion from pre- and postconfluent As4.1 cells in the presence of FBS and IGF-I antibody measured by ELISA
Pre-confluence Postconfluence
+ FBS (1) – FBS (2) + FBS (3) + FBS + IGF-I antibody (4)
Active renin (ng/well/h) 7.2 ± 0.52 10.9 ± 0.31* 17.9 ± 0.47** 10.3 ± 0.34***,****
Inactive renin (ng/well/h) 366 ± 112 245 ± 36.7 51.2 ± 16.0†† 242 ± 38†††, ††††

Values represent means ± SD from 6 wells. Cells were cultured to 70%–80% confluence in DMEM + 10% FBS (Pre-confluence) or to 100% confluence. Culture medium was replaced with DMEM without FBS (– FBS), DMEM + 10 % FBS (+ FBS), or DMEM + 10% FBS containing 10 ng/ml IGF-I antibody and cultured for 2 more days (Postconfluence). Cells were incubated in fresh media under each culture condition for 1 h to determine the rate of renin secretion. Levels of active and inactive renin were determined with the use of mouse renin ELISA kit from RayBiotech® and mouse prorenin kit from Molecular Innovations®, respectively. DMEM, Dulbecco’s modified eagle medium; FBS, fetal bovine serum; IGF-I, insulin-like growth factor-I. p-values were calculated by ANOVA. *p < 0.001 (1) vs. (2); **p < 0.001 (2) vs. (3); ***p < 0.001 (3) vs. (4); ****p < 0.001 (1) vs. (4); p = 0.006 (1) vs. (2); ††p < 0.001 (2) vs. (3); †††p < 0.001 (3) vs. (4); ††††p = 0.005 (1) vs. (4). No significant difference between (2) and (4) in active and inactive renin secretion.

Table 5
Effects of ML-7, forskolin + IBMX, and calyculin A on inactive renin secretion from postconfluent cells
Control ML-7 Forskolin Calyculin A
Prorenin (ng/well/h) 81.5 ± 7.6 21.4 ± 1.1*,** 36.3 ± 9.7*,** 155.2 ± 20.7*

Values represent means ± SD from 6 wells. On day 2 postconfluence, cells were incubated in DMEM + 10% FBS alone (Control) or containing ML-7 (6 × 10⁻⁵ M), forskolin (3 × 10⁻⁵ M) + IBMX (10−4 M), or calyculin A (2 × 10⁻⁷ M) for 1 h. Levels of secreted prorenin were determined with the use of mouse prorenin/renin total antigen ELISA kit from Molecular Innovations. DMEM, Dulbecco's modified eagle medium; FBS, fetal bovine serum. p-values were calculated by ANOVA. *p < 0.001 vs. Control; **p < 0.001 vs. Calyculin A. No significant difference between ML-7 and Forskolin.

Table 6
Effects of various agents on active renin secretion
Agent Action n Effect on active renin secretion (E/C)
Ionomycin (10−5 M) Ca2+ ionophore 6 0.57 ± 0.12*
ANG II (10−8 M) Phospholipase activator 7 0.54 ± 0.16*
U73122 (3 × 10⁻⁵ M) PLC inhibitor 5 4.23 ± 1.63*
U73343 (3 × 10⁻⁵ M) Inactive analogue of U 73122 5 1.19 ± 0.38
Ophiobolin A (3 × 10⁻⁵ M) CaM inhibitor 6 3.76 ± 1.22*
K252a (10−5 M) Broad spectrum protein kinase inhibitor 6 2.33 ± 0.93*
Butanedione monoxime (25 mM) MLCK inhibitor 5 4.35 ± 0.85*
GF-109203X (3 × 10−6 M) PKC inhibitor 6 0.97 ± 0.15
Y-27632 (3 × 10⁻⁵ M) Rho kinase inhibitor 8 1.34 ± 0.11*
Calyculin A (2 × 10⁻⁷ M) Protein phosphatase 1 & 2A 6 0.77 ± 0.12*
LY294002 (5 × 10⁻⁵ M) Phosphatidylinositol-3 kinase inhibitor 5 0.61 ± 0.13*
Wortmanin (10−6 M) Phosphatidylinositol-3 kinase inhibitor 5 0.54 ± 0.09*
SB216763 (2 × 10⁻⁵ M) GSK-3β inhibitor 6 1.89 ± 0.17*
Blebbistatin (10−6 M) Myosin ATPase inhibitor 8 1.21 ± 0.37

Values represent means ± SD. Cells were grown in DMEM + 10% FBS to 100% confluence. On day 2 postconfluence, cells were incubated in 1 ml fresh DMEM + 10% FBS for 1 h (C) followed by incubation in medium containing one of the above agents (E). Concentrations in parentheses are the concentrations tested. (E/C) values significantly greater than 1.0 or less than 1.0 indicate stimulation or inhibition of renin secretion, respectively. DMEM, Dulbecco's modified eagle medium; FBS, fetal bovine serum. *p < 0.05.

TOOLS
Similar articles