I. Introduction
II. Materials and Methods
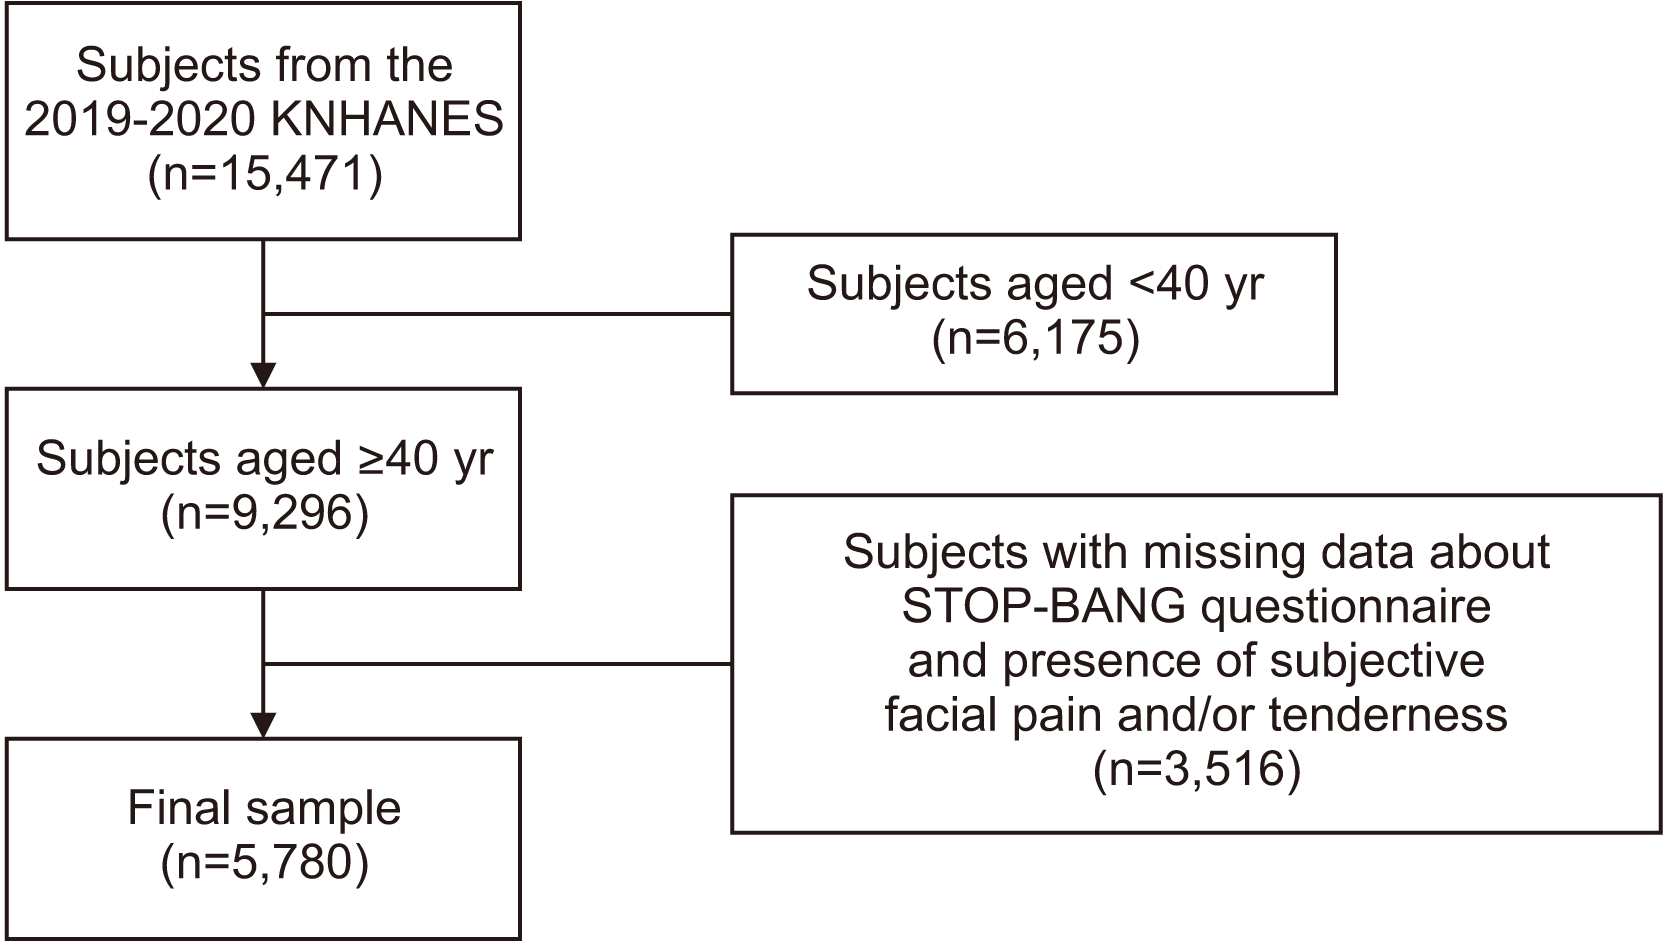
1. Participants
2. Anthropometric assessment
3. Sociodemographic factors and health-related behaviors
4. STOP-BANG and duration of sleep
5. Statistical analysis
III. Results
Table 1
| Variable | Total | Facial pain and/or pressure | P-value | ||||
|---|---|---|---|---|---|---|---|
|
|
|||||||
| No | Yes | ||||||
|
|
|
||||||
| n |
% (95% CI) or mean±SE |
n |
% (95% CI) or mean±SE |
||||
| Age | 5,780 | 0.240 | |||||
| >50 yr | 4,448 | 73.9 (72.4-75.3) | 20 | 0.4 (0.2-0.6) | |||
| ≤50 yr | 1,300 | 24.0 (22.6-25.5) | 12 | 39.5 (22.3-59.7) | |||
| Sex (male/female) | 5,780 | 0.978 | |||||
| Male | 2,491 | 43.4 (41.9-44.9) | 12 | 41.6 (24.0-61.6) | |||
| Female | 3,257 | 56.6 (55.1-58.1) | 20 | 58.4 (38.4-76.0) | |||
| Waist circumference1 (cm) | 5,768 | 5,736 | 85.7±0.2 | 32 | 85.7±1.7 | 0.724 | |
| Neck circumference (cm) | 5,754 | 0.605 | |||||
| >17 inch for males, >16 inch for females | 53 | 0.9 (0.7-1.2) | 0 | 0 | |||
| ≤17 inch for males, ≤16 inch for females | 5,669 | 99.1 (98.8-99.3) | 32 | 100.0 (100.0-100.0) | |||
| BMI | 5,719 | 0.752 | |||||
| BMI >35 kg/m2 | 30 | 0.4 (0.3-0.7) | 0 | 0 | |||
| BMI ≤35 kg/m2 | 5,657 | 99.6 (99.3-99.7) | 32 | 100.0 (100.0-100.0) | |||
| Household income | 5,762 | 0.521 | |||||
| <25% | 1,256 | 17.2 (16.1-18.3) | 8 | 23.8 (10.8-44.7) | |||
| 25%-49% | 1,439 | 23.6 (22.4-25.0) | 6 | 21.3 (8.6-43.9) | |||
| 50%-74% | 1,470 | 28.0 (26.7-29.4) | 5 | 17.0 (6.6-37.2) | |||
| ≥75% | 1,565 | 31.2 (29.7-32.7) | 13 | 37.9 (21.4-57.8) | |||
| Education | 5,727 | 0.613 | |||||
| ≤Primary school | 1,338 | 17.9 (16.9-18.9) | 8 | 17.4 (7.9-33.9) | |||
| Middle school | 723 | 10.8 (9.9-11.7) | 2 | 7.0 (1.2-30.8) | |||
| High school | 1,876 | 35.4 (34.0-36.9) | 12 | 47.2 (28.4-66.9) | |||
| ≥College or higher | 1,758 | 35.9 (34.5-37.4) | 10 | 28.4 (15.1-47.0) | |||
| Hypertension | 5,783 | 0.056 | |||||
| Yes | 1,937 | 29.8 (28.5-31.2) | 9 | 24.6 (12.0-43.9) | |||
| No | 3,814 | 70.2 (68.8-71.5) | 23 | 75.4 (56.1-88.0) | |||
| Depression | 5,780 | 0.085 | |||||
| Yes | 321 | 4.8 (4.2-5.4) | 5 | 13.0 (5.0-30.1) | |||
| No | 5,427 | 95.2 (94.6-95.8) | 27 | 87.0 (69.9-95.0) | |||
| EQ-5D index1 | 5,780 | 5,748 | 0.990±0.001 | 32 | 1.000±0.001 | <0.001** | |
| Awareness of stress | 5,776 | <0.001** | |||||
| Very high | 215 | 3.7 (3.2-4.4) | 6 | 25..9 (11.8-47.6) | |||
| High | 1,118 | 20.2 (19.0-21.5) | 10 | 37.3 (19.9-58.6) | |||
| Moderate | 3,409 | 60.8 (59.3-62.2) | 12 | 27.6 (14.7-45.9) | |||
| Low | 1,002 | 15.2 (14.2-16.2) | 4 | 9.2 (3.0-25.3) | |||
| Smoking status | 5,778 | 0.004* | |||||
| Never of former | 3,466 | 98.2 (97.6-98.7) | 17 | 0.4 (0.3-0.7) | |||
| ≤5 packs | 87 | 1.7 (1.3-2.1) | 0 | 0 | |||
| ≥5 packs | 2,193 | 41.5 (40.0-43.0) | 15 | 59.6 (40.6-76.1) | |||
| Alcohol consumption | 5,778 | 0.253 | |||||
| None or light | 827 | 11.6 (10.7-12.5) | 4 | 5.2 (1.6-15.8) | |||
| Moderate or heavy | 4,919 | 88.4 (87.5-89.3) | 28 | 94.8 (84.2-98.4) | |||
Table 2
| Variable | Total | Facial pain and/or pressure | P-value | ||||
|---|---|---|---|---|---|---|---|
|
|
|||||||
| No | Yes | ||||||
|
|
|
||||||
| n |
% (95% CI) or mean±SE |
n |
% (95% CI) or mean±SE |
||||
| Average sleep duration during weekdays (hr)1 | 5,780 | 5,748 | 6.63±0.06 | 32 | 6.10±0.27 | 0.074 | |
| Average sleep duration during weekends (hr)1 | 5,780 | 5,748 | 7.14±0.06 | 32 | 6.44±0.33 | 0.045* | |
| Diagnosis of OSA | 5,780 | 0.021* | |||||
| Yes | 32 | 0.6 (0.4-0.9) | 0 | 0 | |||
| No | 5,716 | 99.4 (99.1-99.6) | 32 | 100.0 (100.0-100.0) | |||
| STOP-BANG | 5,701 | <0.001** | |||||
| Low risk | 3,513 | 62.8 (61.3-64.3) | 26 | 82.0 (64.0-92.1) | |||
| Moderate risk | 1,932 | 33.3 (31.9-34.8) | 6 | 18.0 (7.9-36.0) | |||
| High risk | 224 | 100.0 (100.0-100.0) | 0 | 0 | |||
| Snoring | 5,780 | 0.618 | |||||
| Yes | 1,097 | 20.2 (18.9-21.6) | 7 | 26.2 (12.2-47.7) | |||
| No | 4,651 | 79.8 (78.4-81.1) | 25 | 73.8 (52.3-87.8) | |||
| Tiredness | 5,780 | 0.002* | |||||
| Yes | 1,719 | 30.0 (28.6-31.5) | 17 | 59.1 (39.7-76.0) | |||
| No | 4,029 | 70.0 (68.5-71.4) | 15 | 40.9 (24.0-60.3) | |||
| Observed apnea | 5,780 | 0.405 | |||||
| Yes | 491 | 9.5 (8.6-10.6) | 6 | 17.3 (7.2-36.1) | |||
| No | 5,257 | 90.5 (89.4-91.4) | 26 | 82.7 (63.9-92.8) | |||


 PDF
PDF Citation
 Print
Print


 XML Download