

 PDF
PDF Citation
 Print
Print


Introduction
Kidney transplantation surgery, in which vascular abnormalities account for dysfunction in up to 10% of the renal transplanted patients at any time after graft placement [1], and the use of current techniques for treating refractory hypertension make the renal artery growing in relevance.
Angioplasty to repair renal artery stenosis [2-4] renal denervation to control sympathetic arterial activity, including catheter-based renal denervation [5-7] and renal artery adventitia stripping [8] are all techniques currently considered for the control of refractory hypertension. These techniques act on the main renal artery as the target.
However, along with recent studies in which renal artery characterization was not the main object of the research, and only a specific part of the artery was scrutinized, studies focusing on the renal artery’s structural characteristics are scarce. These studies include little more than the analysis of the human renal artery in the context of a histological examination of the peripheral arteries [9], the description of its ultrastructure in the rat during growth and aging [10], and some studies carried out on the transitional zone of the renal artery [11, 12].
The main renal artery is a conduit artery that appears at approximately 6 to 7 weeks of prenatal development in humans [13, 14] and supplies around 20% of the cardiac output to the kidney. The length and diameter of this artery vary with the side age and sex [15]. Variations in the number of renal arteries that arrive at a kidney are frequent and occur in approximately 30% of kidneys [16-18]. The multiple renal arteries originate in the lateral aspect of the aorta, iliac arteries even in the testicular arteries [19].
The mammalian arteries are usually classified as elastic or muscular arteries, depending on the histological characteristics of the tunica media; both types of vessels differ in structure, production of nitric oxide, and Ca++ channels [20]. Therefore, the physiological and pathological arterial characteristics depend on the amount of elastic, fibrous, and muscular components in the tunica media.
According to the type, elastic arteries are more prone to atherosclerosis than are muscular arteries. Moreover, arterial stiffening due to aging is more prominent in elastic arteries [20, 21]; meanwhile, the muscle arteries' stiffness leads to an increase in vascular tone, which can be influenced by vasoactive mediators [22].
Wright in human renal arteries [9] and Osborne-Pellegrin [10] in rat renal arteries described variations in its structure from the proximal to the distal segment. Therefore, renal artery pathological stenosis would be produced by different pathologic processes depending on the affected arterial segment so that the therapeutic approach may be different.
This work aims to characterize the renal arterial wall along its length, assess the fraction of extracellular matrix, elastic component, and smooth muscle cells (SMCs) in the tunica media of different sections of the artery, and compare the fraction of those components in the distinct segments, as well as to discuss the possible consequences of any variations on vascular pathology and therapeutic procedures to the artery.
Materials and Methods
Study material
Thirty-two main renal arteries from the aorta to renal hilus were obtained from 16 cadavers (14 male and two female) aged 14–75 years (Table 1). Cadaverswerenecropsied in the Instituto de Medicina Legal de Las Palmas de Gran Canaria. The arteries were removed in a block from the corpses, dissected and sectioned.
Tissue preparation
The right and left renal arteries were circumferentially cross-sectioned in three-thirds (proximal, middle, and distal) (Table 1) and fixed by immersion in neutral buffered 10% formalin. A total of 96 tissue samples were processed for histological and immunohistological studies. After fixation, the samples were dehydrated through graded alcohols and embedded in paraffin wax. One tissue block was made from each arterial segment, and consecutive transverse sections of 5µm thickness were obtained from each paraffin block.
Sections were stained with the following techniques: hematoxylin-eosin, Masson’s trichrome, and resorcin using routine methods in our lab.
For immunohistochemistry studies, sections were immunolabeled with anti-von Willebrand factor, anti-actin, and anti-S100 neuronal antibodies. The immunohistochemical methodology is summarized in Table 2.
Von Willebrand factor immunodetection was performed with an anti-human polyclonal anti-factor VIII-related antibody produced in rabbits at a dilution of 1:100. In addition, an anti-human monoclonal anti-actin alpha-smooth muscle antibody produced in mice, diluted 1:2,000, was utilized for actin immunodetection. For S100 detection, an anti-human monoclonal S100 antibody was produced in rabbits; a 1:300 dilution was used. In all cases, endogenous peroxidase was blocked with 3% hydrogen peroxide for 30 minutes in methanol.
Samples were analyzed with a Labophot-2 Nikon microscope (Badhoevedorop, The Netherlands), and a Sight DS-5 M digital camera (Nikon Digital Sight DS-5M-L1; Melville, NY, USA) captured images at 2×, 4×, 10×, and 100× magnification. The descriptive, structural analysis was always done in the healthy part of each sector of the arterial wall, avoiding destructured zones, calcifications, and pathologic thicknesses if they were present.
Measurements of the arterial wall thickness
The arterial wall thickness tunica intima and media (IM), tunica media, and tunica intima were measured in transverse histological sections. Measurements were performed in selected fields of one Masson trichrome-stained histological section of each case using a Digital Sight Camera Control Unit (Nikon Digital Sight DS-5M-L1) coupled to a Labophot-2 Nikon microscope. Four different measurements were performed directly in each histological section using digital camera tools. The arterial sections were divided into four-quadrant. Measurements were done in each of the four quadrants, always avoiding damaged tissue if it was present. The median of the four sizes was considered the value of the measure. The tunica media thickness was considered to be the perpendicular stretch between the innermost and outermost elastic lamina. The tunica adventitia was not measured because it was not possible to determine the outer limit of this tunica in all cases.
Quantification of the components of the arterial wall
The quantification of the structural elements of the arterial wall was measured in the arterial tunica media. The elastic tissue was assessed between the inner and outer elastic membrane without the inclusion of those.
Photographs (4×) from the samples stained with Masson’s trichrome were used to quantify the SMCs and extracellular matrix composition in the tunica media. Photographs (10×) of the samples stained with resorcin stain were used for the determination of the elastic component in the tunica media between the inner and the outer elastic lamina, avoiding those laminas.
Quantification of the fraction of elastin
Each delimited image was converted to grayscale and then binarized by a high threshold value resulting in a binary image, in which the media layer appears as a white object over a black background [22]. The resulting image defines the portion of the original image corresponding to the media layer of the vessel wall.
In a binary image, the white color is coded with the value 1, and the black color is coded with 0. Therefore, the media layer area identified by the white color can be calculated in pixels as the sum of all the pixels of the image.
On the other hand, each delimited image was binarized with a global threshold that could be adjusted interactively, allowing user to determine the threshold that properly segmented the elastin fibers (FE). The quantitative information extracted was the sum of pixels of the segmented objects in the resulting image of the elastin fiber segmentation. To compare measurements between different samples, the above amount was normalized by the sum of pixels of the media layer area computed previously, according to the following formula:
The segmentation method was implemented using the numerical computing software MATLAB/Simulink Version R2019a (MathWorks, Natick, MA, USA).
Quantification of the muscular and extracellular matrix
First, the color image is converted to grayscale and then binarized by a high threshold value, resulting in a binary image, in which the inner and outer contours of the media layer were delimited to define the study area [22]. The media layer appeared as a white object over a black background, and the media layer area was calculated in pixels as the sum of all the pixels of the binarized image.
Second, the color vessel wall image was clustered automatically in a predefined number of color-based classes. The smooth muscular fibers (SMF), and extracellular matrix components (ECM) of the vessel wall were grouped by a clustering algorithm based on the similarity between colors. The clustering algorithm used was a variation of the k-means [23-26], in which the similarity measure between two pixels, px1 and px2, is based on the distance calculated by the following expression:
where R1, G1, and B1 are the color components of pixel px1, and w1, w2, and w3 are the weights that regulate the importance of each color component.
The number of groups k for the clustering algorithm was set at three with the aim of grouping the pixels corresponding to SMF, to ECM, and to the background image. The weights were determined heuristically as w1=2, w2=1, and w3=2. The results were several black and white images, one per cluster, with the segmented vessel wall component, allowing us to calculate its extension. The third group of pixels corresponding to the background image was discarded.
The area in pixels of any component was computed by the sum of pixels of the segmented objects in the black and white images of each component. In this way, we obtained two measurements: ASMF, the area in pixels of the SMF component, and AECM, the area in pixels of the ECM component.
The percentage of the total area of the media layer that was taken up by a component was calculated using the following formulas:
Statistical analysis
Data were analyzed using IBM SPSS Statistics ver. 27.0 (released 2020, for Windows; IBM Corp., Armonk, NY, USA). Categorical variables are expressed as frequencies and percentages. To analyze the association of two categorical variables, the chi-squared test was used. Numerical variables are summarized using the median and interquartile range (IR). Normality was considered according to the results of the Kolmogorov–Smirnov or Shapiro–Wilk tests. The 95% confidence interval (CI) is given in any case. To compare numerical variables of two independent samples, the nonparametric Mann–Whitney U test was used. For more than two independent samples, one-way ANOVA or the nonparametric Kruskal–Wallis test was used. Results are considered statistically significant if P<0.05.
Ethical approval
The Ethical Committee of the University of Las Palmas de Gran Canaria approved this research project (reference CEIH-2022-01), and the Formation and Research Committee of the Instituto de Medicina Legal y CienciasForenses de Las Palmas (IMLCF-Gobierno de Canarias) accredited that obtaining human samples followed the ethics and legal requirements.
Results
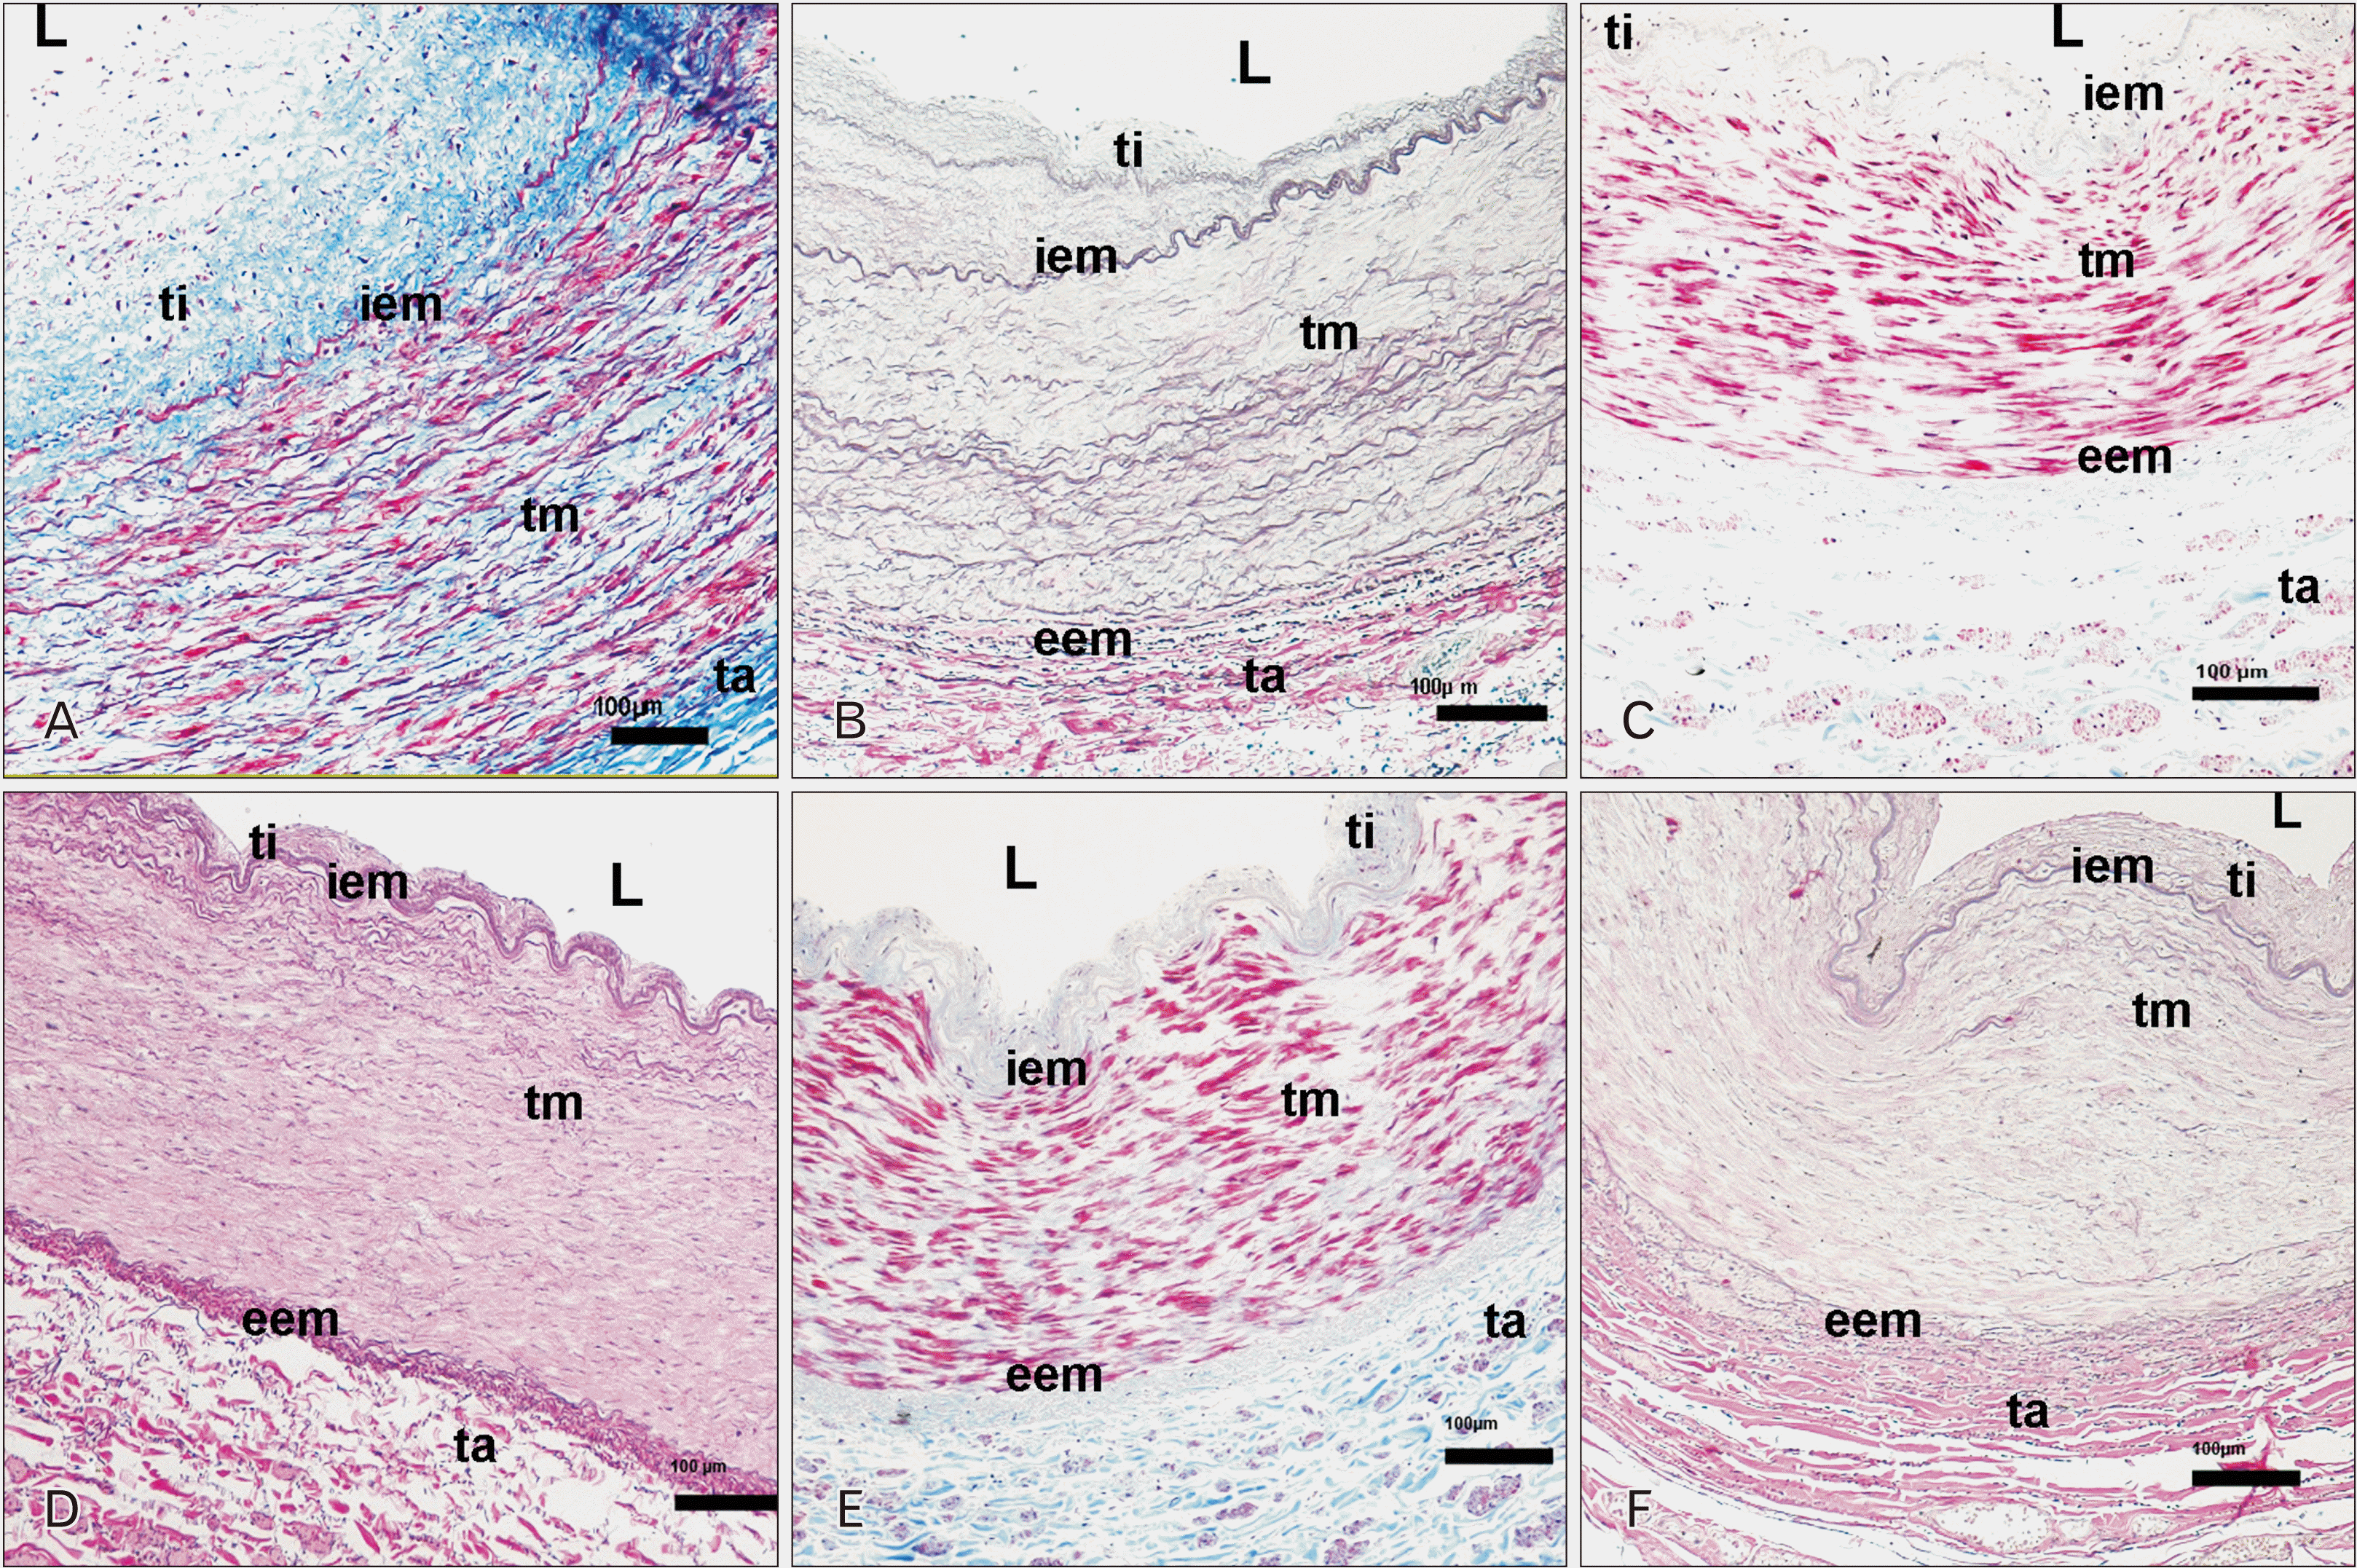
Histological and morphometric evaluation of the renal artery wall
The IM thickness was 493.6 μm (IR=285 μm) (Table 3). The boundary between the tunica intima and tunica media was well defined along the artery for an inner elastic membrane. The tunica media and tunica adventitia boundary was consistently well represented in all vessel sectors due to the morphological differences between the two tunica. The tunica media was formed by concentric layers of SMCs, different amounts of extracellular matrix, and elastic laminas, which had diverse dispositions depending on the arterial sector. The outer elastic membrane was considered to have two or more concentric elastic layers located between the tunica media and the tunica adventitia.
Although the left IM thickness was slightly wider than the right IM thickness, there was no significant difference between them. However, a significant difference was observed between the proximal and the other two arterial segments (Table 3).
Tunica intima
The tunica intima was constituted by endothelium and underlying connective tissue. In some cases, SMCs longitudinally disposed of could be observed. The thickness of the measured tunica intima was 40.2 μm (IR=143.5 μm), reaching the highest values in damaged zones and because of the presence of any pad. The tunica intima in our samples was significantly more expansive in the proximal arterial segment than in the other more distal arterial parts (Fig. 1, Table 3).
Tunica media
The thickness of the tunica media was 441.8 μm (IR=190.1 μm). There was no difference between the tunica media on the right and left renal arteries.
In the proximal third of the artery, the tunica media contained elastic layers running parallel to the SMC layers. Nevertheless, one external elastic membrane was not well defined (Fig. 1A, B).
The middle third of the artery showed well-defined inner and outer elastic membranes.
The tunica media was composed of SMCs and an extracellular matrix. In addition, some elastic laminas and smaller elastin plates were scattered in the spaces between muscle cells (Fig. 1C, D).
The tunica media of the distal third of the renal artery showed the presence of well-defined internal and external elastic membranes, limiting the tunica media from the tunica intima and tunica adventitia, respectively. Thus, the tunica media mainly comprises SMCs and connective matrix, with elastic laminas scarcely observed, and only small plates of elastic tissue present (Fig. 1E, F).
Components of the tunica media
The proportion of SMCs in the tunica media was 25.1% (IR=13.2%). There was no significant difference between the right and left renal arteries or the studied segments. However, a slight, no significant decrease in the muscular component was observed in the middle segment (Table 4).
The extracellular matrix constituted 73.4% (IR=14.2%) of the tunica media. This component was slightly higher in the left than in the right artery, without a significant difference. However, concerning the segments, the highest proportion of extracellular matrix appeared in the middle part of the artery, and this difference was nearly significant (Table 4).
The elastic fibers component of the extracellular matrix assessed between the inner and outer elastic membranes was 12.2% (IR=12.1%), with a slightly no significant higher percentage on the left than on the right side (Table 4).
However, the percentage of elastic fibers decreased significantly between the proximal and middle segments and between the proximal and distal segments, being the difference not significant between the middle and distal sectors (Table 4).
Tunica adventitia
The tunica adventitia was formed by connective tissue with elastic fibers located in several directions. Multiple vasa and nervi vasorum were present. The tunica adventitia extended toward fatty tissue in its outer part, putting it together with adjacent structures.
Outer elastic lamina
An outer elastic membrane sharing the adventitia from the tunica media was not well defined in the proximal segment of the renal artery (Fig. 1A, B). Therefore, the elastic layers in the media adventitia border changed along the artery to form a well-defined outer elastic membrane in the middle and distal segments of the artery (Fig. 1C–F).
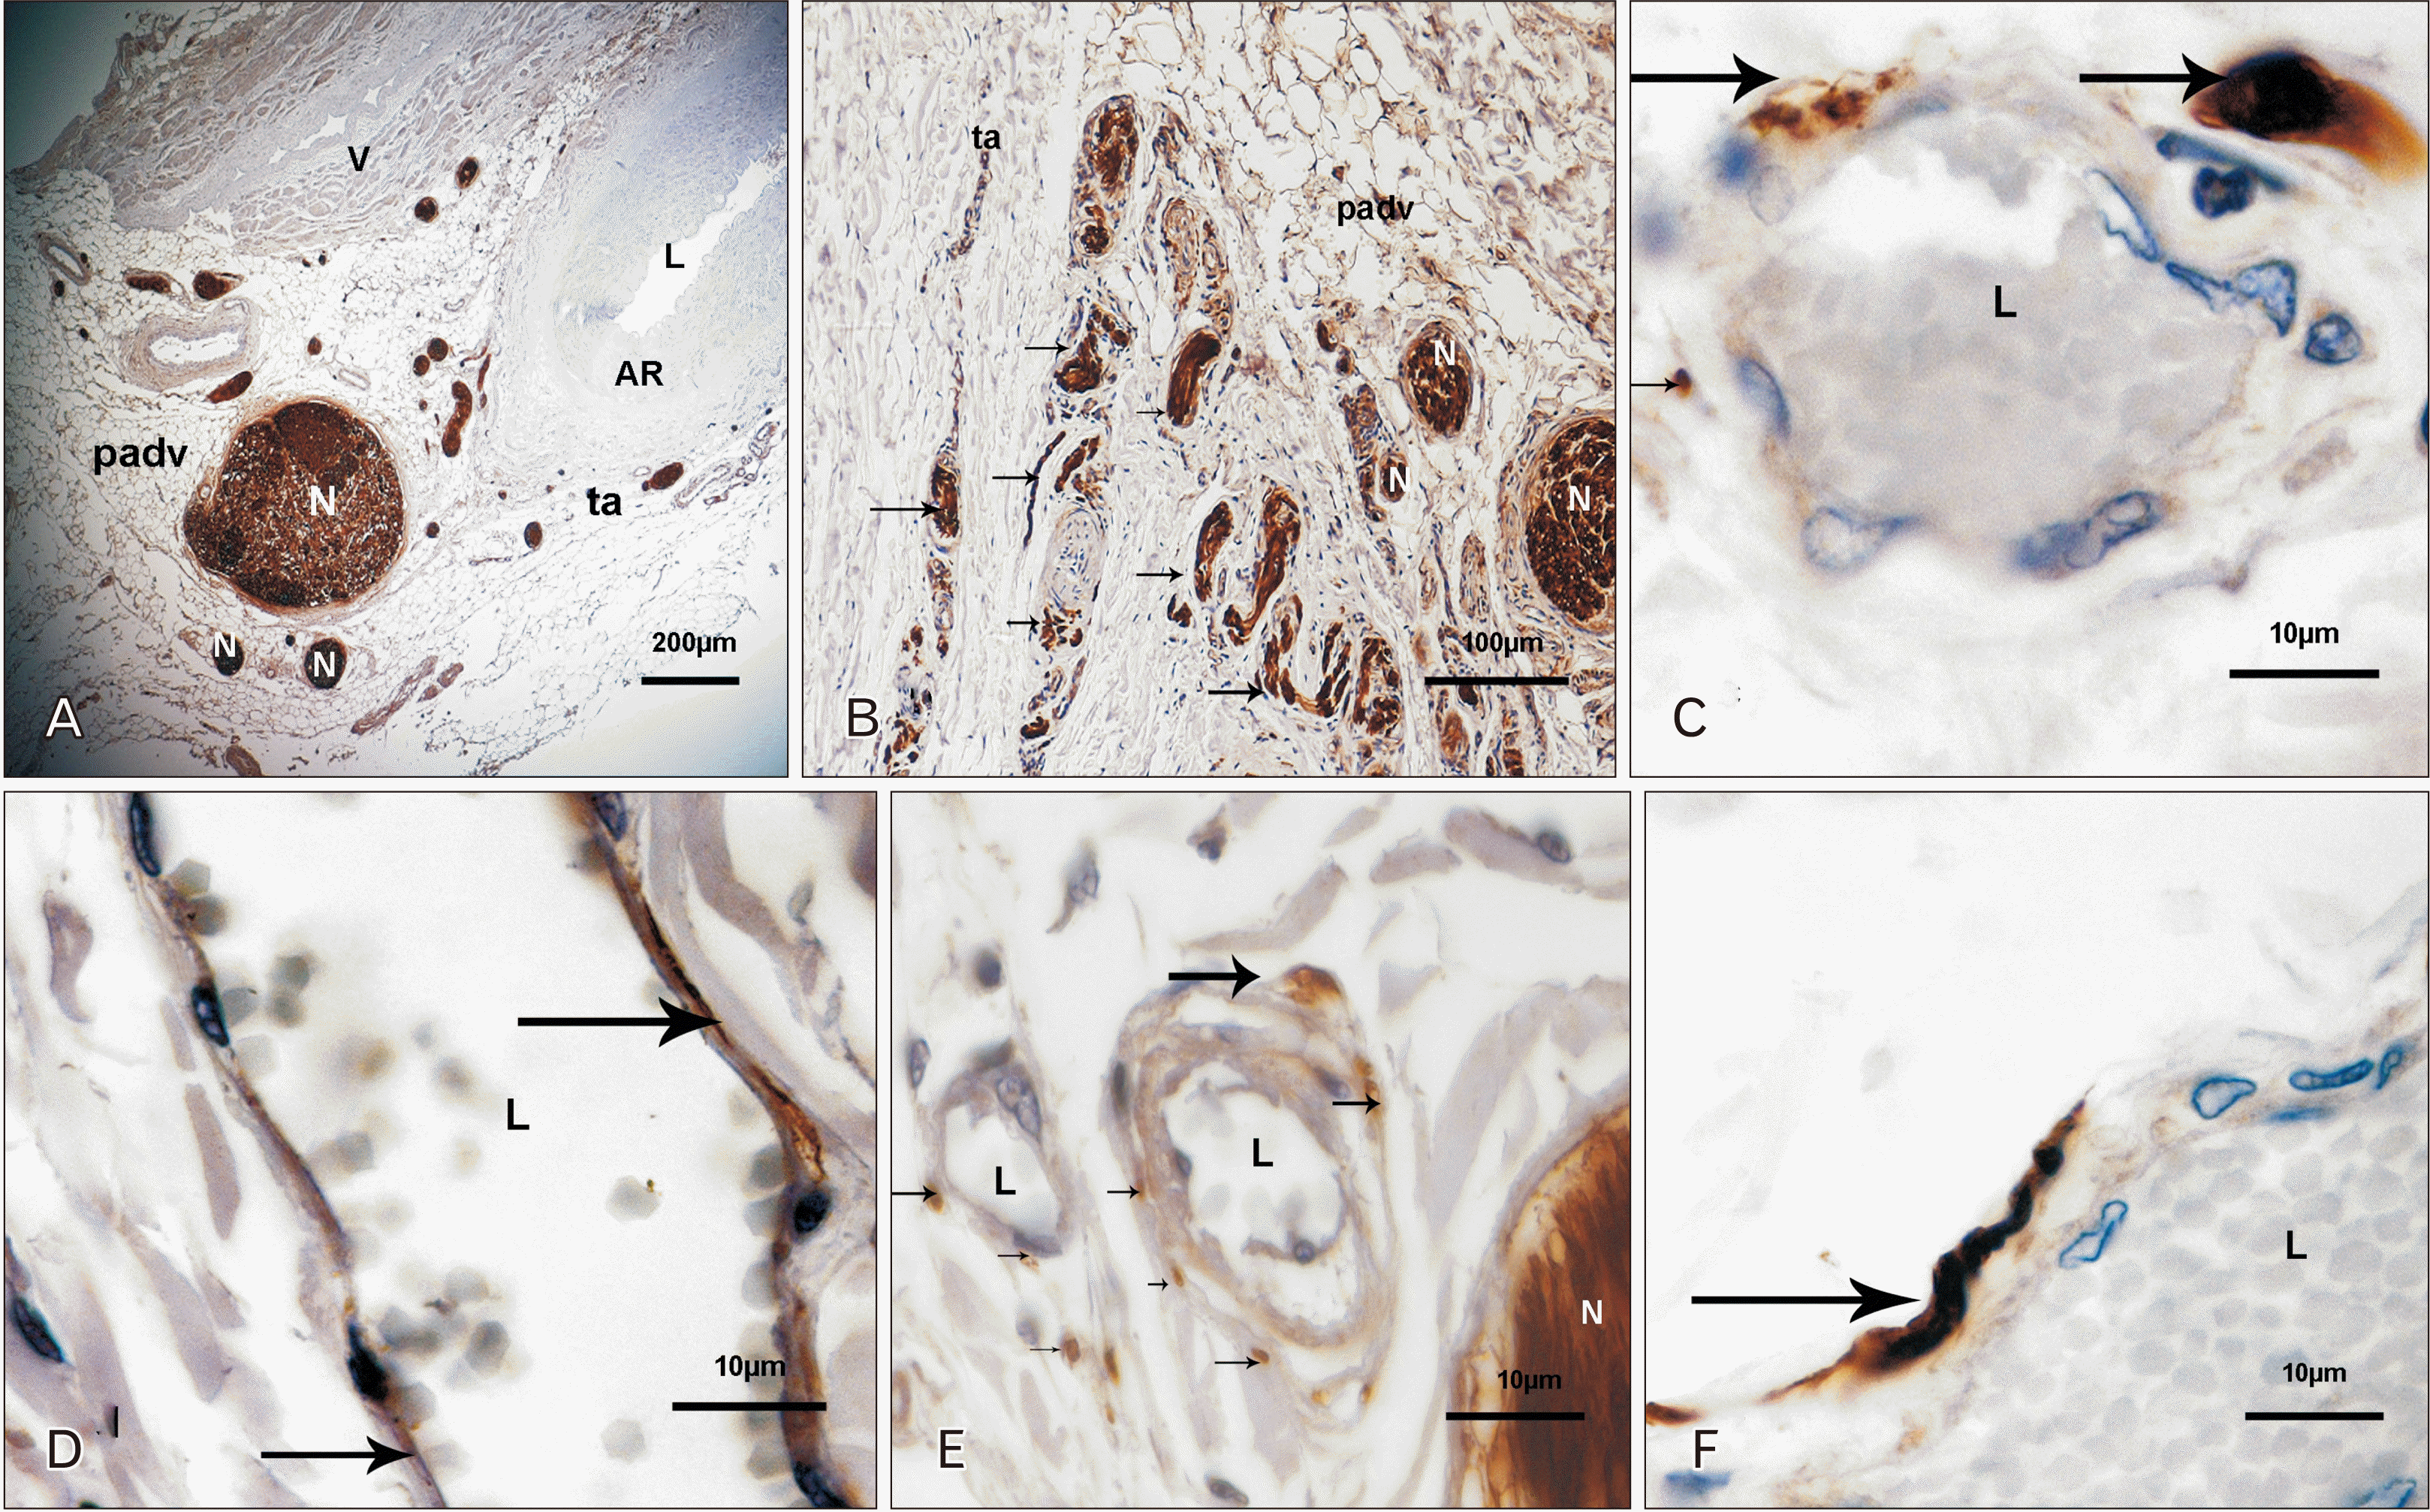
Ganglia, nerves and nervous endings
In the surrounding arterial tissue beyond the outer part of the adventitia, small ganglia were observed and nerves profiles from the renal plexus were disposed parallel to the length of the artery (Fig. 2A, B). Smaller nerves and myelinated fibers went into the tunica adventitia. Myelinated fibers profiles were located in the walls of the vasa vasorum. S100-positive fibers were not observed in other vascular tunica (Fig. 2C–F).
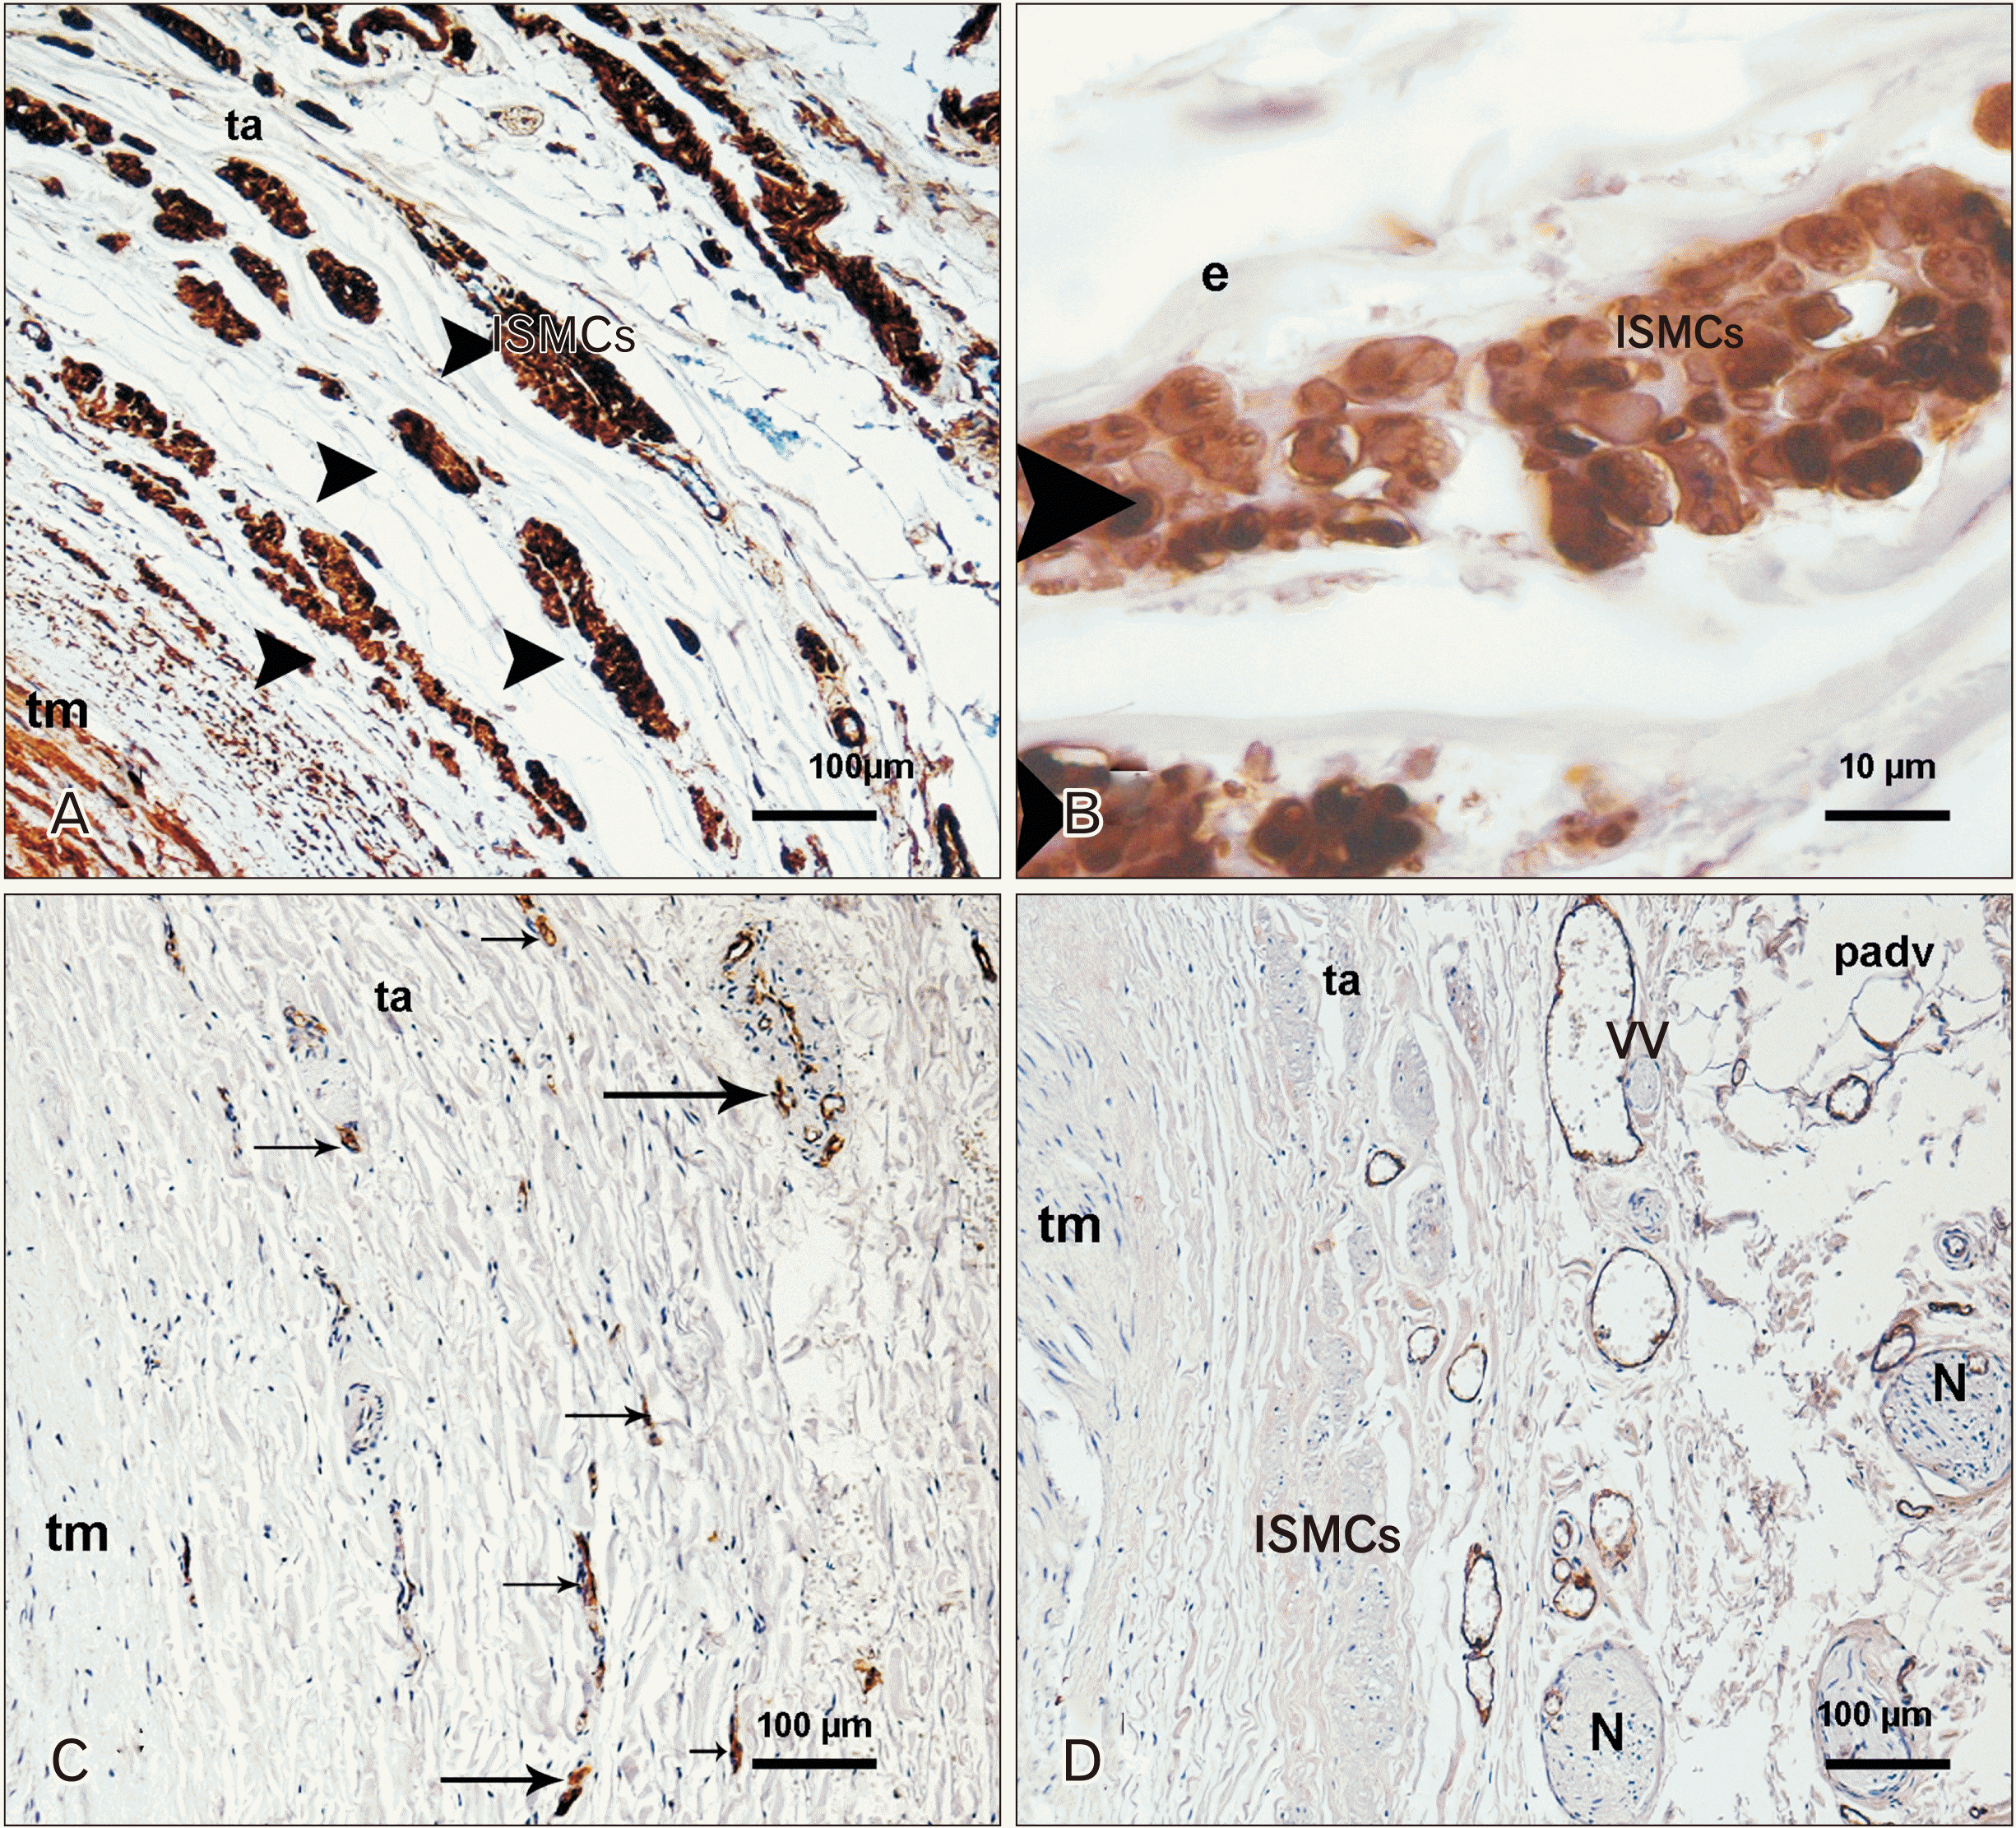
Smooth muscle cells
SMCs of longitudinal disposition were localized in the adventitia of the artery in 36 of 94 cases microscopically observed (38.3%). Bundles of SMCs were situated beyond the outer elastic membrane in the middle and distal segments of the arteries. Groups of SMCs formed fusiform structures located in a circular arrangement in the transverse section of the artery. They were surrounded by elastic fibers and other elements of the extracellular matrix. These cells were positive for actin immunolabeling (Fig. 3A, B).
Vasa vasorum
The vasa mostly had a circular disposition parallel to the vascular lumen in all segments of the artery (Fig. 3C, D).
Pathology in the arterial wall of the samples studied.
In our sampling, 37.9% (36) of the samples presented any grade of a pathologic irregular wall. Of these samples, 86.1% (31) presented an atheromatous plaque, and 13.9% (5) fibromuscular dysplasia. There was no difference between the right and left sides. Nevertheless, pathologic lesions depended on the segment, with an atheromatous plaque in proximal segments and fibromuscular dysplasia in more distal segments.
Discussion
The current study shows that the main renal artery originates in the aorta as an elastic artery and approaches the kidney as a muscular artery. A similar conclusion was drawn by Wright [9] and Osborne-Pellegrin [10] in renal arteries of humans and rats. The findings of this study display for the first time that; the modification in the structure of the renal artery was accomplished by a significant decrease in the IM, tunica intima, and tunica media thickness from proximal to distal arterial segments, besides a modification in the proportion of the components of the extracellular matrix in the tunica media.
The samples showed a broader and more irregular tunica intima in the elastic part of the artery than in other more distal segments. The most expansive zones mainly corresponded to intimal cushions, which have been described as a consequence of vascular injury [27] and physiological intimal hyperplasia [28, 29].
Those intimal thicknesses are considered precursors for atherosclerotic plaque formation [30]. Therefore, our findings support that the atherosclerotic lesions would be more frequent in the proximal than in the middle and distal segments of the renal artery because of the tunica intima structure [31].
There was no difference in the tunica media between the right and the left renal arteries about the SMCs or extracellular matrix composition. Nor could we observe a significant difference in those components along the artery. The current study showed, however, an evident variation in the proportion of the ECM. The elastic tissue proportion of the extracellular matrix in the tunica media decreased from proximal to distal segments. A decrease in the elastic element along its length has also been described in the common carotid artery, and it has been considered a morphological adaptation of the tunica media to the stress in the artery [32].
The reduction in the elastic component along the artery entails an increase in the other components of the extracellular matrix as collagen and amorphous ground substance along the arterial length, and consequently a modification in the ratio between the elements of the extracellular matrix. This ratio is a valuable index of relative compliance for maintaining tension within the arterial wall. It seems crucial to the success of therapeutic procedures and predicts the response to some therapeutic techniques [33]. The results of this work support a possible different therapeutic arterial response attending to the sector of the artery used in the intervention.
Concerning the outer elastic membrane, Osborne-Pellegrin [10] described the persistence of an external elastic membrane in the renal artery only after the second arterial branching [10]. However, our results showed that the outer elastic lamina could already be seen in the middle third of the artery and that the elastic layers located between the SMCs in the proximal segment became less prominent toward the middle and distal arterial segments. The external elastic membrane showed differences depending on the disposition of the elastic lamina in the tunica media; the less elastic component the tunica media had the more elastic component the outer elastic membrane showed.
The renal artery wall receives its vascularization from; the external vascular supply of the aorta itself, the inferior suprarenal artery, or the diffuse vascular system of the retroperitoneal space, and from; the internal vascular supply of the renal artery itself [34]. In our samples, the vasa were abundant in the adventitia of normal renal arteries and were not observed in the tunica media except in pathologic samples.
We observed bunches of SMCs of longitudinal disposition in the loose part of the tunica adventitia. Those bunches appeared as fusiform and well-organized formations located in the transverse sections of the arteries. The first description of these formations was made by Osborne-Pellegrin [10] in the tunica adventitia of the renal artery of the rat, principally at branch points. More recently, longitudinally oriented cells were also described in the adventitia of the branching sites of coronary arteries of Sprague–Dawley rats, zebra finches, and lizards [35]. Those bunches have been considered the response to increased stress at the branch points and the considerable nervous control that the distal renal artery is under and whose activity regulates the blood supply to the kidney depending on the physiological conditions [10, 35]. However, our findings showed bunches of SMCs in the middle and distal segments of the renal arteries without relation to branching points; neither could we find myelinated axon profiles within those muscle strips except when they included vasa vasorum profiles.
Ábraham [36] suggested that the nerve supply of the renal arterial wall is richer than elsewhere in the organism, comparable only to the aortic arch in certain mammals. Our samples showed small S-100 positive nerve profiles in the loose part of the adventitia and more prominent nerves from the renal plexus running in the periadventitial tissue. Those nerves were mainly parallel to the artery, running toward the kidney or in an oblique disposition crossing the faces of the artery to join other nerves of the renal plexus [37]. In addition, S100-positive nerves profiles were observed in the wall of the vasa-vasorum with a likely function of regulation of blood flow [38]. The pathways that mediate vascular effects on SNA on the vascular system have not been fully elucidated [39], and it is our consideration that the innervation of the vasa vasorum could have a role in that complex interrelation.
Limitations of the study
The analysis by sex and age was not possible because of the characteristics of the samples. Direct examination of collagen was not carried out, but it would be interesting to determine the exact ratio between the ECM in other studies. Although the data from our work about the pathologic lesions observed in our samples support the specific segmental distribution of vascular pathology in the renal artery, a large population should be studied to confirm this statement.
In conclusion, the main renal artery is a complex vessel that originates as an elastic artery and ends as a muscular blood vessel, changing the thickness of its wall and its extracellular matrix composition. Besides, numerous vessels and nerves are displayed in its tunica adventitia and periadventitial tissue. Those circumstances could be involved in a specific regional pathology setting and a different response to therapeutic procedures along the artery.
 XML Download