INTRODUCTION
METHODS
Ischemia/reperfusion (IR) rat model
2,3,5-triphenyltetrazolium chloride (TTC) staining
Detection of lactate dehydrogenase (LDH) and reactive oxygen species (ROS) levels (in vivo)
Cell culture and treatment
3-(4, 5-dimethylthiazol-2-yl)-2,5-diphenyltetrazolium bromide (MTT) assay
ROS evaluation
JC-1 assay
Determination of adenosine triphosphate (ATP) content
Western blot analysis
Enzyme-linked immunosorbent assay (ELISA)
LDH measurement
Flow cytometry assay
Statistical analysis
RESULTS
BAC alleviated OGD/R-induced injury in H9C2 cell
 | Fig. 1BAC alleviated OGD/R-induced H9C2 cell injury.(A) MTT assay was performed to evaluate the viability of H9C2 cells. *p < 0.05 indicates the difference compared with vehicle group; **p < 0.01 indicates the difference compared with vehicle group. (B) The LDH level was assessed via the commercial kit. *p < 0.05 indicates the difference compared with vehicle group; **p < 0.01 indicates the difference compared with vehicle group. (C) The viability of H9C2 cells was measured via MTT assay. **p < 0.01 indicates the difference compared with control group; #p < 0.05 indicates the difference compared with OGD (2 h)/R (6 h) + BAC (0 μM) group; ##p < 0.01 indicates the difference compared with OGD (2 h)/R (6 h) + BAC (0 μM) group. (D) The LDH level was detected using the commercial kit. ***p < 0.001 indicates the difference compared with control group; #p < 0.05 indicates the difference compared with OGD (2 h)/R (6 h) + BAC (0 μM) group; ###p < 0.001 indicates the difference compared with OGD (2 h)/R (6 h) + BAC (0 μM) group. (E, F) The apoptosis of H9C2 cells was tested by flow cytometry through Annexin V-FITC/PI double labeling. ***p < 0.001 indicates the difference compared with control group; #p < 0.05 indicates the difference compared with OGD (2 h)/R (6 h) + BAC (0 μM) group; ###p < 0.001 indicates the difference compared with OGD (2 h)/R (6 h) + BAC (0 μM) group. BAC, benzoylaconine; OGD (2 h)/R (6 h), oxygen-glucose deprivation (2 h) and reperfusion (6 h); MTT, 3-(4, 5-dimethylthiazol-2-yl)-2,5-diphenyltetrazolium bromide; LDH, lactate dehydrogenase; PI, propidium iodide.
|
BAC improved mitochondrial function in OGD/R-treated H9C2 cells
 | Fig. 2BAC improved mitochondrial function in OGD/R-treated H9C2 cells.(A, B) JC-1 fluorescence assay was employed for measuring the mitochondrial membrane potential (scale bar = 50 μm). ***p < 0.001 indicates the difference compared with control group; #p < 0.05 indicates the difference compared with OGD (2 h)/R (6 h) + BAC (0 μM) group; ###p < 0.001 indicates the difference compared with OGD (2 h)/R (6 h) + BAC (0 μM) group. (C, D) The ROS and ATP production were detected through using respective detection kits. ***p < 0.001 indicates the difference compared with control group; ##p < 0.01 indicates the difference compared with OGD (2 h)/R (6 h) + BAC (0 μM) group; ###p < 0.001 indicates the difference compared with OGD (2 h)/R (6 h) + BAC (0 μM) group. BAC, benzoylaconine; OGD (2 h)/R (6 h), oxygen-glucose deprivation (2 h) and reperfusion (6 h); ROS, reactive oxygen species; ATP, adenosine triphosphate; LDH, lactate dehydrogenase.
|
BAC suppressed oxidative stress in OGD/R-treated H9C2 cells
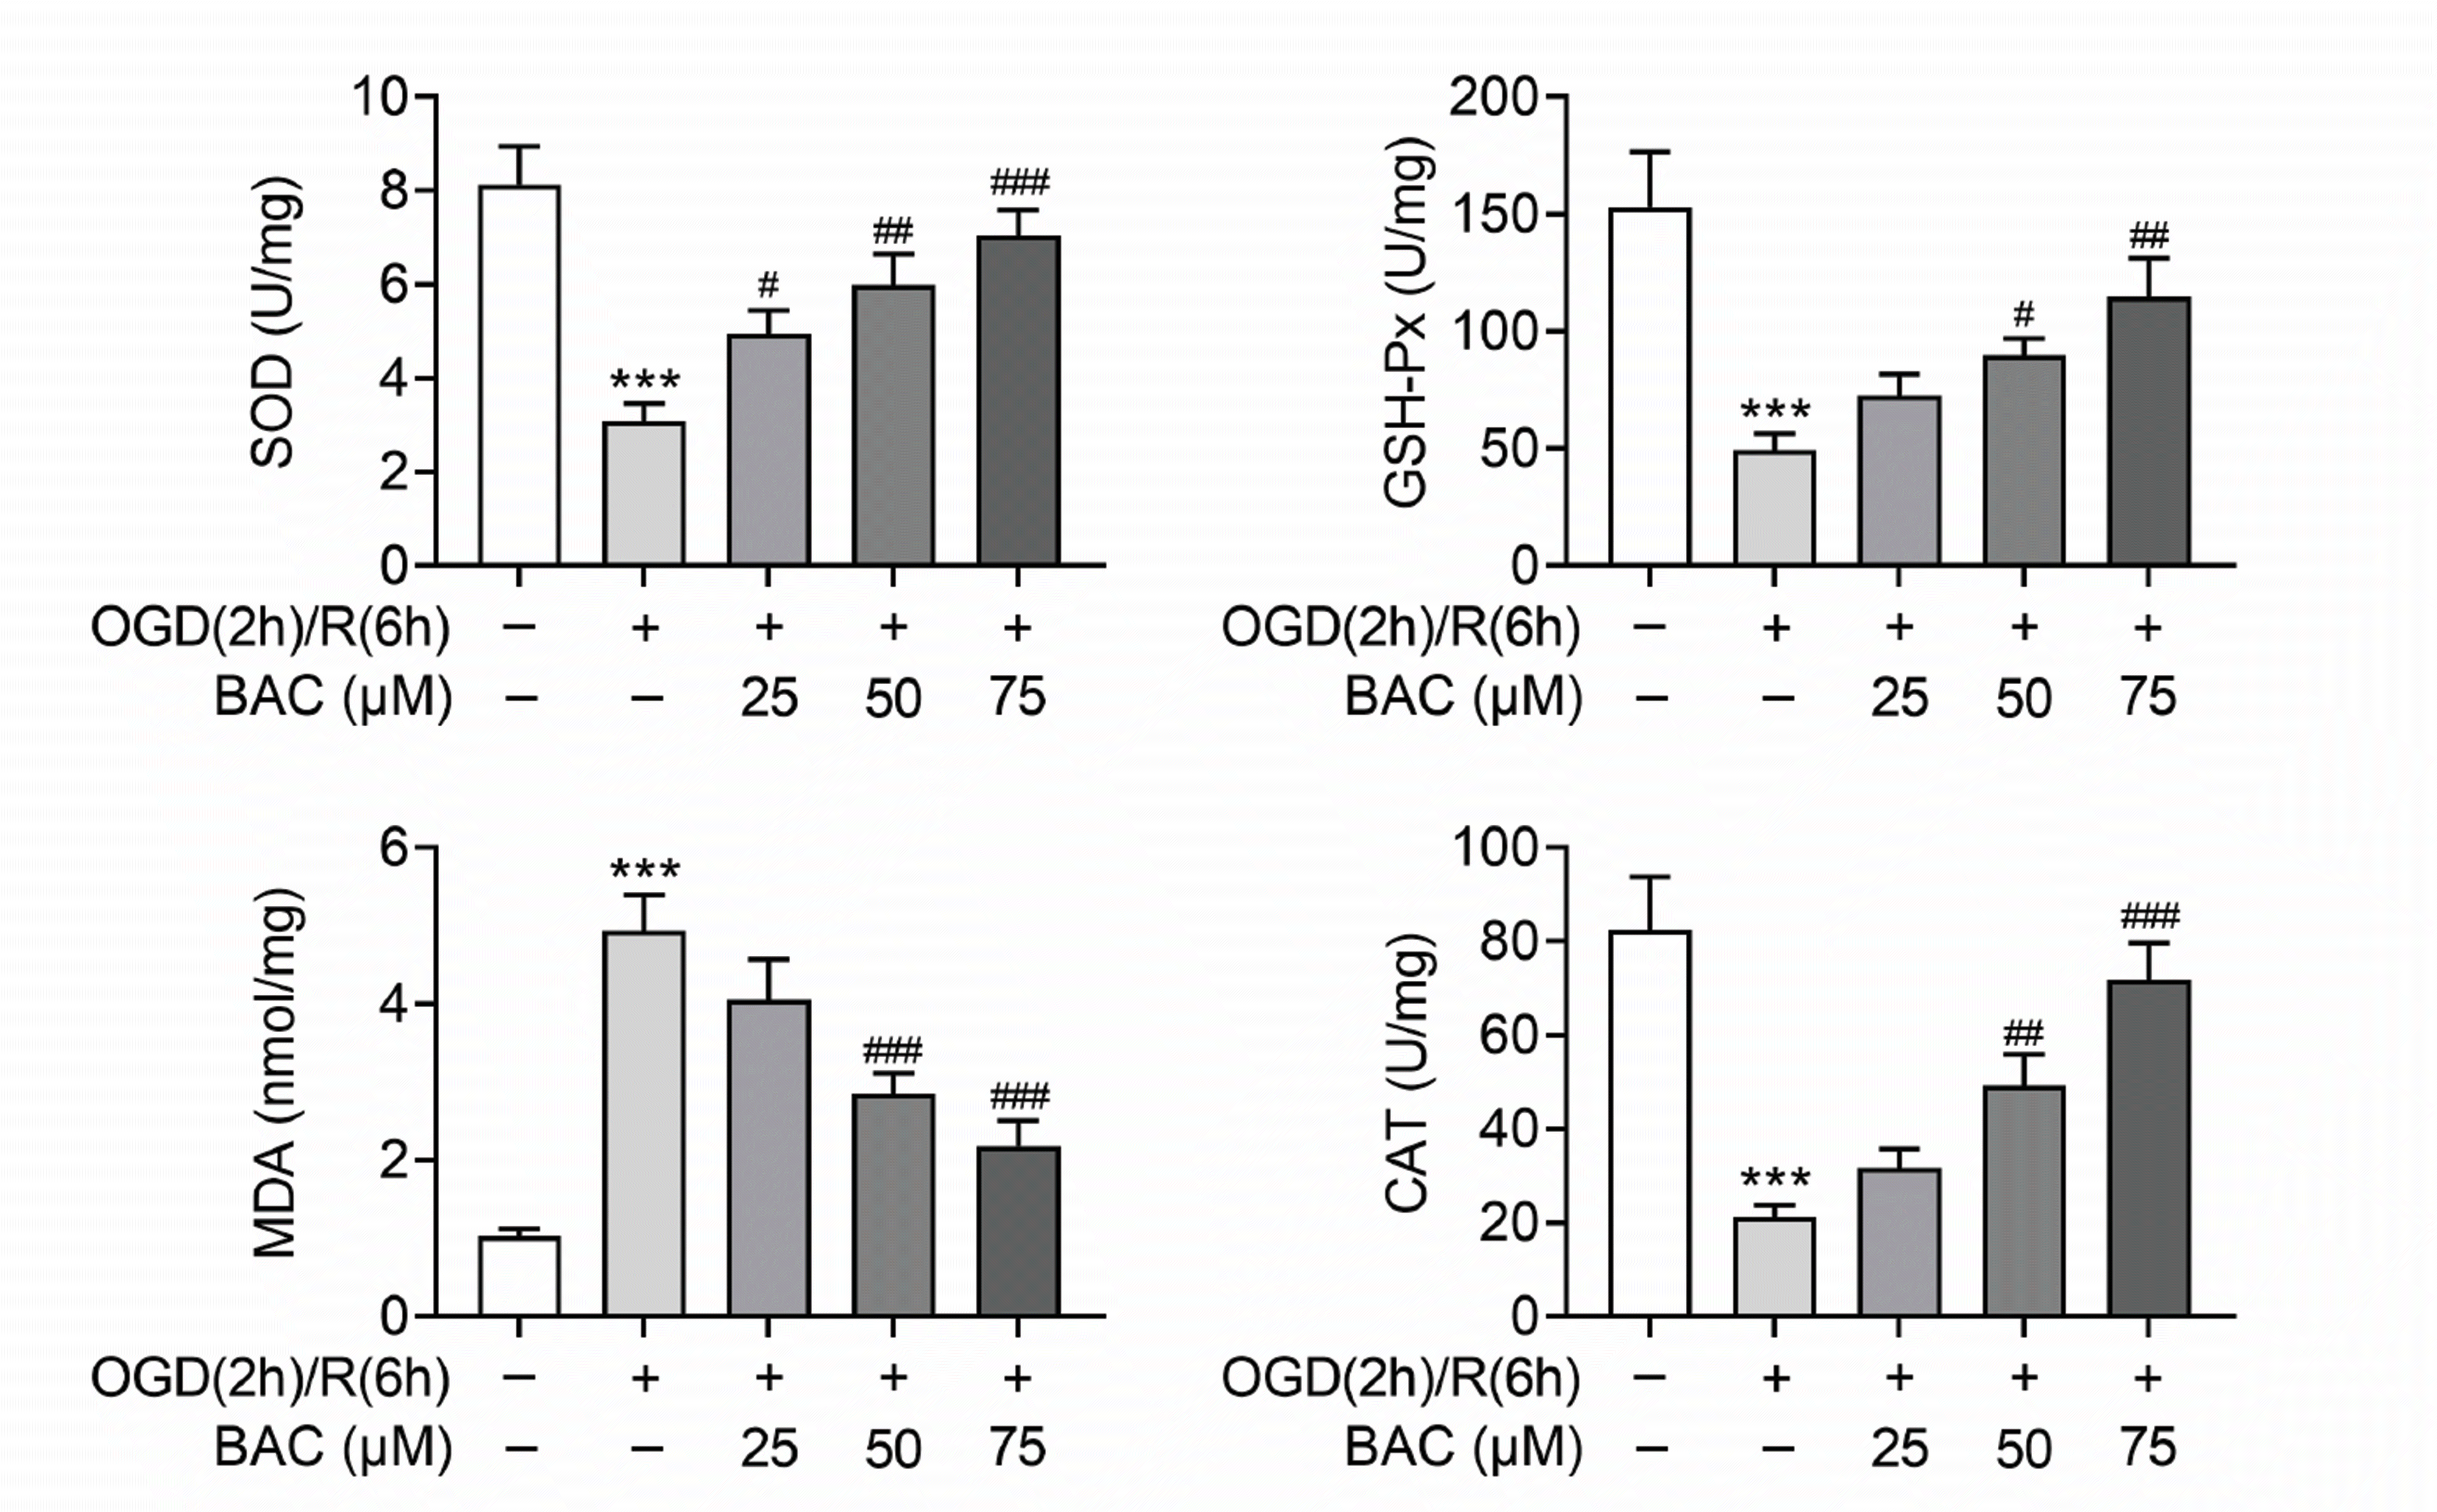 | Fig. 3BAC suppressed oxidative stress in OGD/R-treated H9C2 cells.The concentration of SOD, GSH-Px, MDA and CAT was tested via ELISA. ***p < 0.001 indicates the difference compared with control group; #p < 0.05 indicates the difference compared with OGD (2 h)/R (6 h) + BAC (0 μM) group; ##p < 0.01 indicates the difference compared with OGD (2 h)/R (6 h) + BAC (0 μM) group; ###p < 0.001 indicates the difference compared with OGD (2 h)/R (6 h) + BAC (0 μM) group. BAC, benzoylaconine; OGD (2 h)/R (6 h), oxygen-glucose deprivation (2 h) and reperfusion (6 h); SOD, superoxide dismutase; GSH-Px, glutathione peroxidase; MDA, malondialdehyde; CAT, catalase.
|
BAC activated AMPK/PGC-1 axis in OGD/R-treated H9C2 cells
 | Fig. 4BAC activated AMPK/PGC-1 axis in OGD/R-treated H9C2 cells.Western blot analysis was utilized for evaluating the protein levels of AMPK, p-AMPK, and PGC-1α. ***p < 0.001 indicates the difference compared with control group; #p < 0.05 indicates the difference compared with OGD (2 h)/R (6 h) + BAC (0 μM) group; ###p < 0.001 indicates the difference compared with OGD (2 h)/R (6 h) + BAC (0 μM) group. BAC, benzoylaconine; OGD (2 h)/R (6 h), oxygen-glucose deprivation (2 h) and reperfusion (6 h); SOD, superoxide dismutase.
|
AMPK attenuation reversed the protective effect of BAC on OGD/R-treated cardiomyocytes
 | Fig. 5AMPK attenuation reversed BAC-mediated protective effect on OGD/R-treated cardiomyocytes.(A) The viability of H9C2 cells was assessed via MTT assay. ***p < 0.001 indicates the difference compared with control group; ##p < 0.01 indicates the difference compared with OGD (2 h)/R (6 h) + BAC (0 μM) group; &&p < 0.01 indicates the difference compared with OGD (2 h)/R (6 h) + BAC (75 μM) group. (B) The mitochondrial membrane potential was detected by JC-1 fluorescence assay (scale bar = 50 μm). ***p < 0.001 indicates the difference compared with control group; ###p < 0.001 indicates the difference compared with OGD (2 h)/R (6 h) + BAC (0 μM) group; &&&p < 0.001 indicates the difference compared with OGD (2 h)/R (6 h) + BAC (75 μM) group. (C, D) The ROS and ATP production were measured using respective detection kits. ***p < 0.001 indicates the difference compared with control group; ###p < 0.001 indicates the difference compared with OGD (2 h)/R (6 h) + BAC (0 μM) group; &&&p < 0.001 indicates the difference compared with OGD (2 h)/R (6 h) + BAC (75 μM) group. BAC, benzoylaconine; OGD (2 h)/R (6 h), oxygen-glucose deprivation (2 h) and reperfusion (6 h); CC, compound C; MTT, 3-(4, 5-dimethylthiazol-2-yl)-2,5-diphenyltetrazolium bromide; ROS, reactive oxygen species; ATP, adenosine triphosphate.
|
BAC alleviated myocardial injury in vivo
 | Fig. 6BAC alleviated myocardial injury in vivo.(A) The heart infarct size was evaluated by TTC staining. ***p < 0.001 indicates the difference compared with sham group; ###p < 0.001 indicates the difference compared with ischemia reperfusion (IR) group. (B, C) The LDH and ROS levels were measured through the corresponding commercial kits. ***p < 0.001 indicates the difference compared with sham group; ###p < 0.001 indicates the difference compared with IR group. (D) The protein expression of p-AMPK, AMPK, and PGC-1α in heart tissues was assessed through Western blot. ***p < 0.001 indicates the difference compared with sham group; ###p < 0.001 indicates the difference compared with IR group. BAC, benzoylaconine; TTC, 2,3,5-triphenyltetrazolium chloride; LDH, lactate dehydrogenase; ROS, reactive oxygen species.
|


 PDF
PDF Citation
 Print
Print


 XML Download