Journal List > Ann Lab Med > v.43(1) > 1516079943

Hong, Gu, Lee, Lee, Chun, Han, and Min: Intuitive Modification of the Friedewald Formula for Calculation of LDL-Cholesterol

Abstract

Background

High LDL-cholesterol (LDL-C) is an established risk factor for cardiovascular disease and is considered an important therapeutic target. It can be measured directly or calculated from the results of other lipid tests. The Friedewald formula is the most widely used formula for calculating LDL-C. We modified the Friedewald formula for a more accurate and practical estimation of LDL-C.

Methods

Datasets, including measured triglyceride, total cholesterol, HDL-cholesterol, and LDL-C concentrations were collected and assigned to derivation and validation sets. The datasets were further divided into five groups based on triglyceride concentrations. In the modified formula, LDL-C was defined as total cholesterol − HDL-cholesterol − (triglyceride/adjustment factor). For each group, the adjustment factor that minimized the difference between measured LDL-C and calculated LDL-C using modified formula was obtained. For validation, measured LDL-C and LDL-C calculated using the modified formula (LDL-CM), Friedewald formula (LDL-CF), Martin-Hopkins formula (LDL-CMa), and Sampson formula (LDL-CS) were compared.

Results

In the derivation set, the adjustment factors were 4.7, 5.9, 6.3, and 6.4 for the groups with triglyceride concentrations <100, 101–200, 201–300, and >300 mg/dL, respectively. In the validation set, the coefficient of determination (R2) between measured and calculated LDL-C was higher for LDL-CM than for LDL-CF (R2=0.9330 vs. 0.9206). The agreement according to the National Cholesterol Education Program Adult Treatment Panel III classification of LDL-C was 86.36%, 86.08%, 86.82%, and 86.15% for LDL-CM, LDL-CF, LDL-CMa, and LDL-CS, respectively.

Conclusions

We proposed a practical, improved LDL-C calculation formula by applying different factors depending on the triglyceride concentration.

INTRODUCTION

High concentrations of low density lipoprotein cholesterol (LDL-C) is associated with atherosclerotic cardiovascular disease (ASCVD), along with low levels of high density lipoprotein cholesterol (HDL-C) [1-3]. The accumulation of LDL-C in the subendothelial space is involved in the early pathogenesis of atherosclerosis [4, 5]. As a dominant form of atherogenic cholesterol, high serum LDL-C is a risk factor for ASCVD [6-8]. Lowering LDL-C through statin therapy has shown improved outcomes in multiple randomized trials [9]. Therefore, various current guidelines recommend measuring LDL-C for the risk assessment of ASCVD and monitoring of LDL-C-lowering therapies involving statin administration [1, 10].
At present, the reference procedure for measuring LDL-C is ultracentrifugation [11]. However, this method involves a complex process and cannot be fully automated. Therefore, many clinical laboratories directly measure LDL-C using homogeneous assays and automated analyzers [12, 13]. Homogeneous assays contain detergents or other components that selectively block or solubilize specific classes of lipoproteins and enable the specific measurement of LDL-C. However, homogeneous assays have variable analytical performance and show discordant results, especially at low LDL-C concentrations [14].
Despite the introduction of homogeneous LDL-C assays, many institutions worldwide still obtain LDL-C concentrations through calculations [15]. Since the introduction of the Friedewald formula, which estimates LDL-C from total cholesterol, triglycerides, and HDL-C, in 1972, LDL-C calculation methods have been used [16]. The Friedewald formula was originally developed for use in epidemiological studies, and it has been widely adopted in clinical laboratories for economic reasons [12]. Several attempts have been made to improve the Friedewald formula [17-20]. In 2013, Martin, et al. [21] published a novel calculation formula using 180 combinations of triglycerides:very-low density lipoprotein cholesterol (VLDL-C) ratio. Sampson, et al. [22] proposed a new formula applicable to up to 800 mg/dL of triglycerides. However, these formulas are not as widely used as the Friedewald formula. We derived a modified LDL-C calculation formula based on the Friedewald formula in a relatively simple manner to establish a more accurate and practical LDL-C calculation method for application in clinical laboratories.

MATERIALS AND METHODS

Data collection

We collected 140,482 test results of outpatients who underwent lipid testing between March 2021 and July 2021 at a tertiary care hospital retrospectively. Each dataset consisted of total cholesterol, HDL-C, LDL-C, and triglyceride concentrations measured simultaneously from each sample. Total cholesterol, HDL-C, LDL-C, and triglycerides were measured using the AU5800 Clinical Chemistry System (Beckman Coulter, Brea, CA, USA) and its dedicated enzymatic assay reagents. The test principles were the enzymatic cholesterol oxidase-peroxidase method for total cholesterol measurement, enzymatic colorimetric method based on the polyanion-polymer detergent method [23] for HDL-C measurement, enzymatic colorimetric method based on the Daiichi method [24] for LDL-C measurement, and enzymatic glycerol phosphate oxidase-peroxidase method for triglyceride measurement. For each analyte, results outside the 1st and 99th percentiles were excluded from analysis. Cases in which the measured total cholesterol was less than the sum of measured HDL-C and LDL-C were also excluded from analysis. The collected datasets were divided into two groups. Results from March 2021 to May 2021 were regarded as the derivation set and those from June 2021 to July 2021 as the validation set. This study was approved by the Institutional Review Board (IRB) of Asan Medical Center, Seoul, Korea (IRB No.: 2022-0372).

Formula derivation

Datasets in the derivation set were divided into five groups based on triglyceride concentrations (0–100, 101–200, 201–300, 301–400, >400 mg/dL). Friedewald LDL-C (LDL-CF) was calculated as (total cholesterol)–(HDL-C)–(triglyceride/5) in mg/dL [16]. The novel modified formula estimated LDL-C (LDL-CM) as (total cholesterol)–(HDL-C)–(triglyceride/adjustment factor) in mg/dL. Numbers from 4.0 to 6.5 with one decimal place were applied as adjustment factors. For each dataset, LDL-CM was calculated using adjustment factor values ranging between 4.0 and 6.5 and LDL-CF was also calculated. To determine the optimal adjustment factor value for each triglyceride concentration group, the mean of the difference between LDL-CM and measured LDL-C was calculated for each factor value and each triglyceride concentration group.

Formula validation

LDL-CF and LDL-CM were calculated from the datasets in the validation set in the same manner as in the derivation set. Among the datasets assigned to the validation set, cases with a triglyceride concentration >400 mg/dL were excluded from the analysis. To verify the performance of the calculation formula using the optimal adjustment factor obtained from the derivations set, the coefficient of determination (R2) between measured LDL-C and LDL-CM using the adjustment factor was obtained and compared with that of LDL-CF, LDL-C calculated using the Martin-Hopkins formula (LDL-CMa) [21], and LDL-C calculated using the Sampson formula (LDL-CS) [22]. To estimate the agreement rate, measured LDL-C, LDL-CF, LDL-CM calculated using the adjustment factor obtained from the derivation set, LDL-CMa and LDL-CS were classified according to the U.S. National Cholesterol Education Program Adult Treatment Panel III (NCEP-ATP III) guidelines [25]. In the NCEP-ATP III classification, LDL-C<100 mg/dL is defined as optimal, 100–129 mg/dL as near optimal, 130–159 mg/dL as borderline high, 160–189 mg/dL as high, and >190 mg/dL as very high [25]. ATP III classification agreement between measured LDL-C and LDL-CM, LDL-CF, LDL-CMa, and LDL-CS was determined (Fig. 1). For cases with LDL-C≤100 mg/dL, additional analysis was conducted by applying the 2019 European Society of Cardiology (ESC) and European Atherosclerosis Society (EAS) guidelines, which divide LDL-C treatment goals into ≤55, 70, 100, and 116 mg/dL [10].

Statistical analysis

Microsoft Excel (Microsoft, Redmond, WA, USA) and GraphPad Prism version 9 for Windows (GraphPad Software, San Diego, CA, USA) were used for statistical analysis.

RESULTS

Data collection

In total, 140,482 datasets were obtained. Table 1 shows the means, medians, and ranges of total cholesterol, HDL-C, LDL-C, and triglycerides in the datasets. We assigned 76,508 datasets to the derivation set and 54,481 datasets to the validation set.

Formula derivation

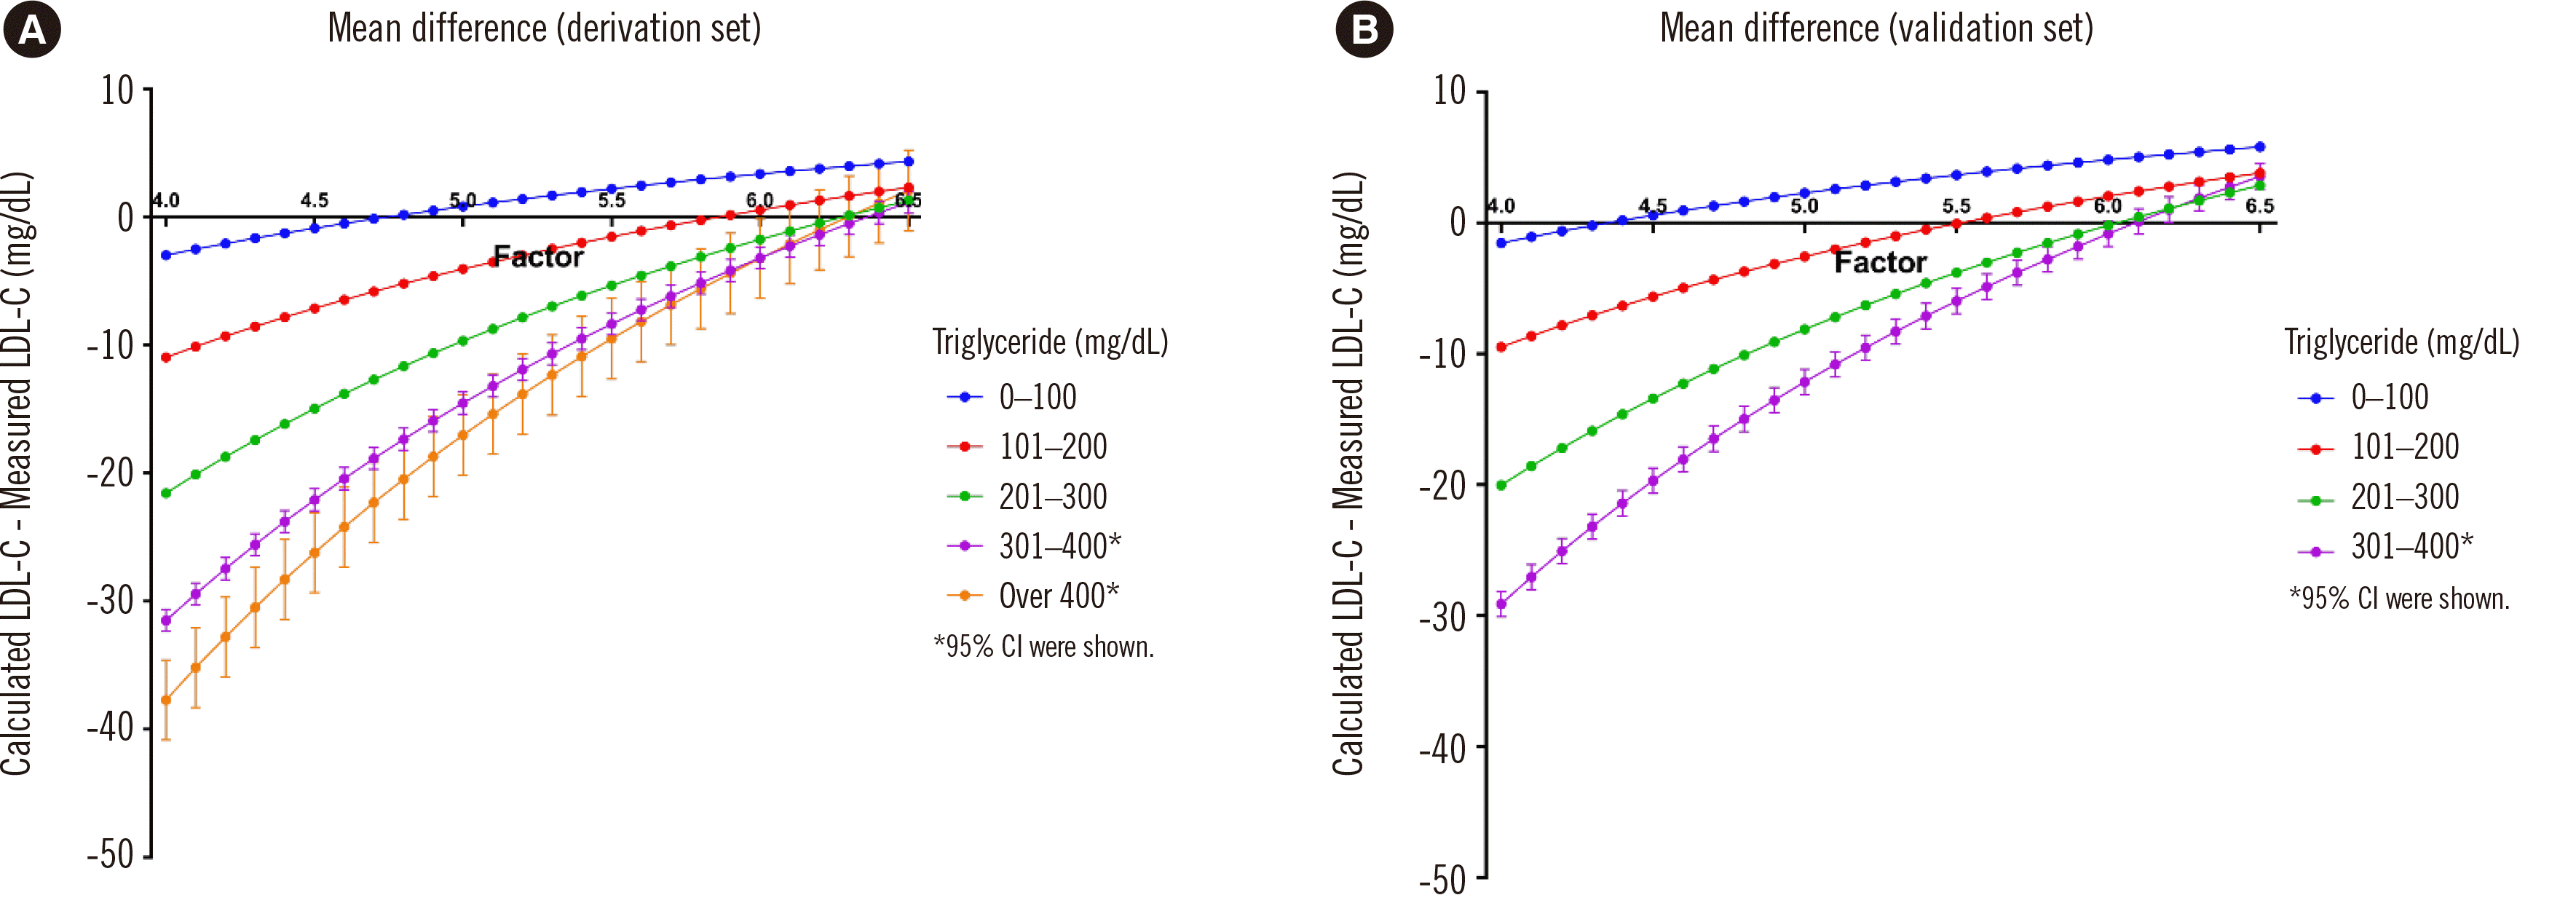
Fig. 2A shows the mean difference between measured LDL-C and LDL-CM for each adjustment factor value and each triglyceride concentration group in the derivation set. The adjustment factor value, in which the mean difference between LDL-C and LDL-CM was the smallest, was 4.7 for the <100 mg/dL triglyceride concentration group, 5.9 for the 101–200 mg/dL triglyceride concentration group, 6.3 for the 201–300 mg/dL triglyceride concentration group, and 6.4 for the 301–400 mg/dL triglyceride concentration group. When the factors minimizing the mean difference were applied, the 95% confidence intervals of the mean differences were (–0.224, –0.067), (0.068, 0.253), (–0.173, 0.446), and (–0.522, 1.190) for the < 100, 101–200, 201–300, and 301–400 mg/dL groups, respectively.

Formula validation

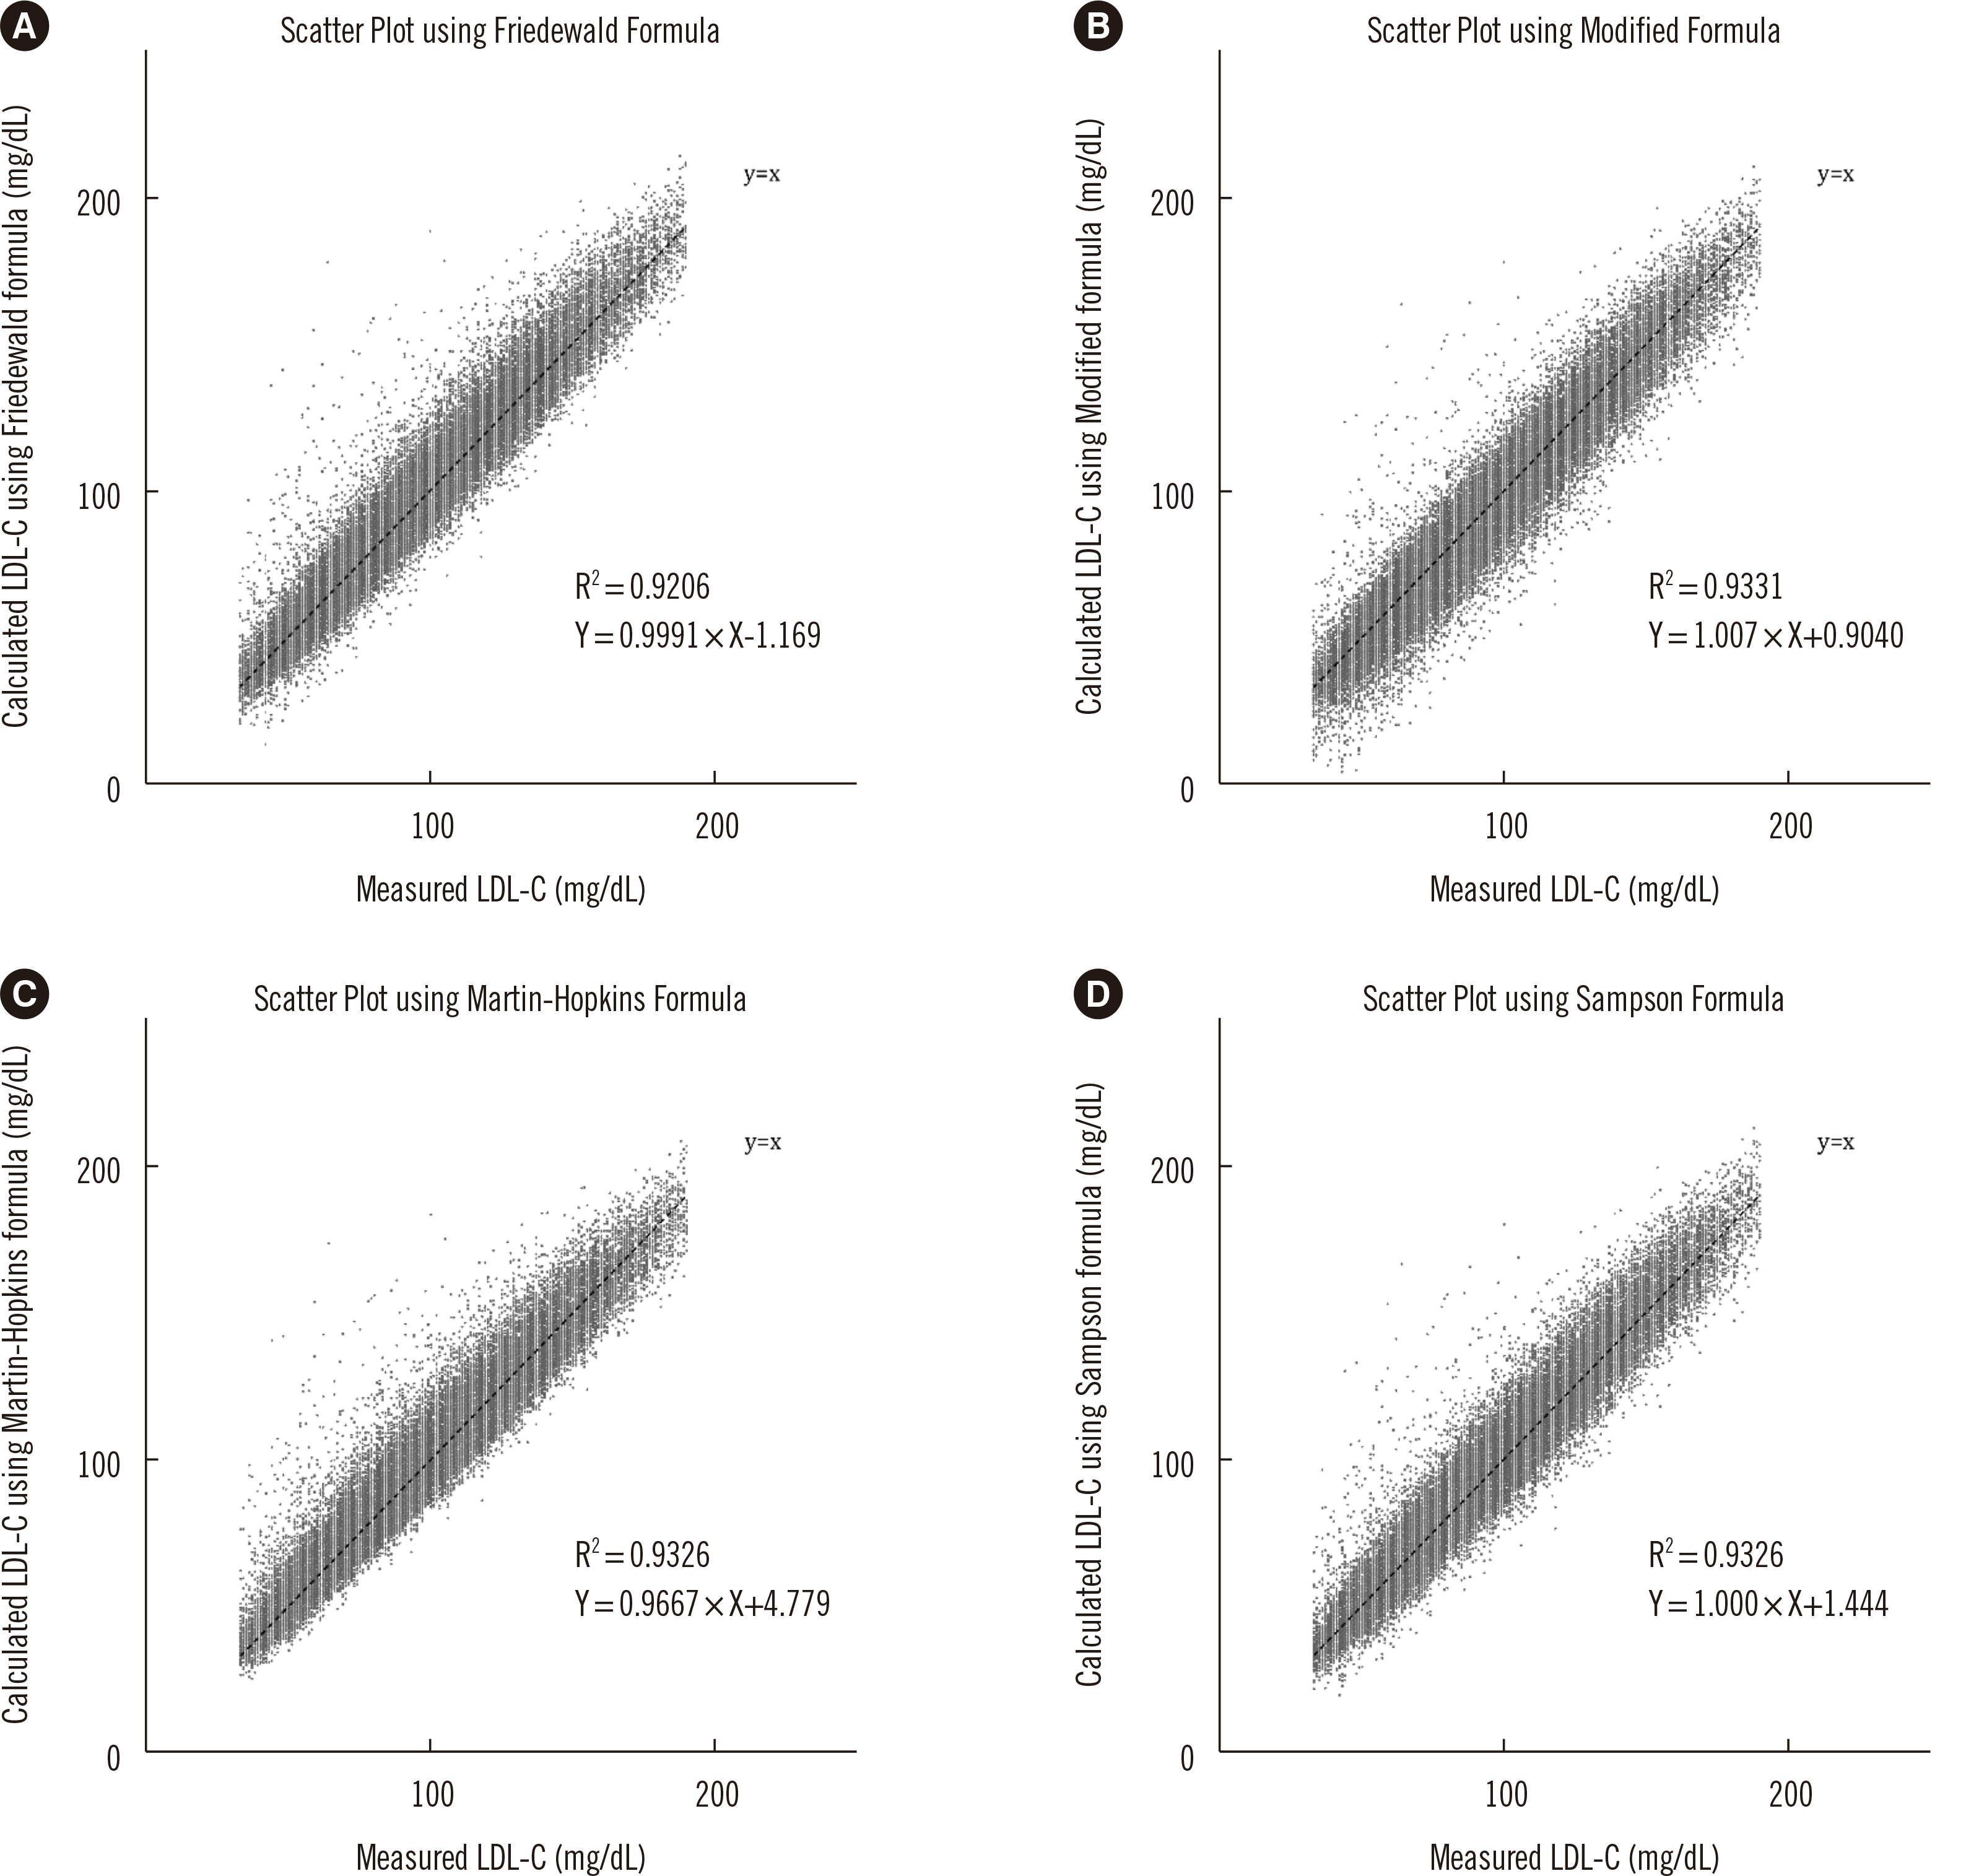
Fig. 2B shows the mean difference between measured LDL-C and LDL-CM for each factor value and each triglyceride concentration group in the validation set. LDL-CM of the validation set was calculated by applying the determined adjustment factor value obtained from the derivation set to the validation set. Calculated LDL-CM, LDL-CF, LDL-CMa, LDL-CS were compared with measured LDL-C (Fig. 3). The coefficient of determination was higher for LDL-CM (R2=0.9330) than for LDL-CF (R2=0.9206), LDL-CMa (R2=0.9325), and LDL-CS (R2=0.9326). The mean absolute difference from the measured value was 6.46, 7.15, 6.21, 6.52 mg/dL for LDL-CM, LDL-CF, LDL-CMa, LDL-CS, respectively.
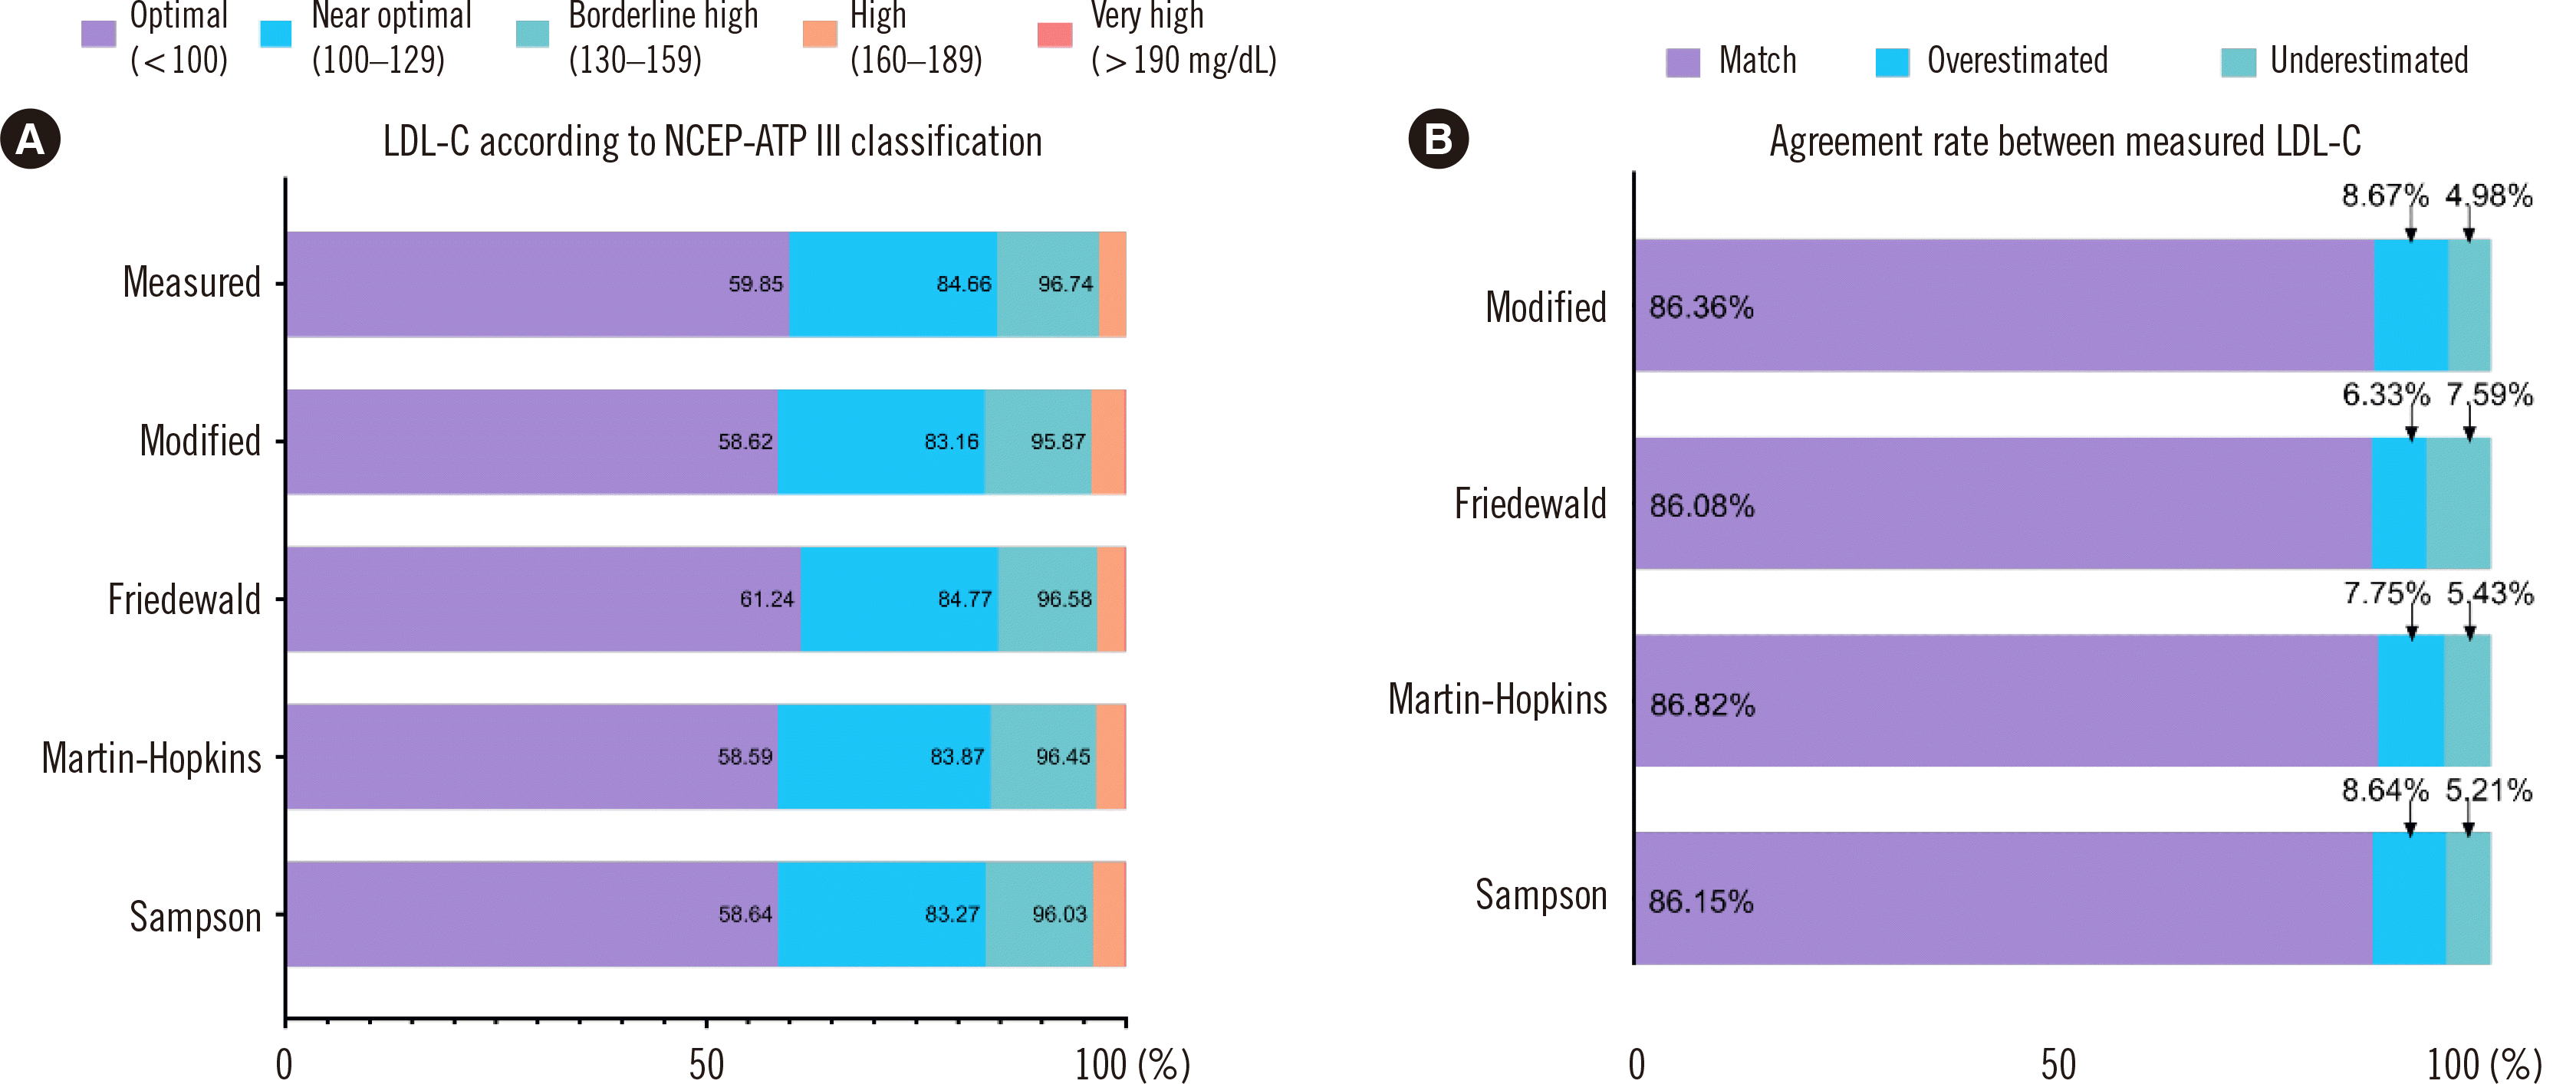
Measured LDL-C, LDL-CM, LDL-CF, LDL-CMa, and LDL-CS were classified according to the ATP III classification [25], and the number of cases belonging to each group were counted (Fig. 4). Fig. 4 shows the agreement between measured LDL-C and LDL-CM, LDL-CF, LDL-CMa, and LDL-CS for all cases. When calculated LDL-C values were classified according to the ATP III classification, the numbers of overestimated cases (i.e., belonging to a higher group) and underestimated cases (i.e., belonging to a lower group) compared with measured LDL-C were obtained. The agreement rate of LDL-CM (86.36%) using the determined adjustment factor was higher than that of LDL-CF (86.08%) and LDL-CS (86.15%), but lower than that of LDL-CMa (86.82%). For LDL-CF, there were more underestimated cases (N=4,126) than overestimated cases (N=3,444), while LDL-CM was associated with the highest number of overestimated cases (N=4,712) and the lowest number of underestimated cases (N=2,708) among the four methods.
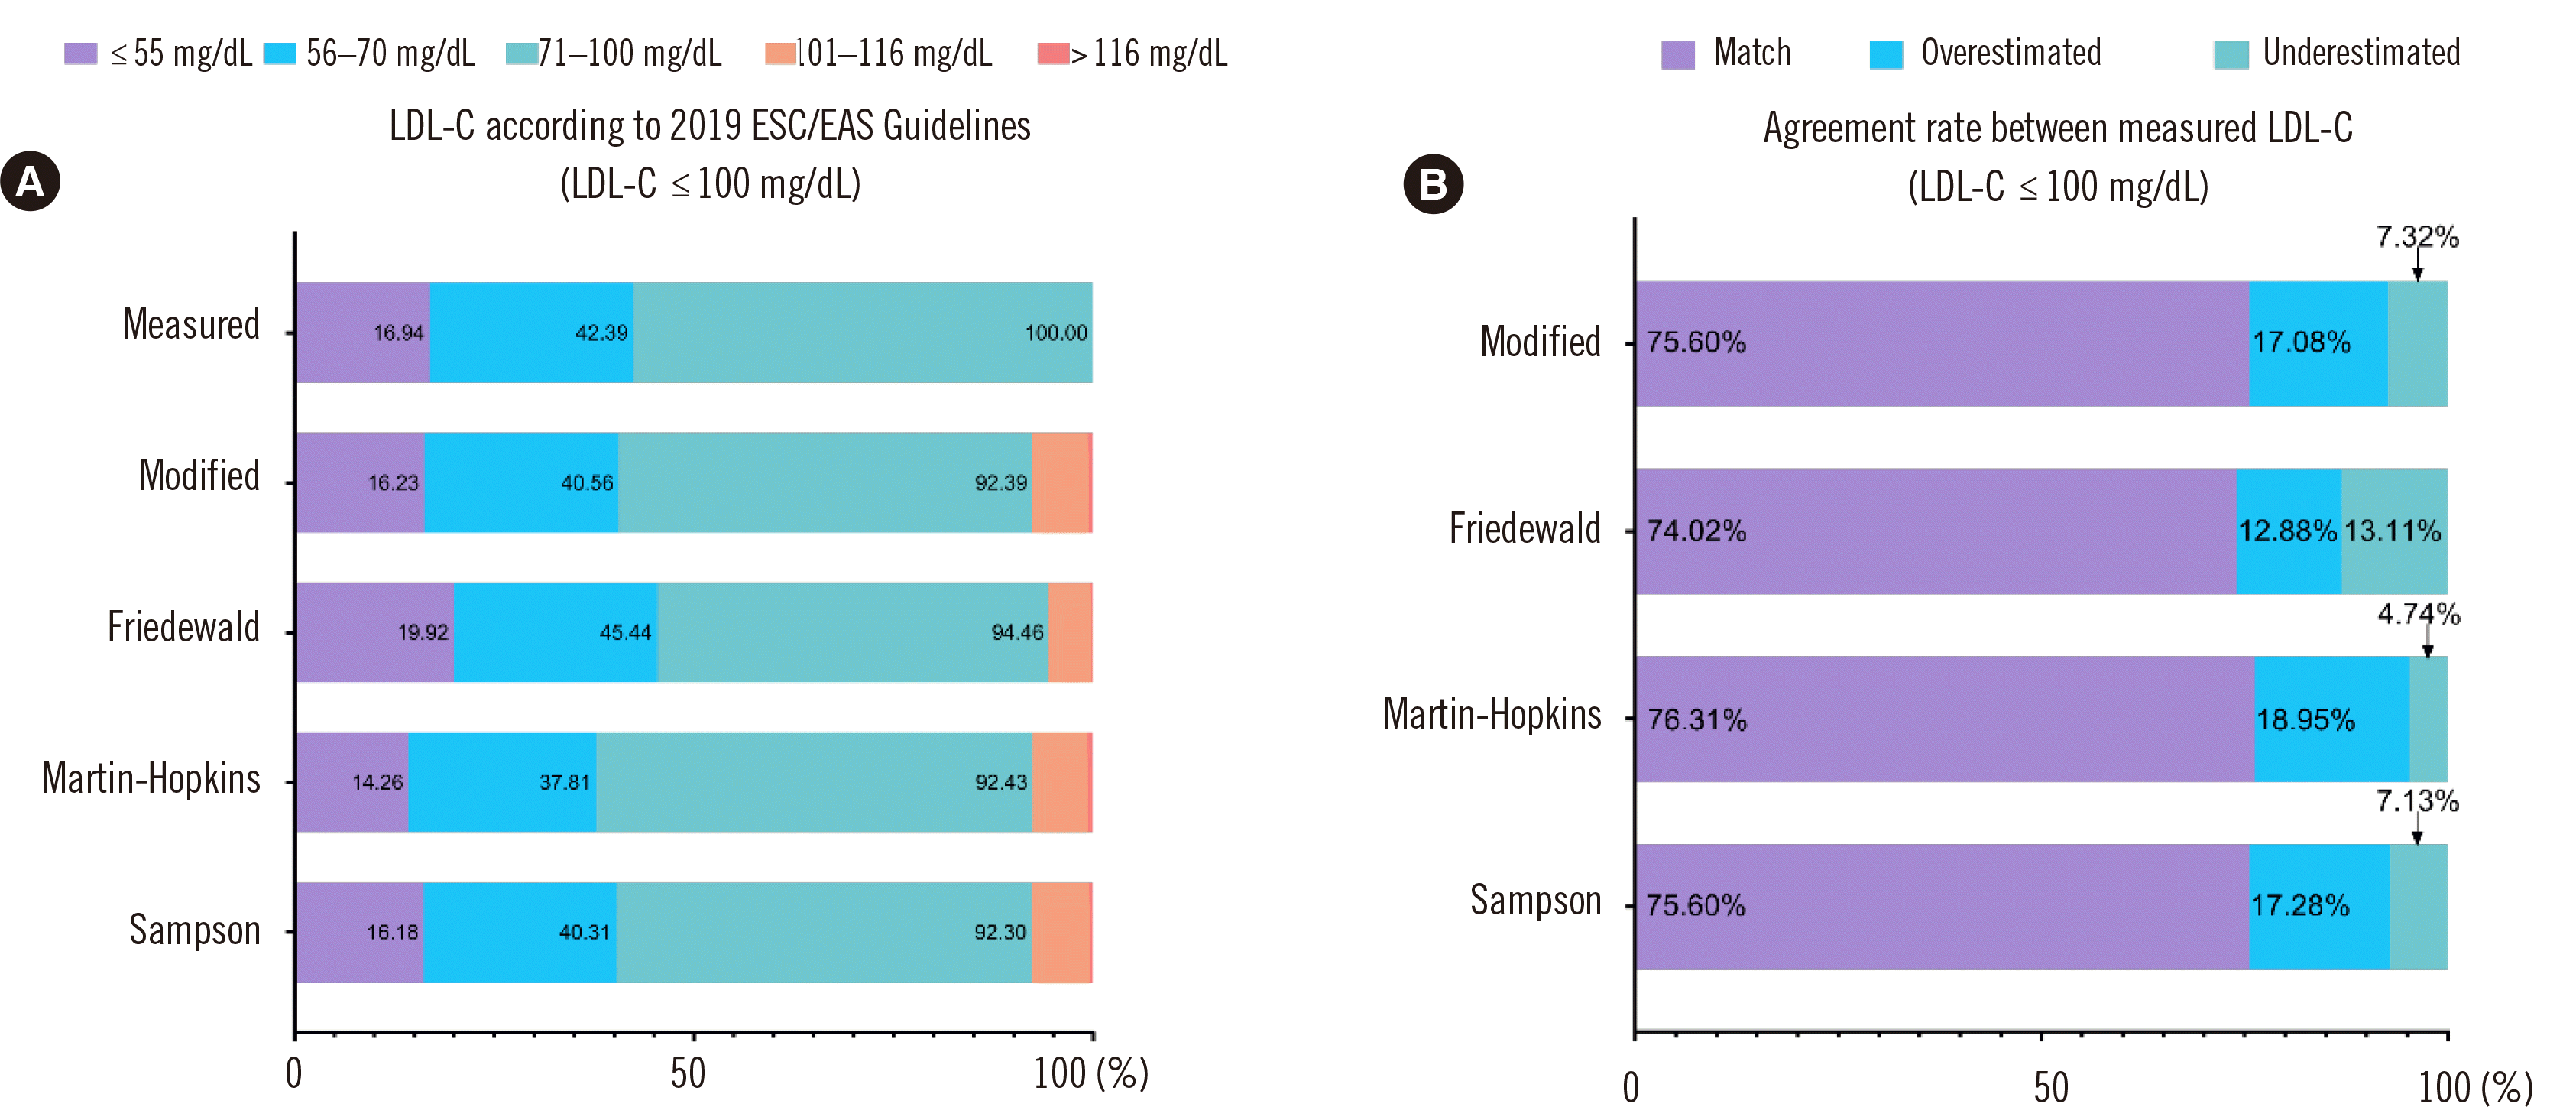
For cases with LDL-C ≤100 mg/dL, a separate analysis according to the 2019 ESC/EAS guidelines was conducted (Fig. 5). Among the four formulae, the Friedewald formula showed the strongest tendency to underestimate.

DISCUSSION

The Friedewald formula has been widely used for LDL-C estimation since its publication in 1972. In this formula, HDL-C and VLDL-C are subtracted from total cholesterol to calculate the LDL-C concentration. VLDL-C is obtained from the triglyceride:VLDL-C ratio. In the Friedewald formula, this ratio was set to 5 based on lipid measurements in 232 men and 216 women [16]. However, it has been reported that at LDL-C <70 mg/dL, the calculated results tend to be underestimated when compared with measured values. This tendency is particularly strong when triglyceride concentrations >150 mg/dL [26]. In addition, since there have been many changes since the creation of the Friedewald formula, including the introduction of a new LDL-C measurement method [12] and the establishment of the Cholesterol Reference Method Laboratory Network (CRMLN) to improve the standardization of cholesterol measurement [27], it is necessary to reevaluate the Friedewald formula.
In the modified formula evaluated in this study, at triglyceride concentrations >100 mg/dL, a triglyceride:VLDL-C ratio >5 was used to reduce the underestimation of calculated LDL-C. The LDL-C concentration is important for treatment decisions, such as risk group selection, lifestyle modification, and statin therapy. If the calculated LDL-C concentration is lower than the actual concentration, a fraction of the population that requires treatment may be missed. By reducing the underestimation of LDL-C through the use of the modified formula, it is expected that the ASCVD risk can be better predicted.
In 2013, Martin, et al. [21] reported an equation that calculates LDL-C using different adjustment factors according to the triglyceride concentration. In the Martin-Hopkins study, datasets were divided into 180 groups according to triglyceride and non-HDL-C concentrations, and different factors were applied to each group. The Martin-Hopkins formula was derived from a sophisticated study in that it uses very fractionized adjustment factors derived using a very large datasets. Although it is believed that the formula has a great advantage in terms of accuracy of estimation, it is not easily applicable to laboratory information systems and clinical laboratories. Like Martin, et al. [21], we used a different adjustment factor for each group; however, we suggest a simpler modification to overcome the pitfalls of the Martin-Hopkins formula, using a relatively small number of factors derived from the data of the institution.
In this study, we attempted to adjust the triglyceride:VLDL-C ratio, and several LDL-C formulae were applied to actual patient data to determine whether the triglyceride:VLDL-C ratio of 5 used in the Friedewald formula is appropriate. The factor value (i.e., the triglyceride:VLDL-C ratio that minimalizes the mean difference between the calculated and measured LDL-C) obtained from the derivation set slightly differed from that obtained from the validation set. However, in both datasets, there was a similar tendency that it is appropriate to use adjustment factor value less than 5 at triglyceride concentrations <100 mg/dL and >5 at triglyceride concentrations >100 mg/dL.
The measured LDL-C concentrations used to derive the calculation formula in this study were not measured using ultracentrifugation, the gold standard for LDL-C measurement, but using a homogeneous assay routinely used in clinical laboratories. As the calibrators of the homogeneous assay used were manufactured to be traceable to the U.S. Centers for Disease Control and Prevention LDL-C reference method [28], the LDL-C concentrations measured using the assay seem to be appropriate for comparison. However, we cannot claim that the adjustment factor calculated in this study is an optimal value that can be used universally because changes in the lipid test during the data collection period may have affected the results. Different factors may have to be derived and used for each country, ethnicity, or laboratory. In addition, we used lipid test results obtained from a closed measurement system of one manufacturer. A previous study applying the Friedewald, Martin-Hopkins, and Sampson formulas to lipid data obtained from Abbott and Roche analyzers reported that the performance of the Martin-Hopkins formula was less affected by different reagents than the Sampson formula [29]. Further research is required to determine whether factors derived from data obtained using different measurement systems and test principles significantly differ.
One of the limitations of this study is that at triglyceride concentrations >400 mg/dL, the mean difference showed a very wide 95% confidence interval. Thus, at these concentrations, the calculation formula is not applicable. This problem has been also reported for the Friedewald formula [16]. Since calculated LDL-C may not be accurate in very lipemic samples, attention should be paid to lipid analysis in the case of lipemic samples identified through gross examination or based on the lipemia index. Direct measurement may also be inaccurate in lipemic samples [15]; therefore, in such cases, strict fasting and evaluation of other causes of lipemia are required.
For LDL-C concentrations <100 mg/dL, all four calculation formulae showed relatively poor performance. A study evaluating several homogeneous LDL-C assays reported that large differences between ultracentrifugation results and homogeneous assay results were particularly frequent at lower LDL-C concentrations [14]. As the measured LDL-C concentrations used for comparison in this study were determined using a direct homogeneous assay, the reliability of the measured values may be somewhat insufficient at low LDL-C concentrations, which is another limitation of this study. Since strict LDL-C control to as low as 70 mg/dL is recommended for the prevention of ASCVD [1, 10], further efforts are needed to accurately evaluate low LDL-C concentrations in clinical samples.
In conclusion, we demonstrated the process of deriving a simple LDL-C calculation equation that improves accuracy. This study confirmed that the triglyceride:VLDL-C ratio, which is used in the equation to obtain accurate LDL-C values, differed from 5, the number used in the Friedewald formula. We recommend that clinical laboratories that calculate LDL-C values using calculation formulae to review the calculation formula they use and consider using improved calculation formulae, such as the one presented in this study.

ACKNOWLEDGMENTS

None.

Notes

AUTHOR CONTRIBUTIONS

Hong J and Lee W designed the study; Hong J analyzed the data and wrote the draft; Lee W conceived the study, analyzed the data, and finalized the draft; Lee J and Han KH were involved in data collection; Gu H discussed the data; Chun S and Min WK supervised the study and reviewed the manuscript. All authors read and approved the final manuscript.

CONFLICTS OF INTEREST

None declared.

RESEARCH FUNDING

None declared.

REFERENCES

1. Grundy SM, Stone NJ, Bailey AL, Beam C, Birtcher KK, Blumenthal RS, et al. 2019; 2018 AHA/ACC/AACVPR/AAPA/ABC/ACPM/ADA/AGS/APhA/ASPC/NLA/PCNA guideline on the management of blood cholesterol: a report of the American College of Cardiology/American Heart Association Task Force on Clinical Practice guidelines. Circulation. 139:e1082–143. DOI: 10.1161/CIR.0000000000000624. PMID: 30586774. PMCID: PMC7403606.
2. Yang HS, Hur M, Kim H, Kim SJ, Shin S, Somma SD, et al. 2020; HDL Subclass Analysis in Predicting Metabolic Syndrome in Koreans With High HDL Cholesterol Levels. Ann Lab Med. 40:297–305. DOI: 10.3343/alm.2020.40.4.297. PMID: 32067428. PMCID: PMC7054694.
crossref
3. Yang HS, Jeong HJ, Kim H, Hwang HK, Hur M, Lee S. 2022; Sex-Specific U-Shaped Relationships Between High-Density Lipoprotein Cholesterol Levels and 10-year Major Adverse Cardiovascular Events: A Nationwide Cohort Study of 5.7 Million South Koreans. Ann Lab Med. 42:415–27. DOI: 10.3343/alm.2022.42.4.415. PMID: 35177562. PMCID: PMC8859558.
crossref
4. Berliner JA, Navab M, Fogelman AM, Frank JS, Demer LL, Edwards PA, et al. 1995; Atherosclerosis: basic mechanisms. Oxidation, inflammation, and genetics. Circulation. 91:2488–96. DOI: 10.1161/01.CIR.91.9.2488. PMID: 7729036.
5. Navab M, Fogelman AM, Berliner JA, Territo MC, Demer LL, Frank JS, et al. 1995; Pathogenesis of atherosclerosis. Am J Cardiol. 76:18C–23C. DOI: 10.1016/S0002-9149(99)80466-4. PMID: 7572682.
crossref
6. Cholesterol Treatment Trialists' (CTT) Collaboration. 2010; Efficacy and safety of more intensive lowering of LDL cholesterol: a meta-analysis of data from 170,000 participants in 26 randomised trials. Lancet. 376:1670–81. DOI: 10.1016/S0140-6736(10)61350-5. PMID: 21067804. PMCID: PMC2988224.
7. Ference BA, Yoo W, Alesh I, Mahajan N, Mirowska KK, Mewada A, et al. 2012; Effect of long-term exposure to lower low-density lipoprotein cholesterol beginning early in life on the risk of coronary heart disease: a Mendelian randomization analysis. J Am Coll Cardiol. 60:2631–9. DOI: 10.1016/j.jacc.2012.09.017. PMID: 23083789.
8. Ference BA, Ginsberg HN, Graham I, Ray KK, Packard CJ, Bruckert E, et al. 2017; Low-density lipoproteins cause atherosclerotic cardiovascular disease. 1. Evidence from genetic, epidemiologic, and clinical studies. A consensus statement from the European Atherosclerosis Society Consensus Panel. Eur Heart J. 38:2459–72. DOI: 10.1093/eurheartj/ehx144. PMID: 28444290. PMCID: PMC5837225.
crossref
9. Baigent C, Keech A, Kearney PM, Blackwell L, Buck G, Pollicino C, et al. 2005; Efficacy and safety of cholesterol-lowering treatment: prospective meta-analysis of data from 90,056 participants in 14 randomised trials of statins. Lancet. 366:1267–78. DOI: 10.1016/S0140-6736(05)67394-1. PMID: 16214597.
crossref
10. Mach F, Baigent C, Catapano AL, Koskinas KC, Casula M, Badimon L, et al. 2020; ESC/EAS Guidelines for the management of dyslipidaemias: lipid modification to reduce cardiovascular risk. Eur Heart J. 41:111–88. DOI: 10.1093/eurheartj/ehz455. PMID: 31504418.
11. Rifai N, Warnick GR, Dominiczak MH. 2001. Handbook of Lipoprotein Testing. 2nd ed. AACC Press;Washington:
12. Nauck M, Warnick GR, Rifai N. 2002; Methods for measurement of LDL-cholesterol: a Critical assessment of direct measurement by homogeneous assays versus calculation. Clin Chem. 48:236–54. DOI: 10.1093/clinchem/48.2.236. PMID: 11805004.
crossref
13. Türkalp I, Cil Z, Ozkazanç D. 2005; Analytical performance of a direct assay for LDL-cholesterol: a comparative assessment versus Friedewald's formula. Anadolu Kardiyol Derg. 5:13–7. PMID: 15755695.
14. Miller WG, Myers GL, Sakurabayashi I, Bachmann LM, Caudill SP, Dziekonski A, et al. 2010; Seven direct methods for measuring HDL and LDL cholesterol compared with ultracentrifugation reference measurement procedures. Clin Chem. 56:977–86. DOI: 10.1373/clinchem.2009.142810. PMID: 20378768. PMCID: PMC4687457.
crossref
15. Vesper HW. 2018. Educational Discussion: Lipids, 2018 Accuracy-Based Lipids (ABL). https://documents.cap.org/documents/2018-lipid-b.pdf.
16. Friedewald WT, Levy RI, Fredrickson DS. 1972; Estimation of the concentration of low-density lipoprotein cholesterol in plasma, without use of the preparative ultracentrifuge. Clin Chem. 18:499–502. DOI: 10.1093/clinchem/18.6.499. PMID: 4337382.
crossref
17. Anandaraja S, Narang R, Godeswar R, Laksmy R, Talwar KK. 2005; Low-density lipoprotein cholesterol estimation by a new formula in Indian population. Int J Cardiol. 102:117–20. DOI: 10.1016/j.ijcard.2004.05.009. PMID: 15939107.
crossref
18. Hattori Y, Suzuki M, Tsushima M, Yoshida M, Tokunaga Y, Wang Y, et al. 1998; Development of approximate formula for LDL-chol, LDL-apo B and LDL-chol/LDL-apo B as indices of hyperapobetalipoproteinemia and small dense LDL. Atherosclerosis. 138:289–99. DOI: 10.1016/S0021-9150(98)00034-3. PMID: 9690912.
crossref
19. Puavilai W, Laorugpongse D, Deerochanawong C, Muthapongthavorn N, Srilert P. 2009; The accuracy in using modified Friedewald equation to calculate LDL from non-fast triglyceride: a pilot study. J Med Assoc Thai. 92:182–7. PMID: 19253792.
20. Hata Y, Nakajima K. 1986; Application of Friedewald's LDL-cholesterol estimation formula to serum lipids in the Japanese population. Jpn Circ J. 50:1191–200. DOI: 10.1253/jcj.50.1191. PMID: 3469420.
crossref
21. Martin SS, Blaha MJ, Elshazly MB, Toth PP, Kwiterovich PO, Blumenthal RS, et al. 2013; Comparison of a novel method vs the Friedewald equation for estimating low-density lipoprotein cholesterol levels from the standard lipid profile. JAMA. 310:2061–8. DOI: 10.1001/jama.2013.280532. PMID: 24240933. PMCID: PMC4226221.
crossref
22. Sampson M, Ling C, Sun Q, Harb R, Ashmaig M, Warnick R, et al. 2020; A new equation for calculation of low-density lipoprotein cholesterol in patients with normolipidemia and/or hypertriglyceridemia. JAMA Cardiol. 5:540–8. DOI: 10.1001/jamacardio.2020.0013. PMID: 32101259. PMCID: PMC7240357.
crossref
23. Arranz-Peña ML, Tasende-Mata J, Martin-Gil FJ. 1998; Comparison of two homogeneous assays with a precipitation method and an ultracentrifugation method for the measurement of HDL-cholesterol. Clin Chem. 44:2499–505. DOI: 10.1093/clinchem/44.12.2499. PMID: 9836717.
crossref
24. Iwasaki Y, Matsuyama H, Nakashima N. 2006; Improved specificity of a new homogeneous assay for LDL-cholesterol in serum with abnormal lipoproteins. Clin Chem. 52:886–8. DOI: 10.1373/clinchem.2005.053983. PMID: 16556687.
crossref
25. Expert Panel on Detection, Evaluation, and Treatment of High Blood Cholesterol in Adults. 2001; Executive summary of the third report of The National Cholesterol Education Program (NCEP) Expert Panel on Detection, Evaluation, and Treatment of High Blood Cholesterol In Adults (Adult Treatment Panel III). JAMA. 285:2486–97. DOI: 10.1001/jama.285.19.2486. PMID: 11368702.
26. Martin SS, Blaha MJ, Elshazly MB, Brinton EA, Toth PP, McEvoy JW, et al. 2013; Friedewald-estimated versus directly measured low-density lipoprotein cholesterol and treatment implications. J Am Coll Cardiol. 62:732–9. DOI: 10.1016/j.jacc.2013.01.079. PMID: 23524048.
crossref
27. Myers GL, Kimberly MM, Waymack PP, Smith SJ, Cooper GR, Sampson EJ. 2000; A reference method laboratory network for cholesterol: a model for standardization and improvement of clinical laboratory measurements. Clin Chem. 46:1762–72. DOI: 10.1093/clinchem/46.11.1762. PMID: 11067811.
crossref
28. Beckman Coulter. LDL-cholesterol calibrator Instructions for Use BLODC0012.04. 2016. DOI: 10.1093/clinchem/46.11.1762.
29. Rossouw HM, Nagel SE, Pillay TS. 2021; Comparability of 11 different equations for estimating LDL cholesterol on different analysers. Clin Chem Lab Med. 59:1930–43. DOI: 10.1515/cclm-2021-0747. PMID: 34384146.
crossref

Fig. 1
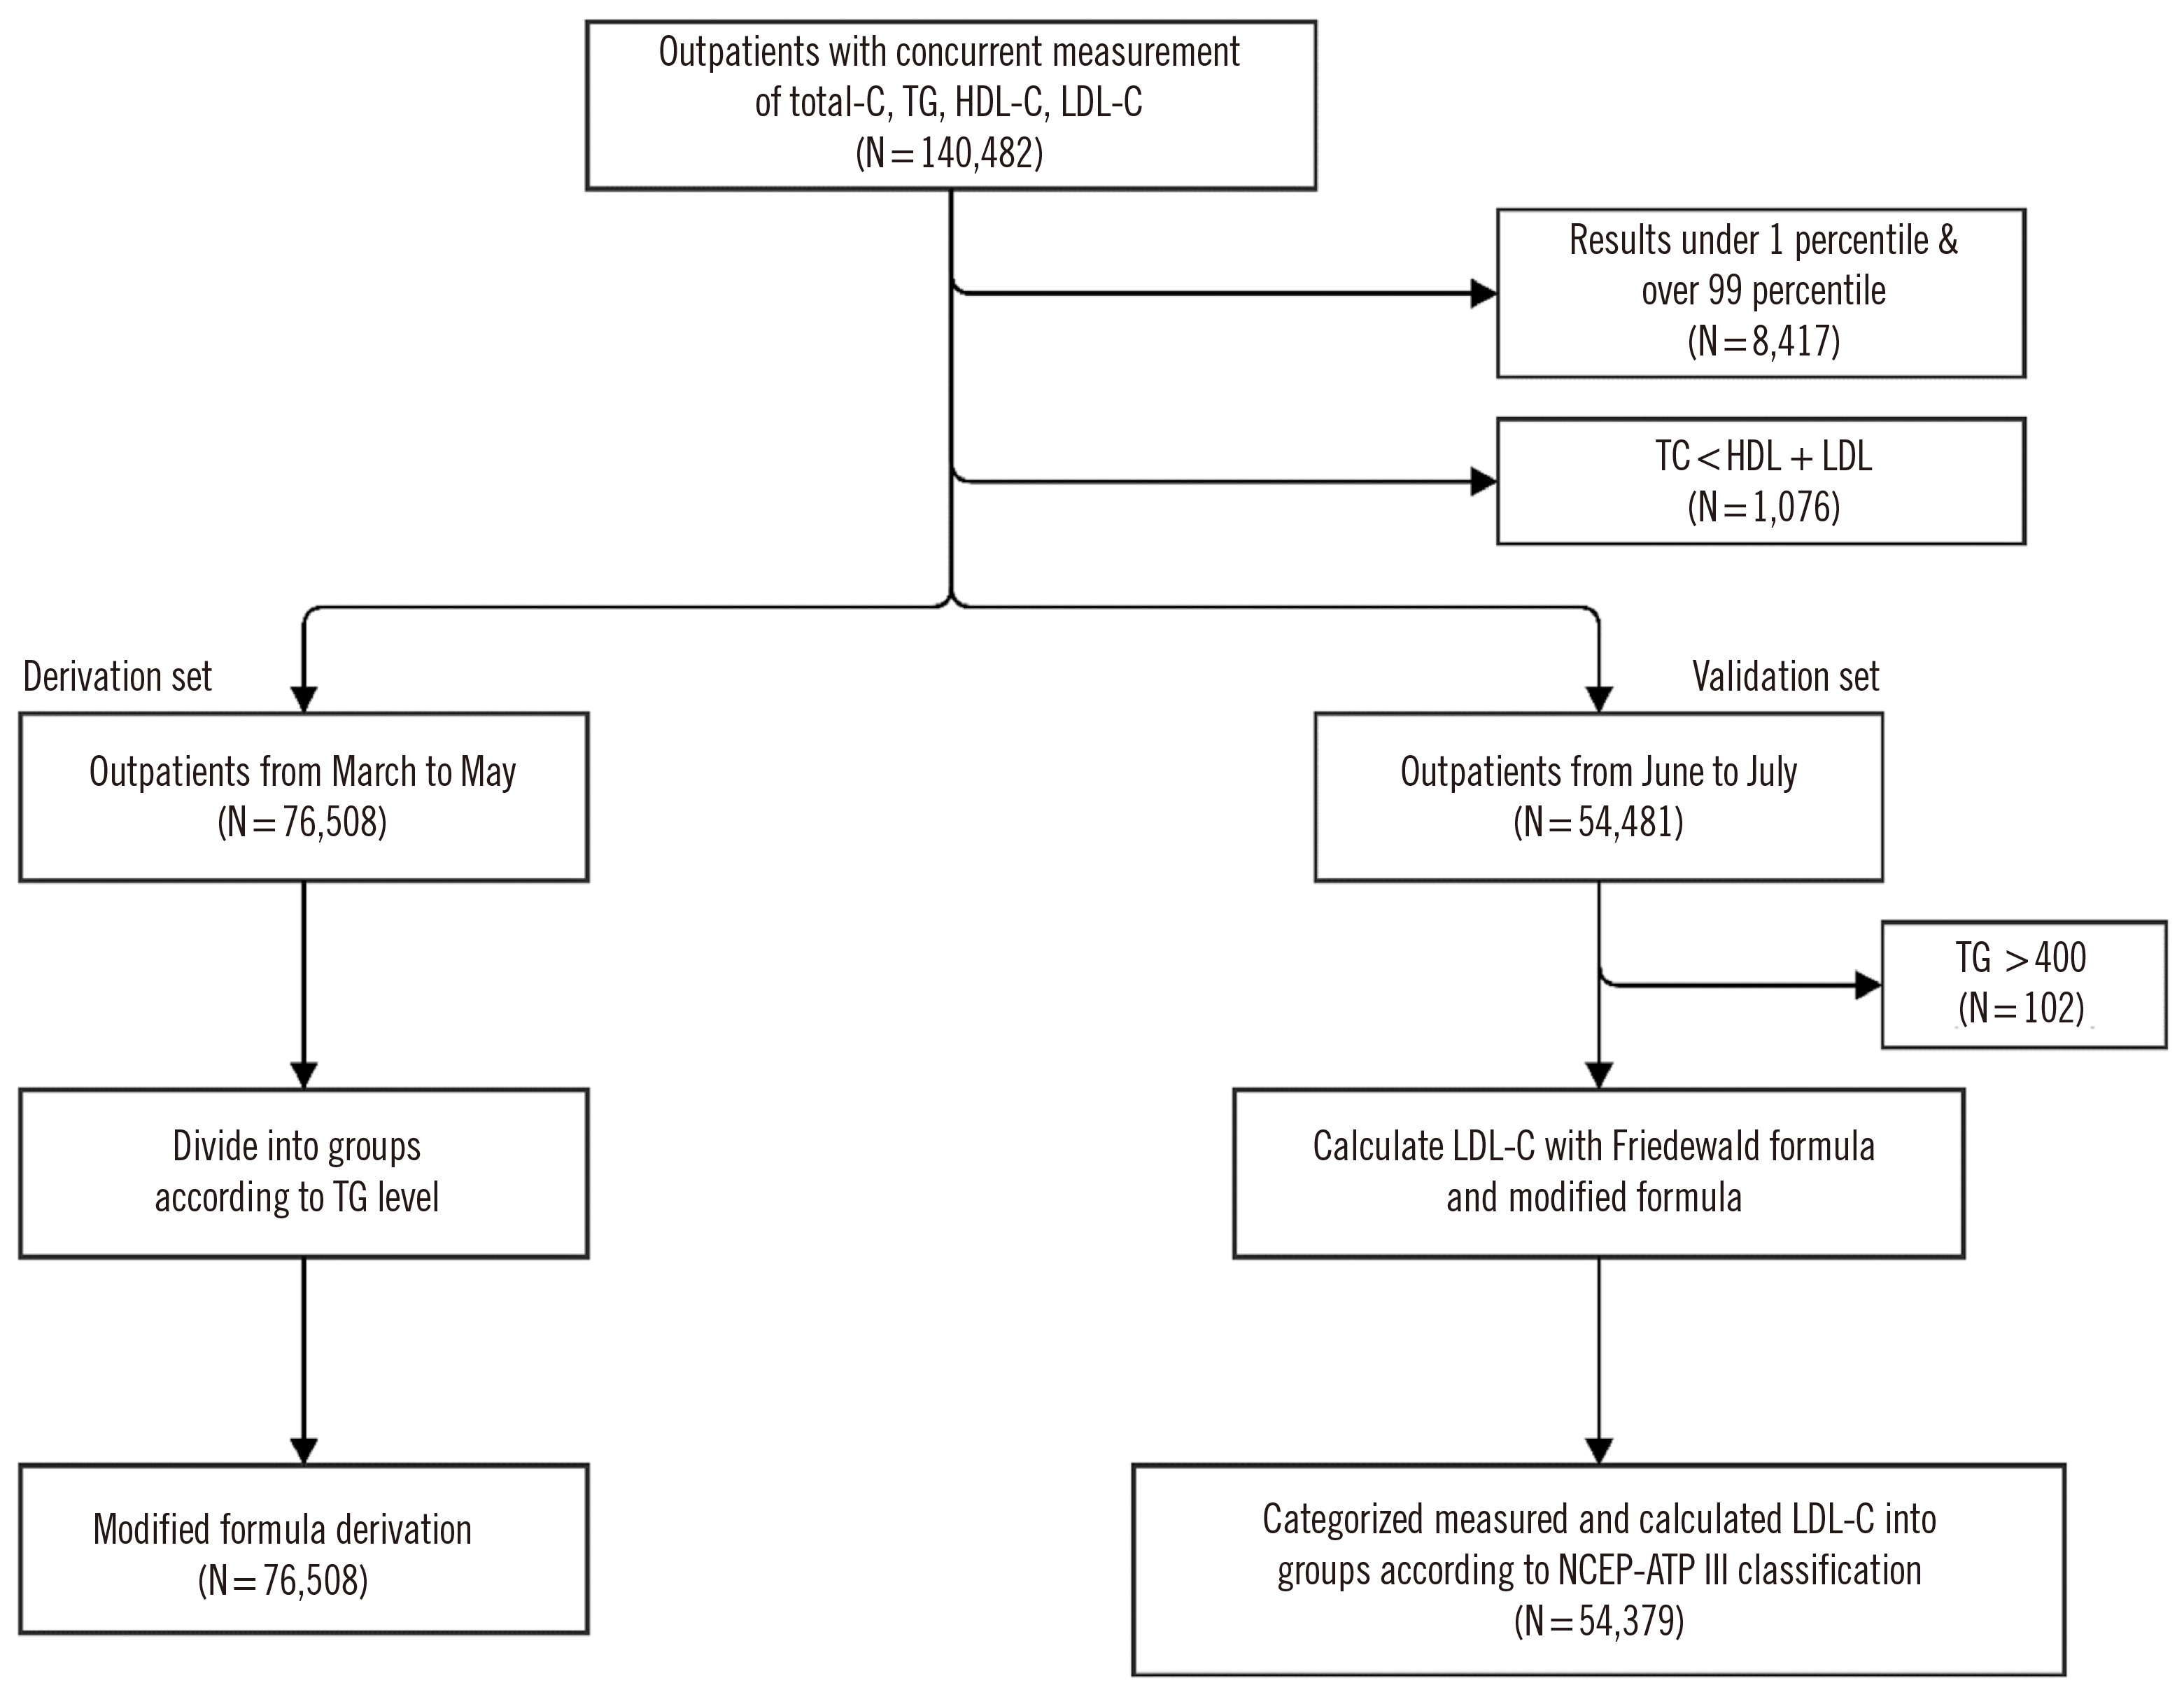
Flowchart of the study design.
Abbreviations: HDL-C, HDL-cholesterol; LDL-C, LDL-cholesterol; NCEP-ATP III, U.S. National Cholesterol Education Program Adult Treatment Panel III; TG, triglyceride.
alm-43-1-29-f1.tif
Fig. 2
(A) The mean of difference between calculated and measured LDL-C for each group of triglycerides and factors in derivation set. The smallest mean differences are observed in factor 4.7, 5.9, 6.3, and 6.4 for the groups with triglyceride concentrations <100, 101–200, 201–300, and >300 mg/dL. (B) The mean of difference between calculated and measured LDL-C for each group of triglycerides and factors in validation set. 95% confidence interval is shown for groups with triglyceride concentrations 301–400 and >400 mg/dL.
Abbreviations: CI, confidence interval; LDL-C, LDL-cholesterol.
alm-43-1-29-f2.tif
Fig. 3
Scatter plots and regression lines comparing measured and calculated LDL-C using the Friedewald formula (A), modified formula (B), Martin-Hopkins formula (C), and Sampson formula (D).
Abbreviation: LDL-C, LDL-cholesterol.
alm-43-1-29-f3.tif
Fig. 4
(A) Distribution of LDL-C calculated with different formulae according to the NCEP-ATP III classification. (B) Agreement rate between measured LDL-C and calculated LDL-C using different formulae.
Abbreviations: LDL-C, LDL-cholesterol; NCEP-ATP III, U.S. National Cholesterol Education Program Adult Treatment Panel III.
alm-43-1-29-f4.tif
Fig. 5
Cases with LDL-C ≤100 mg/dL were analyzed by applying the 2019 ESC/EAS guidelines. (A) Distribution of LDL-C calculated with different formulae according to the 2019 ESC/EAS guidelines. (B) Agreement rate between measured LDL-C and calculated LDL-C using different formulae.
Abbreviations: ESC/EAS, European Society of Cardiology and European Atherosclerosis Society; LDL-C, LDL-cholesterol.
alm-43-1-29-f5.tif
Table 1
Data characteristics of outpatient test results (N=140,482)
Variable N Mean Median SD Range 25th–75th percentile 1st–99th percentile
Total cholesterol (mg/dL) 170.6 167 42.7 20–1,526 140–197 90–283
HDL-C (direct) (mg/dL) 52.1 50 14.2 3–187 42–60 27–94
LDL-C (direct) (mg/dL) 95.0 91 35.4 6–1,559 69–117 33–190
< 100 83,542
100-129 33,771
130-159 16,732
160-189 5,031
≥ 190 1,406
Triglyceride (mg/dL) 129.5 110 92.7 18–6,805 80–153 43–427
≤ 100 60,080
101–200 63,785
201–300 12,128
301–400 2,786
> 400 1,703

Abbreviations: HDL-C, HDL-cholesterol; LDL-C, LDL-cholesterol.

TOOLS
Similar articles