

 PDF
PDF Citation
 Print
Print


INTRODUCTION
In Korea, pancreatic cancer (3.2% of all the cancers) and “gallbladder and extrahepatic bile duct” cancer (2.9% of all the cancers) ranked the 8th and 9th most frequent cancers in 2019, respectively [1]. As the mortality rates approximate the incidence rates in these cancers, pancreatic cancer and “gallbladder and extrahepatic bile duct” cancer ranked the 4th and 6th most common causes of cancer deaths in 2020, respectively [2]. The policymakers have recognized that breast and prostate cancer incidences are rising, while the overall age-standardized incidence rate of all the cancer sites has been declining since 2012 in Korea [1]. On the contrary, although clinicians notice the increasing trend of the biliary tract and pancreatic cancer, the epidemiological features of the gallbladder, extrahepatic bile duct, and pancreatic cancers have not been presented in detail in the national statistics. For example, in the national cancer statistics [3,4], the gallbladder cancer (C23) is pooled with extrahepatic bile duct cancer (C24) statistics, while intrahepatic bile duct cancer (C22.1) is included in the liver cancer statistics according to the International Classification of Diseases, tenth revision (ICD-10) [5]. Therefore, this review aims to provide a comprehensive overview of the gallbladder, extrahepatic bile duct, and pancreatic cancer epidemiology in Korea, including demographic characteristics, incidence, mortality, and survival outcomes. The epidemiology of intrahepatic bile duct cancer will be discussed in another article in this journal that analyzes liver cancer statistics [6].
MATERIALS AND METHODS
Data source
Epidemiological data were obtained from the Korea Central Cancer Registry (KCCR), based on the Korea National Cancer Incidence Database [1]. Patients registered as C23 (gallbladder cancer), C24 (extrahepatic bile duct cancer), and C25 (pancreatic cancer) under the current scheme of ICD-10 from 1999 to 2019 were included in this study [5]. The information from the Surveillance, Epidemiology, and End Results (SEER) stage has been collected since 2005 and published by the KCCR since 2006. SEER stage at diagnosis was classified as localized (invasive cancer limited to the organ of origin), regional (tumor extension beyond the limits of organ of origin), distant (spread to distant areas from the primary tumor), and unknown [7]. The “first course of treatment” was grouped into three, which refers to documented cancer-directed treatment methods within the first 4 months from the date of the initial diagnosis [7]; surgical (surgery alone, surgery with chemotherapy, surgery with radiotherapy, surgery with chemotherapy, and radiotherapy), non-surgical (chemotherapy alone, chemotherapy with radiotherapy, and radiotherapy alone), and no active or unknown treatment information [8]. The study protocol was approved by the institution’s human research committee, with exemption of obtaining written informed consent because of the retrospective design of the study (IRB No. NCC2022-0107).
Statistical analysis
The study period was divided into periods I (1999 to 2005), II (2006 to 2012), and III (2013 to 2019). Rates were expressed as crude rate (CR) and age-standardized rate (ASR) per 100,000 individuals. CRs were calculated as the total number of incidence or mortality cases divided by the mid-year population of the specified years. The ASRs were the weighted average of the age-specific rates, standardized using Segi’s world standard population [9]. The annual percent change (APC) of ASRs and average APC (AAPC) as a weighted average of APCs for the whole study period were computed. Relative survival rates were estimated using the Ederer II method with minor modifications [10], based on an algorithm written in a Statistical Analysis System (SAS) provided by Paul Dickman in Karolinska Institutet, Stockholm, Sweden. All the statistical tests were two-tailed, and the results were considered statistically significant at p < 0.05. Analyses were performed using SAS 9.4 (SAS Institute, Inc., Cary, NC, USA) and Joinpoint 4.7.0.0 (National Cancer Institute, Bethesda, MD, USA).
RESULTS
Patient characteristics
Between 1999 and 2019, there were 207,521 newly diagnosed gallbladder, extrahepatic bile duct, and pancreatic cancer patients in Korea. These three cancers accounted for 5.6% (5,659 of 101,847) and 6.1% (15,482 of 254,718) of all cancer sites in 1999 and 2019, respectively. Of these patients, 21.3% (n = 44,178) had gallbladder cancer, 29.8% (n = 61,856) had extrahepatic bile duct cancer, and 48.9% (n = 101,487) had pancreatic cancer. More than 50% of the patients were 70 years old or over. Gallbladder cancer predominantly occurred in females (male-to-female ratio, 1 : 1.33), while extrahepatic bile duct (1 : 0.75) and pancreatic cancers predominantly occurred in males (1 : 0.85). The proportion of surgical first course of treatment was relatively higher in the gallbladder (42.2%) and extrahepatic bile duct (45.9%) cancers than that in pancreatic cancer (22.2%). The proportion of localized or regional stage was the highest in extrahepatic bile duct cancer (68.4%), followed by gallbladder cancer (52.9%) and then pancreatic cancer (32.8%) (Table 1).
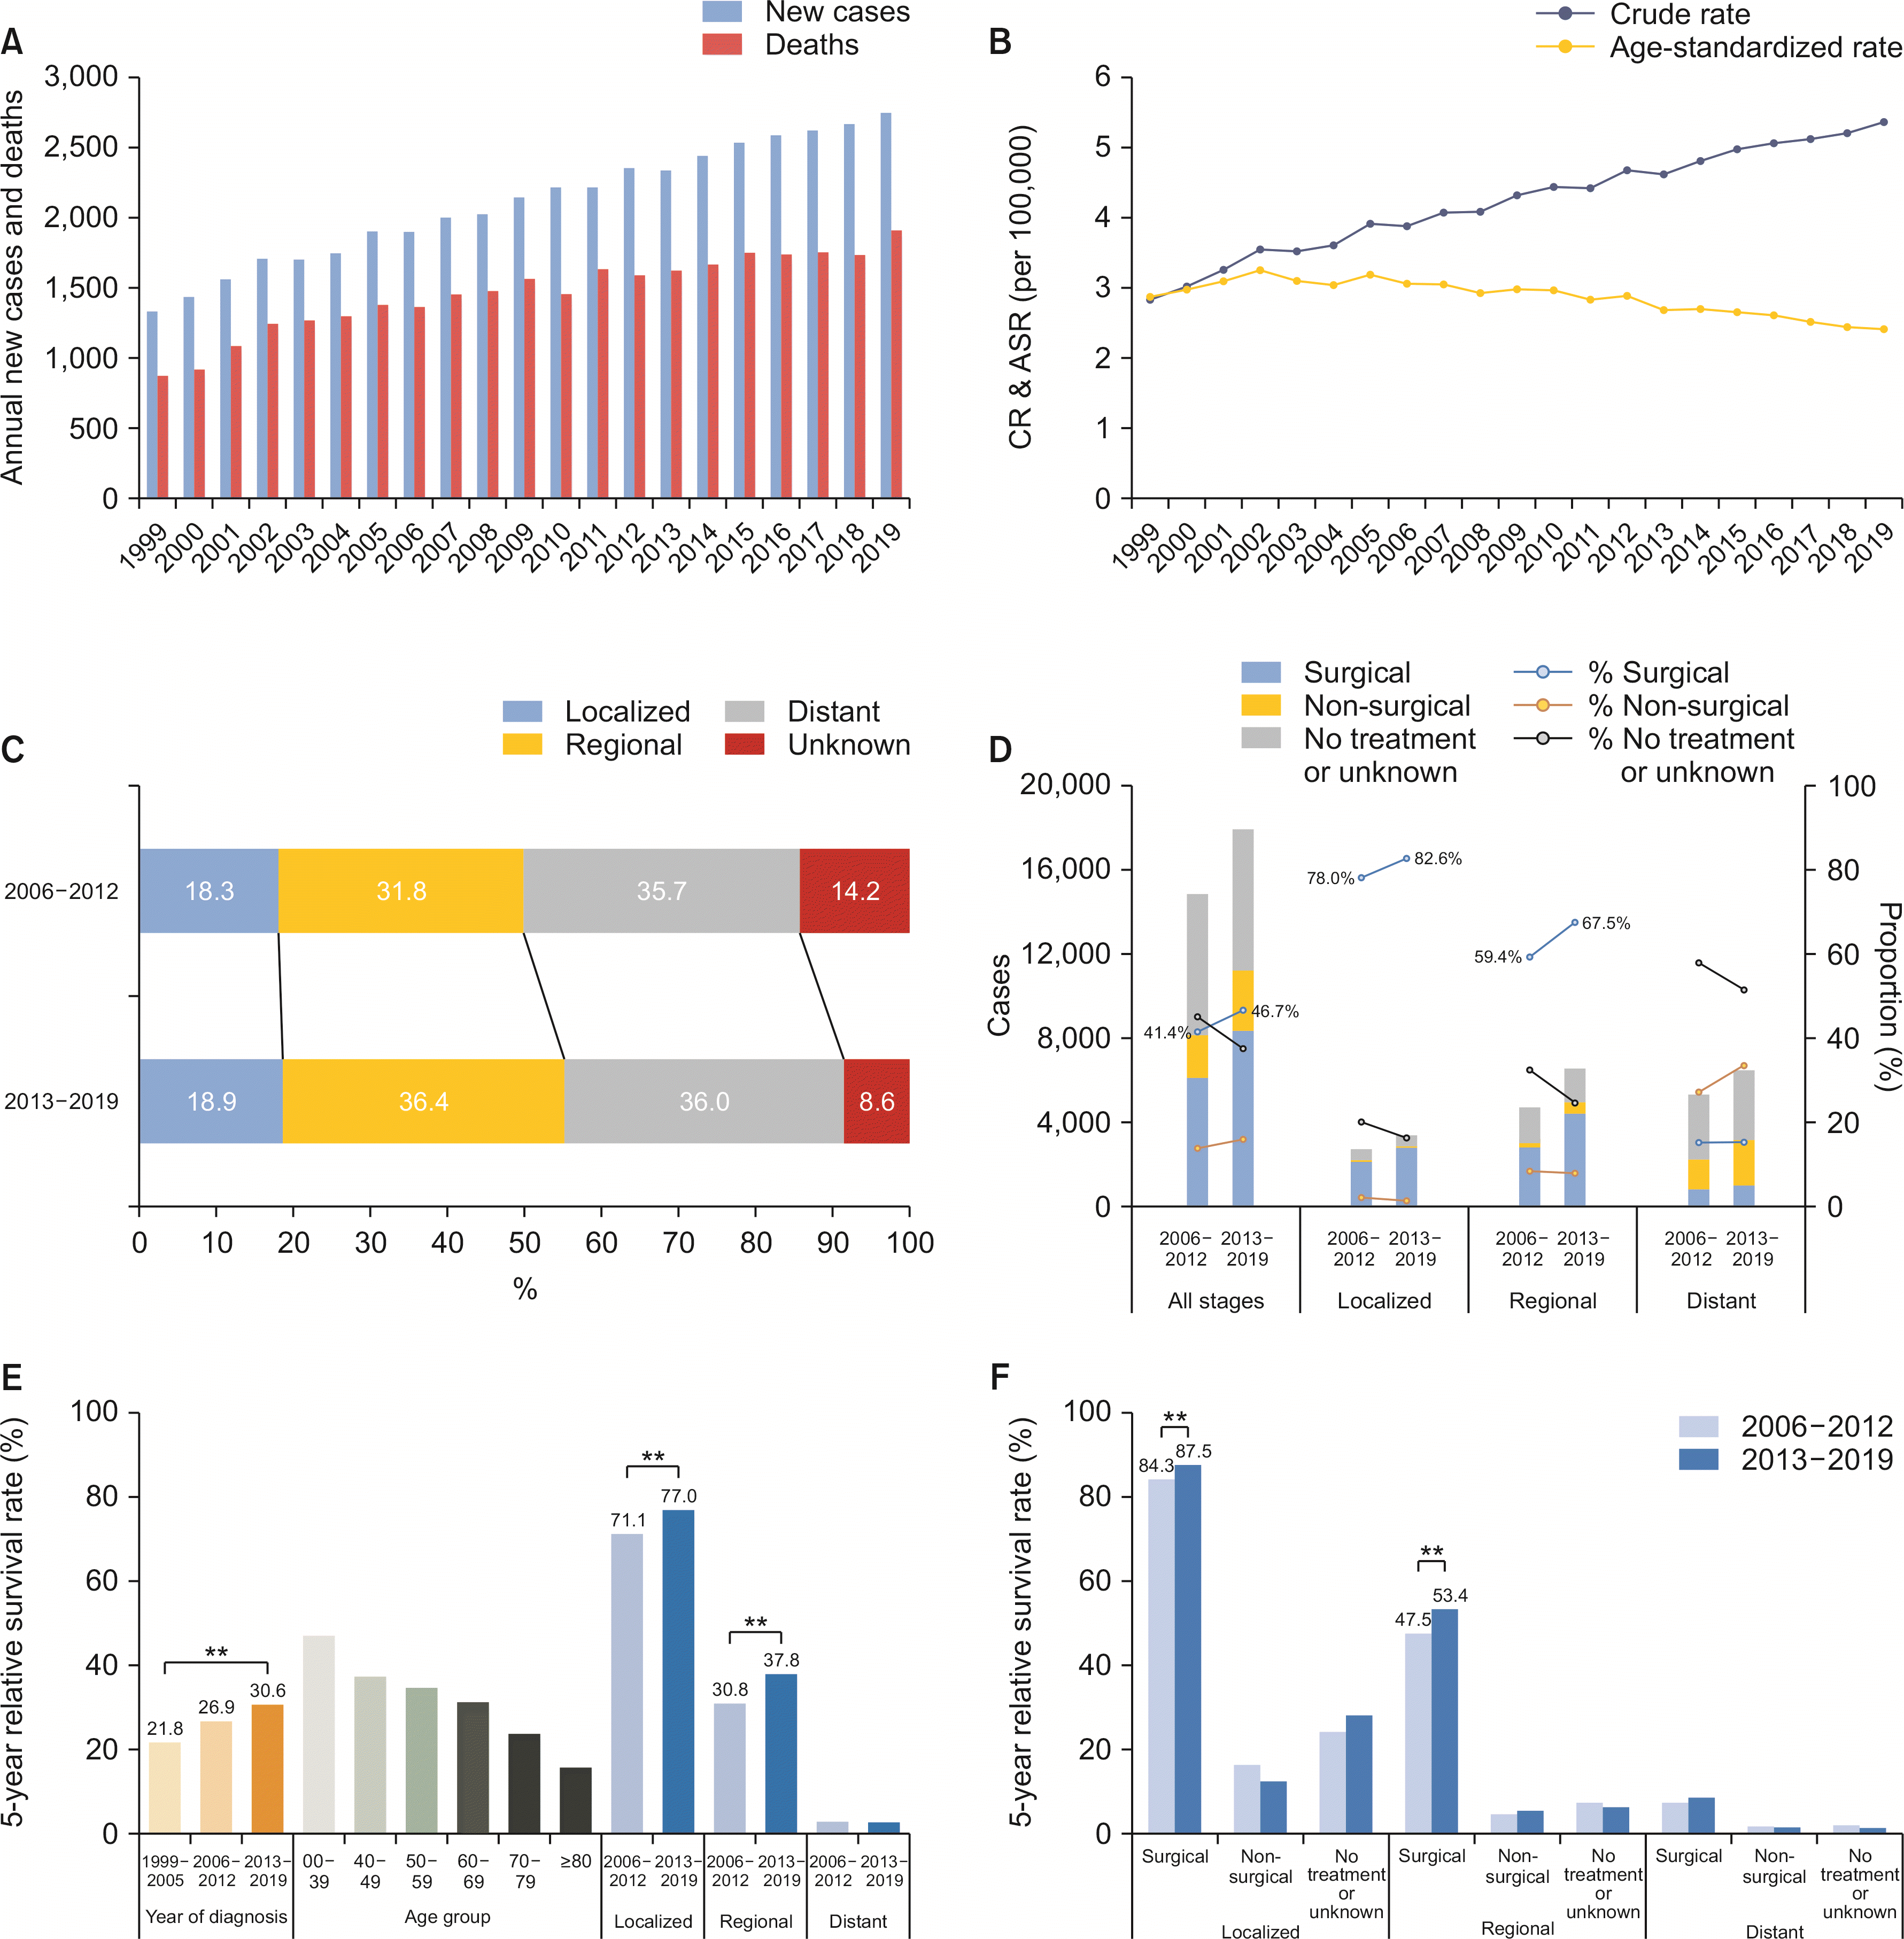
Gallbladder cancer
From 1999 to 2019, the annual number of newly diagnosed patients increased from 1,337 to 2,744, while cancer deaths increased from 877 to 1,906 in both sexes (Fig. 1A). The CR of incidence in both sexes increased from 2.8 per 100,000 to 5.4 (Supplementary Table 1), and the trend was similar in both males (2.5 to 4.8) and females (3.2 to 5.9, data not shown). However, the ASR of incidence in both sexes significantly decreased with an AAPC of –0.87 (95% confidence interval [CI] –1.46 to –0.29; p < 0.01; Supplementary Table 2), which increased from 1999 to 2002 (2.9 to 3.3) and then decreased until 2019 (2.4; Fig. 1B). Decreasing trends in ASR of incidence were also observed in both males (AAPC, –1.23; 95% CI, –1.65 to –0.80; p < 0.01) and females (AAPC, –0.75; 95% CI, –1.41 to –0.08; p = 0.03; data not shown). The CR of mortality in both sexes increased from 1.9 to 3.7 (Supplementary Table 1). However, the ASR of mortality decreased in males (AAPC, –1.12; 95% CI, –1.94 to –0.29; p < 0.01) and females (AAPC, –1.00; 95% CI, –1.93 to –0.07; p = 0.04; data not shown).
The crude number of patients revealed a female predominance with a male-to-female ratio of 1 : 1.33 (Table 1). However, male-to-female ratio of ASR of incidence was 1 : 0.97, which remained stable over time (period I, 0.97; period II, 0.95; and period III, 0.95).
Between 2006 and 2019, 52.9% of the patients had localized or regional diseases (Table 1). From periods II to III, the proportion of unstaged disease decreased while that of other stages increased (Fig. 1C). However, after excluding unstaged disease, the proportion of regional stage increased (37.1% to 39.8%), while localized (21.3% to 20.7%) and distant stage (41.6% to 39.5%) decreased. The proportion of the surgical first course of treatment increased from 78.0% to 82.6% in the localized stage and from 59.4% to 67.5% in the regional stage (Fig. 1D). The proportion of patients with no active or unknown treatment decreased in all the stages (44.9% to 37.4%).
In period III, the median survival was 11 months in all the stages. From periods I to III, the overall 5-year relative survival rate (5YRS) significantly increased over time (21.8% to 30.6%; p < 0.01), especially, in the localized (77.1% to 77.0%; p < 0.01) and regional (30.8% to 37.8%; p < 0.01) (Fig. 1E) stages. When stratified into the SEER stage and the first course of treatment, the 5YRS was significantly higher in the surgical first course of treatment group at each stage (p < 0.01). From periods II to III, the 5YRS significantly increased in the surgical first course of treatment group in both localized (84.3% to 87.5%; p < 0.01) and regional (47.5% to 53.4%; p < 0.01) (Fig. 1F, Supplementary Table 3) stages.
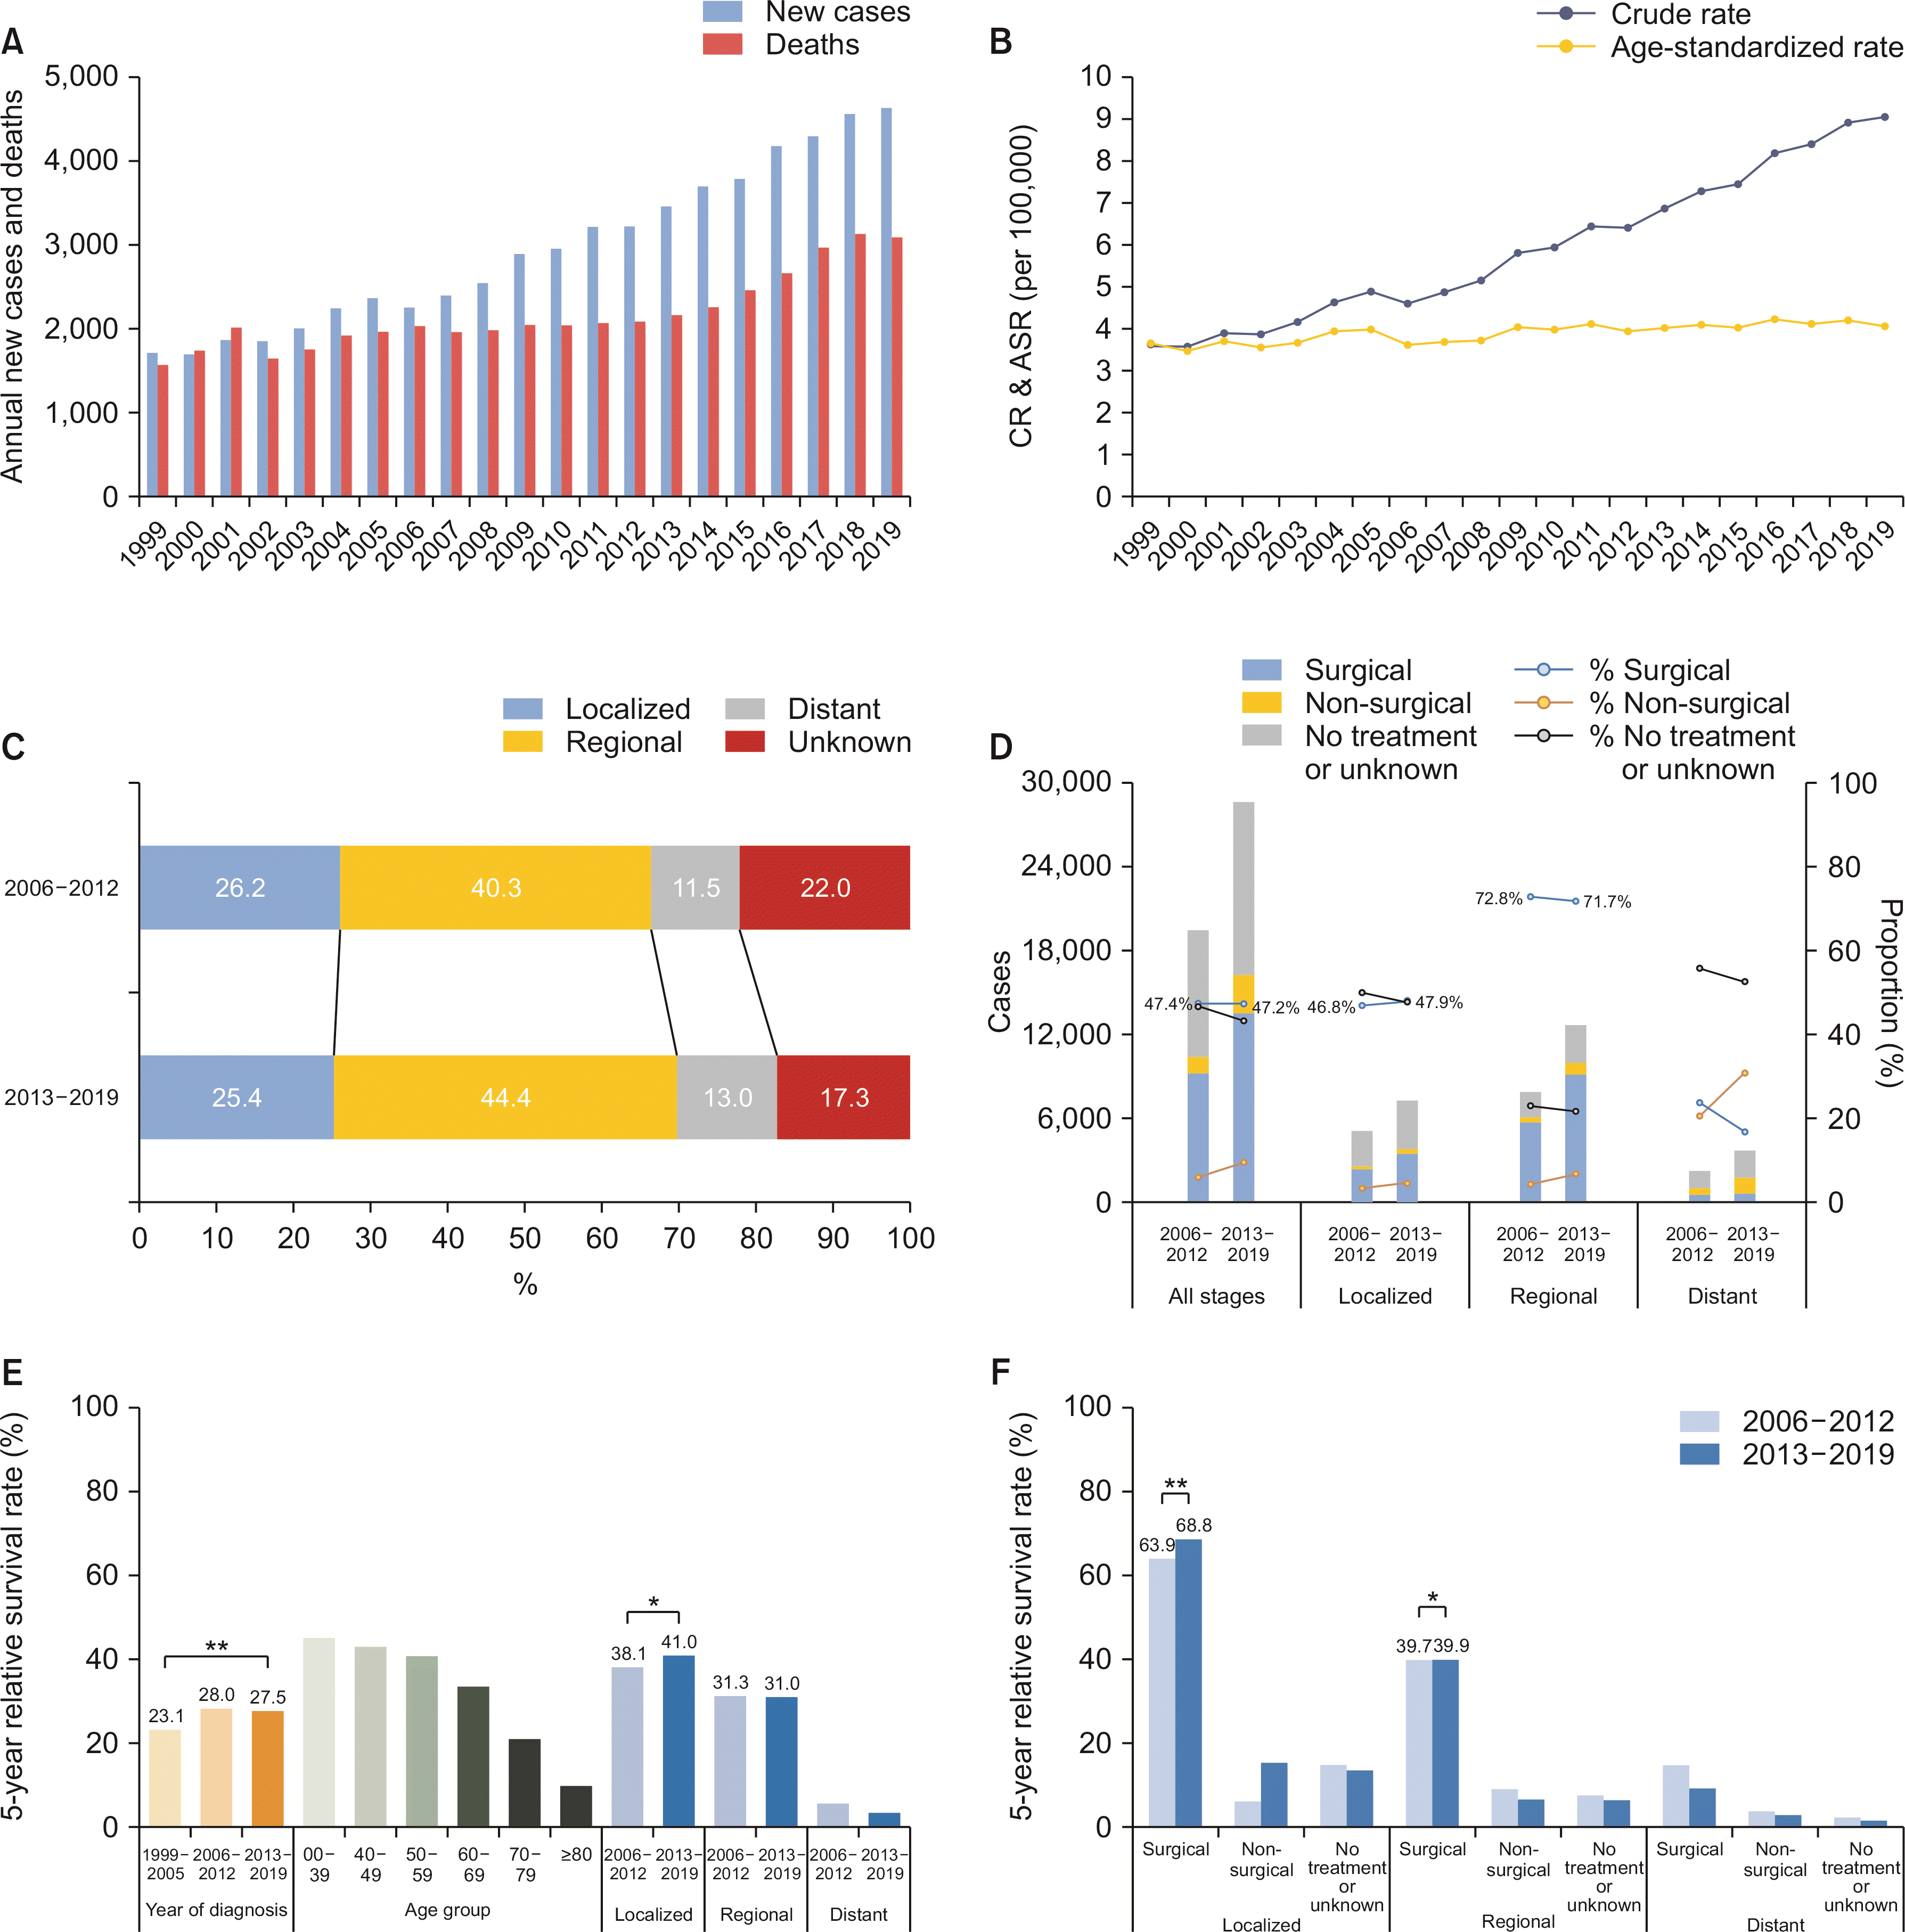
Extrahepatic bile duct cancer
From 1999 to 2019, the annual number of newly diagnosed patients increased from 1,710 to 4,639, while cancer deaths increased from 1,569 to 3,082 in both sexes (Fig. 2A). The CR of incidence in both sexes increased from 3.6 to 9.0 (Supplementary Table 4), with a similar trend in both males (4.2 to 10.4) and females (3.1 to 7.7; data not shown). The ASR of incidence significantly increased in both sexes (3.7 to 4.1, APC 0.76 [95% CI 0.52 to 1.00], p < 0.01) (Supplementary Table 5), males (5.1 to 5.5, APC 0.63 [95% CI 0.37 to 0.90], p < 0.01), and females (2.6 to 2.9, APC 0.64 [95% CI 0.31 to 0.96], p < 0.01) (Fig. 2B, data not shown). The CR of mortality in both sexes increased from 3.3 to 6.0 (Supplementary Table 4). However, the ASR of mortality decreased in both sexes (AAPC –1.85 [95% CI –2.72 to –0.97], p < 0.01) (Supplementary Table 5), males (AAPC –1.98 [95% CI –2.83 to –1.11], p < 0.01), and females (AAPC –1.81 [95% CI –2.80 to –0.81], p < 0.01; data not shown).
The male predominance observed in the crude number of patients (1 : 0.75) was in concordance with the ASR of incidence (1 : 0.53), which remained stable over time (period I, 0.53; period II, 0.54; and period III, 0.53).
Between 2006 and 2019, 68.4% of the patients had localized or regional diseases (Table 1). From periods II to III, the proportion of unstaged disease decreased while that of other stages increased (Fig. 2C). After excluding unstaged disease, the proportion of localized stage decreased (33.6% to 30.7%), while the regional (51.6% to 53.6%) and distant (14.8% to 15.7%) stage increased. The proportion of the surgical first course of treatment remained relatively stable in the localized (46.8% to 47.9%) and regional stages (72.8% to 71.7%; Fig. 2D). The proportion of patients with no active or unknown treatment decreased in all the stages (46.6% to 43.2%).
In period III, the median survival was 17 months for all stages, 25 for the localized stage, and 24 for the regional stage. From periods I to III, the overall 5YRS significantly increased over time (23.1% to 27.5%, p < 0.01), especially in the localized stage (38.1% to 41.0%, p < 0.01; Fig. 2E). However, the 5YRS of the regional stage disease remained stable. When stratified into the SEER stage and the first course of treatment, the 5YRS was significantly higher in the surgical first course of treatment group at each stage (p < 0.01). From periods II to III, the 5YRS significantly increased in the surgical first course of treatment group in both localized (63.9% to 68.8%, p < 0.01) and regional stages (39.7% to 39.9%, p = 0.04) (Fig. 2F, Supplementary Table 6).
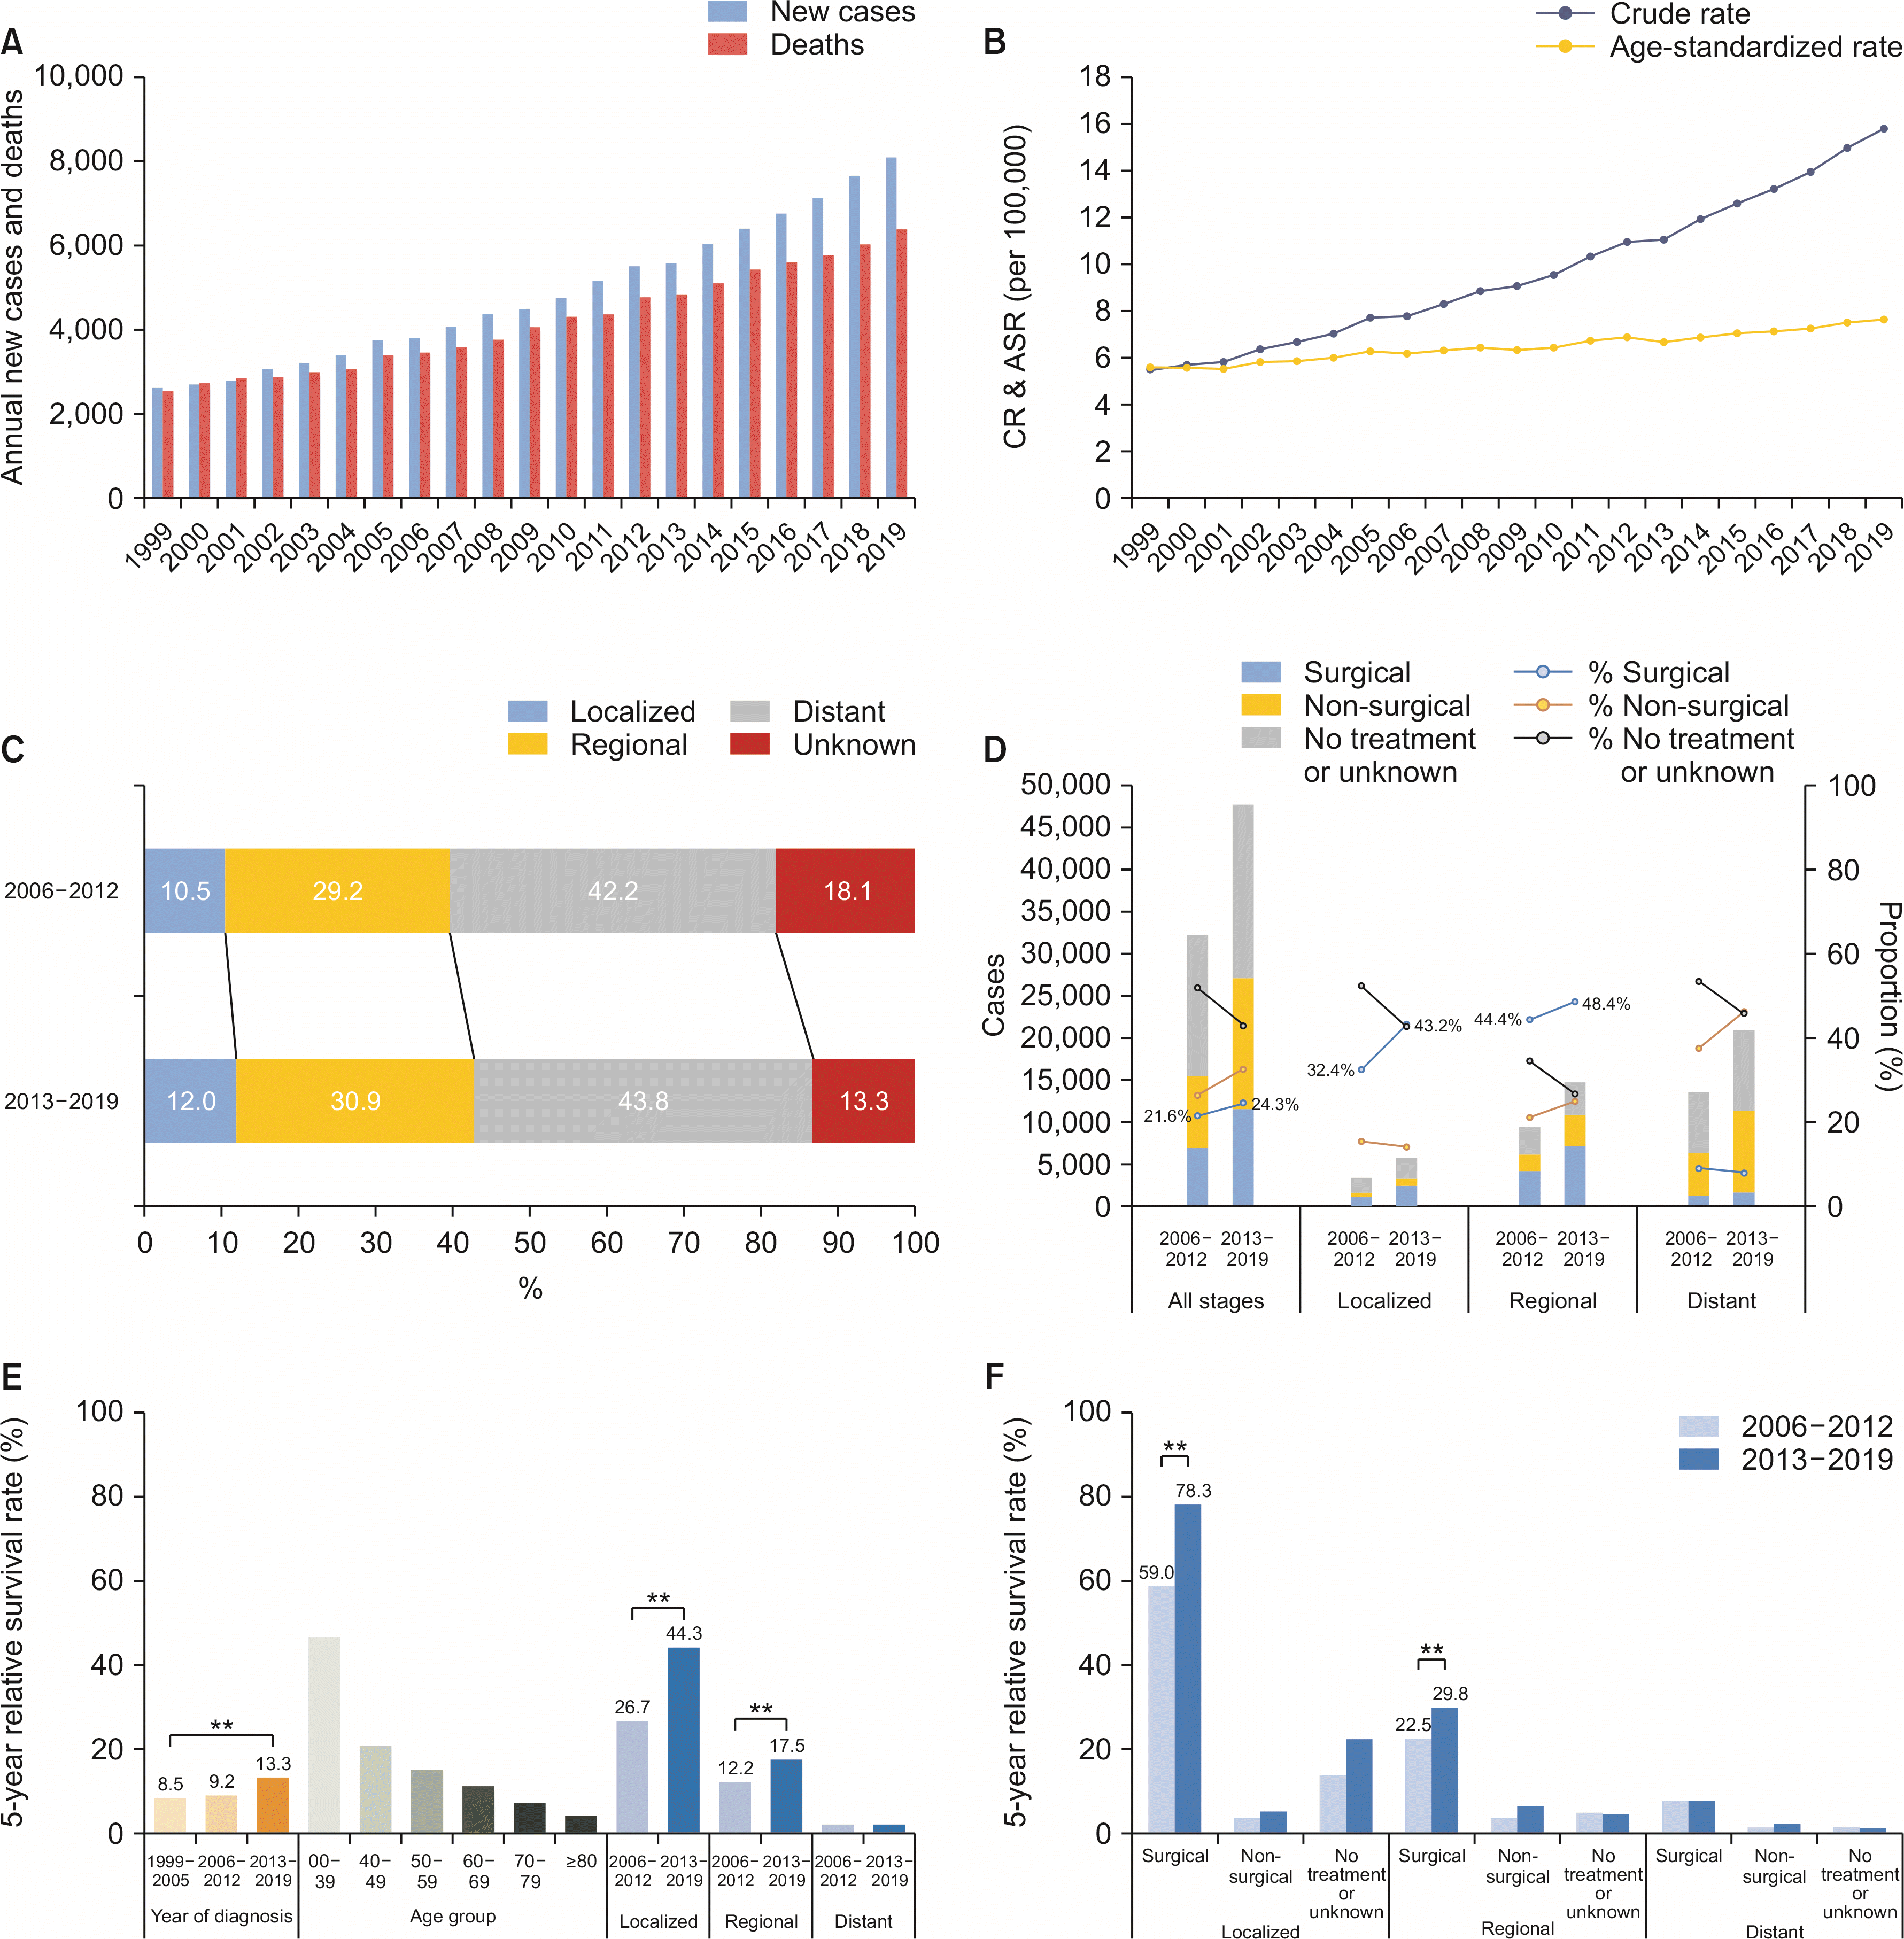
Pancreatic cancer
From 1999 to 2019, the annual number of newly diagnosed patients increased from 2,612 to 8,099, while cancer deaths increased from 2,543 to 6,396 in both sexes (Fig. 3A). The CR of incidence in both sexes increased from 5.5 to 15.8 (Supplementary Table 7), and the trend was similar in both males (6.5 to 16.2) and females (4.6 to 15.4, data not shown). The ASR of the incidence significantly increased in both sexes (5.6 to 7.6, APC 1.55 [95% CI 1.42–1.68], p < 0.01) (Fig. 3B, Supplementary Table 8). The increasing trend of ASR was more dominant in females (4.0 to 6.6, APC 2.50 [95% CI 2.31–2.69], p < 0.01) than in males (7.9 to 8.8, APC 0.64 [95% CI 0.46–0.82], p < 0.01, data not shown). The CR of mortality in both sexes increased from 5.4 to 12.5 (Supplementary Table 7). However, the ASR of mortality remained stable in both sexes (APC 0.09 [95% CI –0.05 to 0.24], p = 0.02) (Supplementary Table 8), decreased in males (7.7 to 7.1, APC –0.56 [95% CI –0.75 to –0.36], p < 0.01), but increased in females (3.9 to 4.4, AAPC 0.68 [95% CI 0.45 to 0.90], p < 0.01, data not shown).
The crude number of patients revealed male predominance (1 : 0.85). The overall male-to-female ratio of ASR of incidence was 1 : 0.63, which gradually increased over time (period I, 0.55; period II, 0.60; and period III, 0.70).
Between 2006 and 2019, 32.8% of the patients had localized or regional diseases (Table 1). From periods II to III, the proportion of unstaged disease decreased while that of the other stages increased (Fig. 3C). After excluding unstaged disease, the proportion of the localized stage increased (12.8% to 13.8%), while the regional stage remained stable (35.6% to 35.7%) and that of the distant stage decreased (51.6% to 50.5%). The proportion of the surgical first course of treatment increased in both localized (32.4% to 43.2%) and regional (44.4% to 48.4%; Fig. 3D) stages. The proportion of patients with no active or unknown treatment decreased at all stages (51.8% to 43.0%).
In period III, the median survival was 8 months for all stages, 23 months for the localized stage, and 14 months for the regional stage. From periods I to III, the overall 5YRS significantly increased over time (8.5% to 13.3%, p < 0.01), especially in the localized (26.7% to 44.3%, p < 0.01) and regional (12.2% to 17.5%, p < 0.01, Fig. 3E) stages. When stratified into the SEER stage and the first course of treatment, the 5YRS was significantly higher in the surgical first course of treatment group at each stage (p < 0.01). From periods II to III, the 5YRS significantly increased in the surgical first course of treatment group in both localized (59.0% to 78.3%, p < 0.01) and regional stages (22.5% to 29.8%, p < 0.01) (Fig. 3F, Supplementary Table 9).
DISCUSSION
In Korea, the number of annual new cases and cancer-related deaths from the gallbladder, extrahepatic bile duct, and pancreatic cancers is steadily increasing. Although the ASR is used to compare trends over time, CR helps determine the cancer burden for a given population [11]. It should be noted that the three types of cancers accounted for 6.1% of all the cancers in Korea in 2019. Therefore, more attention and effective strategies are needed to cope with the increasing incidence and improve their relatively poor prognosis. In particular, this study revealed that extrahepatic bile duct and pancreatic cancer had increasing trends in ASR of incidence, contrary to the overall ASR of incidence of all the cancer sites in Korea, which has been declining since 2012 [1]. In addition, a sharp increase in the ASR of incidence of pancreatic cancer among women has been observed, and the gap with men is narrowing. In the United States, in contrast, the trend in the incidence of pancreatic cancer between men and women and the sex gap remained stable [12].
This study revealed a marked improvement in the prognosis of localized stage pancreatic cancer, especially with the first surgical course of treatment group. Care should be taken not to overinterpret the improvement in prognosis, as it includes patients with pancreatic ductal adenocarcinoma and those with favorable histology such as mucinous or cystic cancers [8]. As can be seen from the data, the prognosis may have improved due to the recent increase in the proportion of surgical treatment.
In the cancer registry, the first course of treatment was recorded only until the first 4 months after the initial diagnosis. After then, those who underwent cancer-directed treatment could have been classified as having no active or unknown treatment. In particular, patients with extrahepatic bile duct cancer who underwent biliary drainage before surgical treatment for more than 4 months may have been misclassified as the no active or unknown treatment group [13]. This may explain why the proportion of surgical treatment was relatively lower in the localized stage than that in the regional stage extrahepatic bile duct cancer. Nevertheless, approximately half of the patients with gallbladder, extrahepatic bile duct, and pancreatic cancer did not receive active anticancer treatment within the first 4 months after the initial diagnosis. As shown in the data, the 5YRS was significantly higher in the surgical first course of treatment group than that in the non-surgical, no active, or unknown treatment groups. From periods II to III, the proportion of surgical first course of treatment increased in localized and regional stages of the gallbladder and pancreatic cancer, with a concurrent increase in 5YRS. In contrast, in the case of regional stage extrahepatic bile duct cancer, neither the proportion of surgical first course of treatment nor the overall 5YRS increased. Therefore, to improve the overall prognosis, early diagnosis is necessary as this will subsequently increase the number of patients eligible for surgical treatment and actively perform surgical treatment in operable patients.
The impact of “Klatskin tumor (M8162/3)” misclassification on the overestimation of intrahepatic bile duct and underestimation of extrahepatic bile duct cancer incidence was described in previous studies [14-16]. However, information on morphology codes is not available in mortality statistics, unlike in the cancer registry; hence, it was impossible to reclassify “Klatskin tumor (M8162/3)” to either intra- or extrahepatic bile duct cancer in mortality statistics. Therefore, in this review, the topography of “Klatskin tumor (M8162/3)” based on the ICD for Oncology, 3rd edition (ICD-O-3) has been kept as its original registration either as intrahepatic (C22.1) or extrahepatic bile duct (C24) [17]. It should be noted that the incidence and mortality statistics of extrahepatic bile duct cancer presented in this review may have been underestimated. The ICD-O-3.2 classifies “Klatskin tumor (M8162/3)” only as extrahepatic bile duct cancer, which has been in effect for cancer registration in Korea since 2021 [18]. Therefore, the incidence trend of extrahepatic bile duct cancer is expected to change.
This study has several limitations. First, localized stages of the extrahepatic bile duct and pancreatic cancer may have been overestimated because of the missing identification of lymph node metastasis, direct tumor extension, or metastasis due to higher rates of no active or unknown treatment. Consequently, the proportion of the first surgical course of treatment in the localized stage could have been underestimated [13]. Second, longitudinal treatment information was unavailable in the cancer registry data. In a previous study, the surgical treatment rate in the cancer registry was comparable with that in national health insurance claim data, while the non-surgical treatment rate was underestimated, and no active or unknown treatment rate was overestimated in the cancer registry [8]. Therefore, the treatment information provided in this study should be interpreted with caution so as not to misunderstand the no-active or unknown treatment group as having a higher survival rate than that of the non-surgical treatment group.
In summary, the number of newly diagnosed patients and cancer-related deaths from gallbladder, extrahepatic bile duct, and pancreatic cancers is steadily increasing in Korea. The overall prognosis has improved over time, but the proportion of SEER stage remains the same. This suggests that the early diagnosis rate has not increased despite improvements in diagnostic modalities and increased utilization of healthcare services. Although it may have been overestimated, it was found that approximately half of the patients with gallbladder, extrahepatic bile duct, and pancreatic cancers did not receive active anticancer treatment within the first 4 months. Among the three types of cancers, gallbladder cancer was the only cancer with decreasing ASR of incidence. Although there was an issue on the impact of misclassification of “Klatskin tumor (M8162/3),” extrahepatic bile duct cancer has an increasing trend of ASR of incidence. However, the improvement in the 5YRS of extrahepatic bile duct cancer was insignificant compared with the other two cancers; therefore, proper diagnosis and treatment are essential. Pancreatic cancer had the highest increasing trend in ASR of incidence, especially in females. However, there was a marked improvement in the 5YRS, especially in the localized stage with the surgical first course of treatment. As patients with a surgical first course of treatment have an excellent prognosis compared with those with non-surgical or no active or unknown treatment, efforts are needed to increase early diagnosis rates and the proportion of surgical first course of treatment among those with operable diseases.
SUPPLEMENTARY DATA
Supplementary data related to this article can be found at https://doi.org/10.14701/ahbps.22-041.
 XML Download