Journal List > Korean J Orthod > v.52(5) > 1516079858

Elagib, Kyung, Hung, and Hong: Assessment of pharyngeal airway in Korean adolescents according to skeletal pattern, sex, and cervical vertebral maturation: A cross-sectional CBCT study

Abstract

Objective

To investigate airway volumes using cone-beam computed tomography (CBCT) by skeletal patterns, sex, and cervical vertebral maturation (CVM) stages in Korean adolescents.

Methods

The sample consisted of pretreatment CBCT and cephalograms of 95 adolescents (aged 12–19) obtained out of 1,611 patients examined for orthodontic treatment from 2018 to 2020 in Kyungpook National University Dental Hospital. The samples were classified into two sex groups; three skeletal pattern groups, four chronological age groups and four CVM stages. Nasopharyngeal volumes (NPV), oropharyngeal volumes (OPV), total pharyngeal airway volume (TAV) and minimum cross-sectional area (MCA) measurements were taken from the CBCT. Multiple linear regression analyses to find out which one of the independent variables are good predictors for airway variables. Significant factors were analyzed by two-way multivariate analysis of variance (MANOVA) then multiple comparisons were analyzed using a t-test, and Fisher least significant difference.

Results

Age, sex, CVM, and Sella-Nasion-B point have significant influence on airway variable. Males and females showed similar patterns of change in chronological age groups 1–3; however, males had larger NPV, OPV, and MCA at CVM in group 4. According to CVM stages, males had larger OPV, TAV, and MCA at CVM stage 6 (p-value 0.019, 0.021, 0.015, respectively) and no sex differences at CVM stages 3, 4, and 5.

Conclusions

Skeletal patterns have an effect on airway volume. Sex differences were found in CVM 6.

INTRODUCTION

Cone-beam computed tomography (CBCT) facilitates three-dimensional (3D) visualization and measurement of complex airway anatomy with less exposure to radiation.1 Sleep disordered breathing is diagnosed based on polysomnographic test results. Orthodontic offices can serve as convenient points of access for patients who might benefit from further polysomnography evaluation.2-4 It is not presumed that airway volume studies are related to promoting a better diagnosis of obstructive sleep apnea. However, evaluation is necessary because the morphology of airway structure can be changed through natural growth, development, and orthodontic treatments.5 With the broad use of CBCT, airway volume assessment has recently drawn a lot of attention in the field of orthodontics.6
The earliest studies on the airway system were initiated more than a 100 years ago when Angle7 reported a narrowed upper airway in children with Class II dentofacial deformity. Subsequently, several studies have assessed upper pharyngeal airway spaces in subjects with different skeletal patterns; however, measurement of complex 3D airway units on two-dimensional cephalometric radiographs, which are commonly used by orthodontists as a diagnostic tool, was an inherent limitation.8 The advent of CBCT offered 3D exploration and more accurate imaging. Some studies on CBCT focused on airway volumes have found a predisposition to smaller pharyngeal airway volumes, with an increased A point-nasion-B point (ANB) angle,9-11 whereas others have reported no significant differences in airway dimensions between various facial patterns.12
Sex-based differences in airway parameters are a controversial subject. Although many studies11,13 have argued that there are no significant sex differences in airway volume, one large-sample-sized study14 has reported that males had larger volumes than females. Recently, Chan et al.15 found that females had smaller nasopharyngeal airway volumes (NPV), but there were no significant differences in oropharyngeal volumes (OPV) and total pharyngeal airway volumes (TAV).
The advantage of cervical vertebral maturation (CVM), a method to assess skeletal growth, is that routine cephalometric radiographs can be used.16-18 Several studies have assessed normal changes in the pharyngeal airway volume of growing patients using chronological age.14,15,19 Skeletal age might be a predictive factor for airway change during puberty;20 however, there are only a few studies on airway volumes21,22 that investigate this variable.
Recently, in a cross-sectional study,21 CVM was used to evaluate the airway in growing Caucasian subjects. They found that chronological age appeared to be a relatively reliable indicator for pharyngeal airway volume assessment, whereas CVM staging showed questionable validity. Since the airway continues to develop until the age of 20 years,19 an additional cross-sectional study with a broader age range may provide additional information. Furthermore, to the best of our knowledge, there are no cross-sectional studies in Korea that have examined the differences in the volumes of airways that correspond to different growth stages. The purpose of this study was to compare 3D volumes of the pharyngeal airway using skeletal pattern, sex, and CVM among Korean adolescents.

MATERIALS AND METHODS

The study protocol was reviewed and approved by the Institutional Review Board of Kyungpook National University Dental Hospital (IRB number: KNUDH-2020-11-01-01). From July 2018 to July 2020, diagnostic records of 95 adolescents out of 1,611 patients in Department of Orthodontics of Kyungpook National Dental Hospital were obtained. The images were taken with the teeth in maximum intercuspation, a natural head position, and at the end of exhalation period when the patient was not swallowing.
The sample comprised of pretreatment cephalograms and CBCT scans from the adolescents. The inclusion criteria were as follows: 1) age range from 12 to 19 years, 2) no previous orthodontic treatment history, 3) good of general health, and 4) having both lateral cephalograms and CBCT scans with clear visualization of craniofacial structures. Our exclusion criteria were as follows: history of any upper respiratory infection, pharyngeal pathology (such as adenoid hypertrophy and tonsillitis), history of adenoid or tonsil removal, and evidence of adenoid and/or tonsillar hypertrophy in the cephalogram.

Skeletal evaluation

The V-ceph 8.0 software (Osstem implant, Seoul, Korea) was used for cephalometric analyses. Conventional cephalometric landmarks were identified by an examiner (TE) and four angular measurements were recorded, including Frankfort mandibular plane angle (FMA), ANB, sella-nasion-A point (SNA), and sella-nasion-B point (SNB), for craniofacial relationship classification. The ANB angle was used to divide the sample into Class I (1° ≤ ANB < 4°), Class II (4° ≤ ANB), and Class III (ANB < 1°) skeletal pattern groups.23 CVM was used for determining skeletal age from lateral cephalograms.16

Computed tomography scanning protocol

CBCT scans of all patients were obtained by using the CB MercuRay (Hitachi, Osaka, Japan) with the following parameters (120 kV, 5 mA, 10-cm field of view, 0.377-mm voxel, and 9.6-seconds scanning time). Images were taken in a standing position, with the horizontal plane collateral to the ground and the teeth in maximum occlusion.

Standardized reorientation of three-dimensional images

To reduce assessment inaccuracies from nonstandardized head postures, the CBCT images were reoriented using two references, nasofrontozygomatic plane and Frankfort horizontal plane. Nasion (N) point was placed close to (0,0,0) and the coordinates Y and Z of the right and left frontozygomatic points were placed as close as possible to each other, through reorientation of the frontal and axial planes.24 The Frankfort horizontal plane was managed for reorientation of the 3D image in the sagittal plane.

Airway assessment

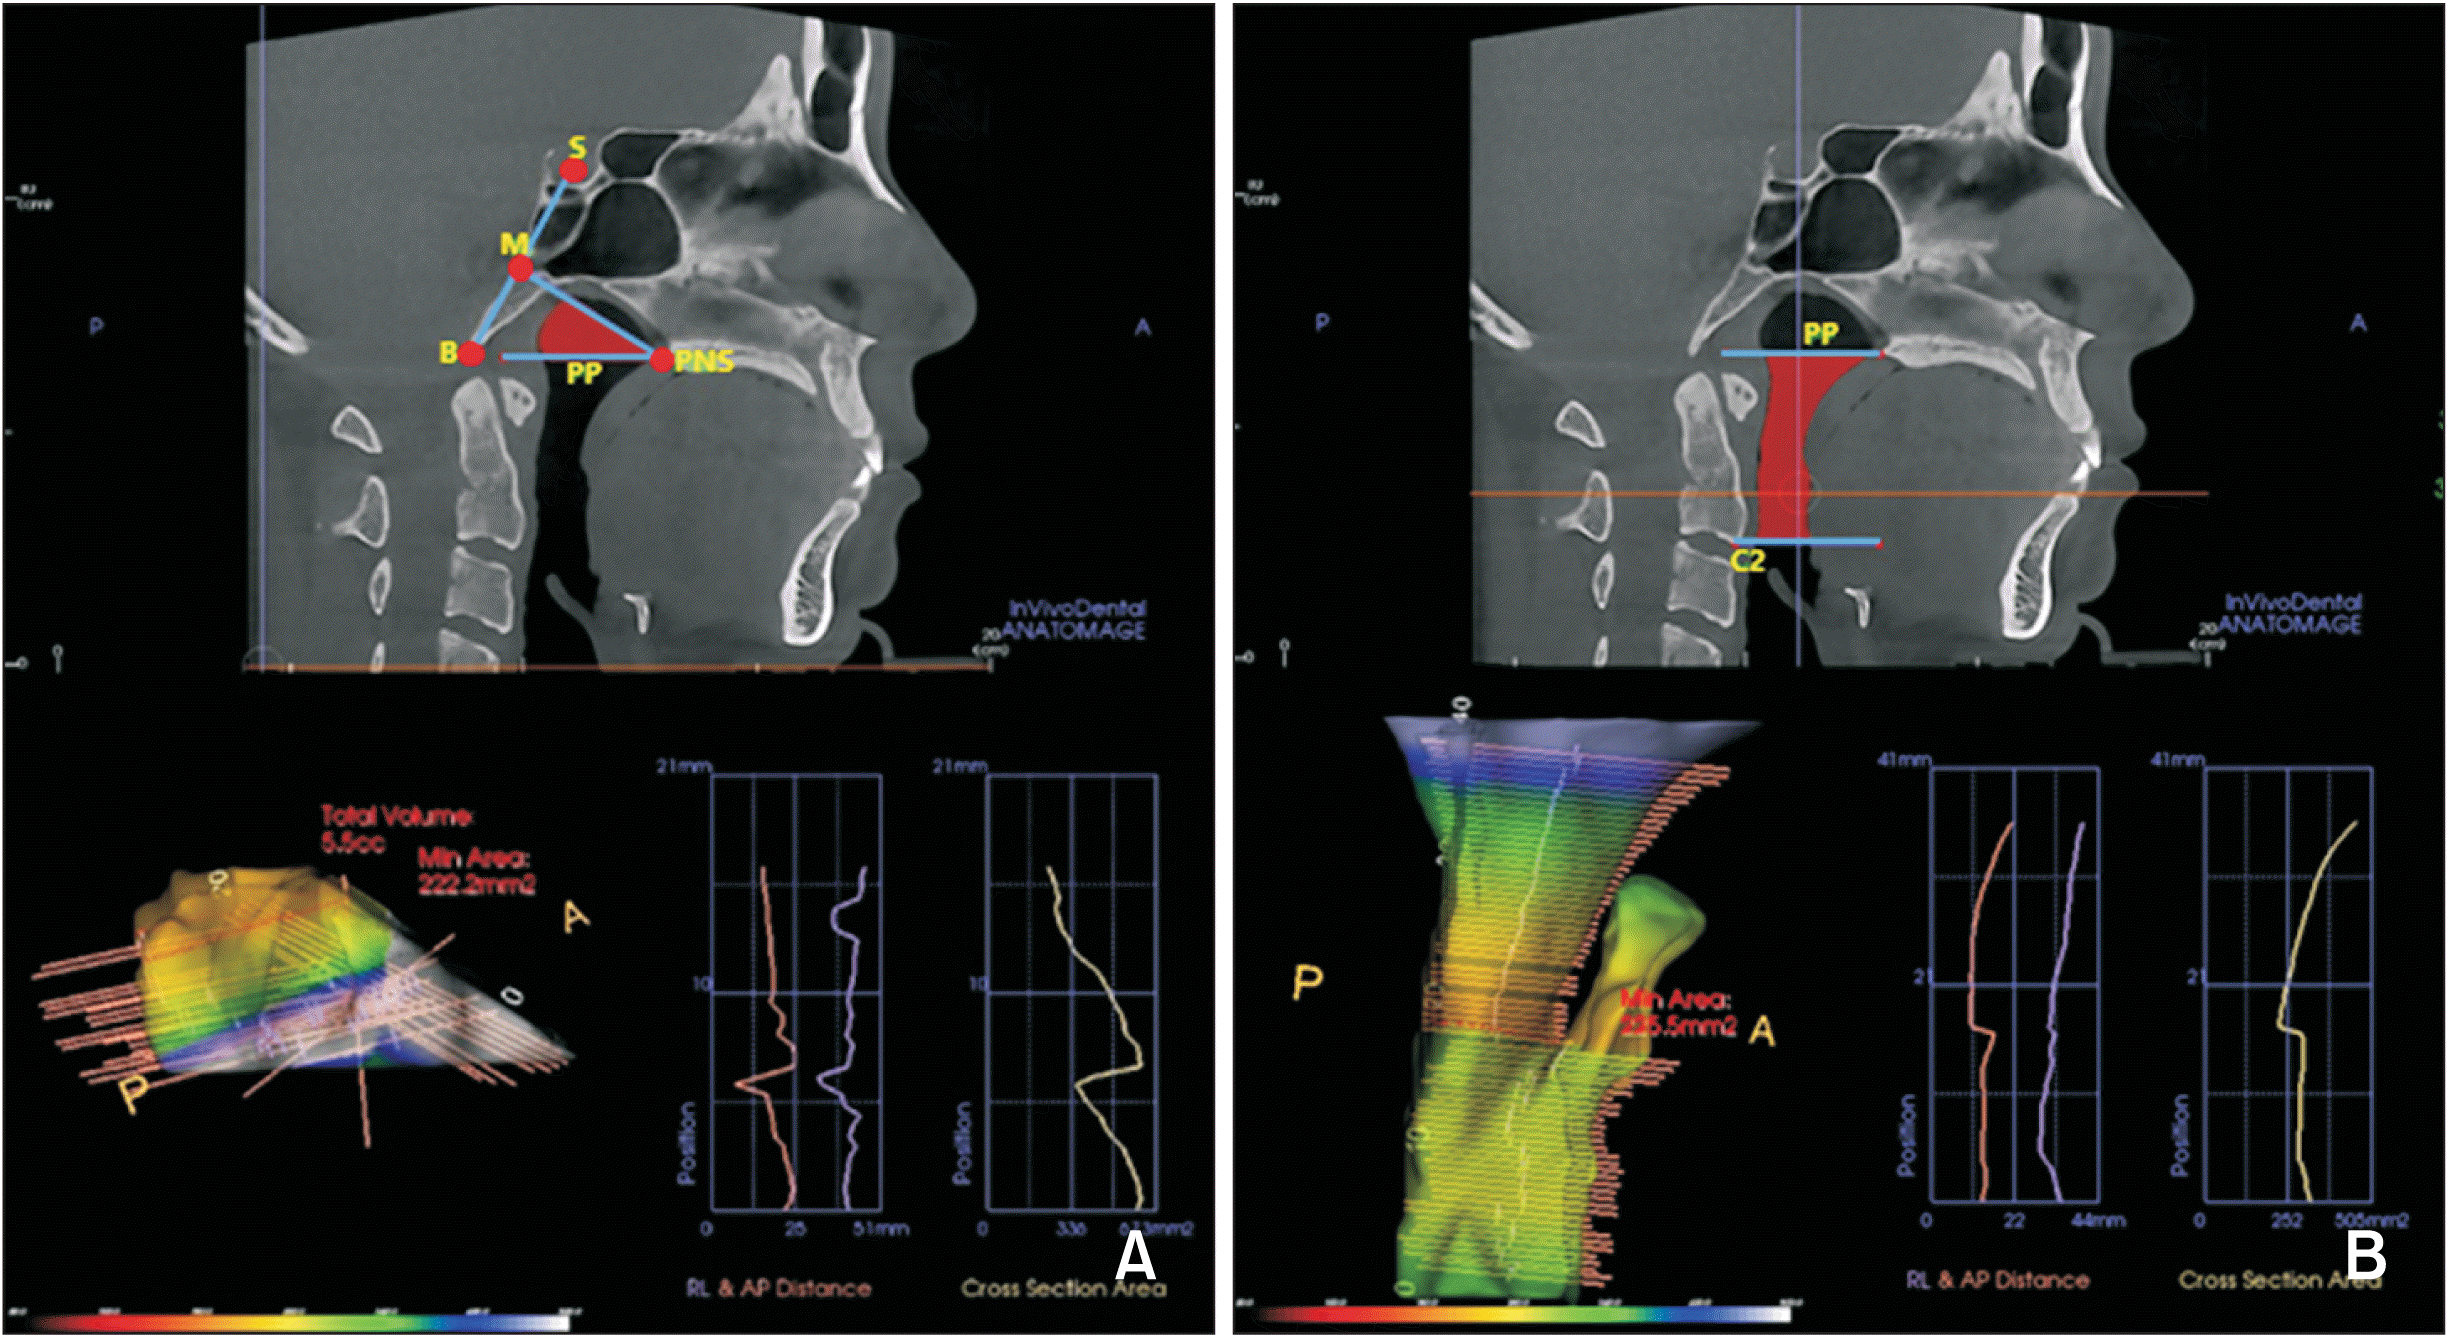
The measurements selected for the airway dimensional assessment were as follow: NPV, OPV, TAV, and minimum cross-sectional area (MCA). All measurements were performed with Invivo software ver. 5.2 (Anatomage, San Jose, CA, USA).
The upper boundary of the nasopharynx was delineated by a line connecting posterior nasal spine (PNS) and the midpoint of the sella-basion line and the lower border was the palatal plane (Figure 1A).9 The upper border of the oropharynx was set as the lower limit of the nasopharynx, and its lower boundary was established as the line collateral to the palatal plane, bisecting the anterior and lowermost tip of the second cervical vertebrae (C2) (Figure 1B).11
Twenty percent of the CBCT images were randomly extracted, and the same investigator re-measured the values after a 1-month interval and the intra-class coefficient results were 0.97.

Statistical analysis

IBM SPSS ver. 25 (IBM Corp., Armonk, NY, USA) was used. Regression models were obtained through multiple linear regression analyses to identify which of the independent variables were good predictors for airway variables. Significant factors were analyzed using two-way multivariate analysis of variance (MANOVA) test to elucidate the interaction between variables, after which the Fisher least significant difference analysis was conducted for multiple comparisons. The t-tests were used to compare the data between male and female. For intrajudge reliability, landmark identification was fulfilled twice by the 1-month time interval and intraclass correlation (ICC) value was 0.97.

RESULTS

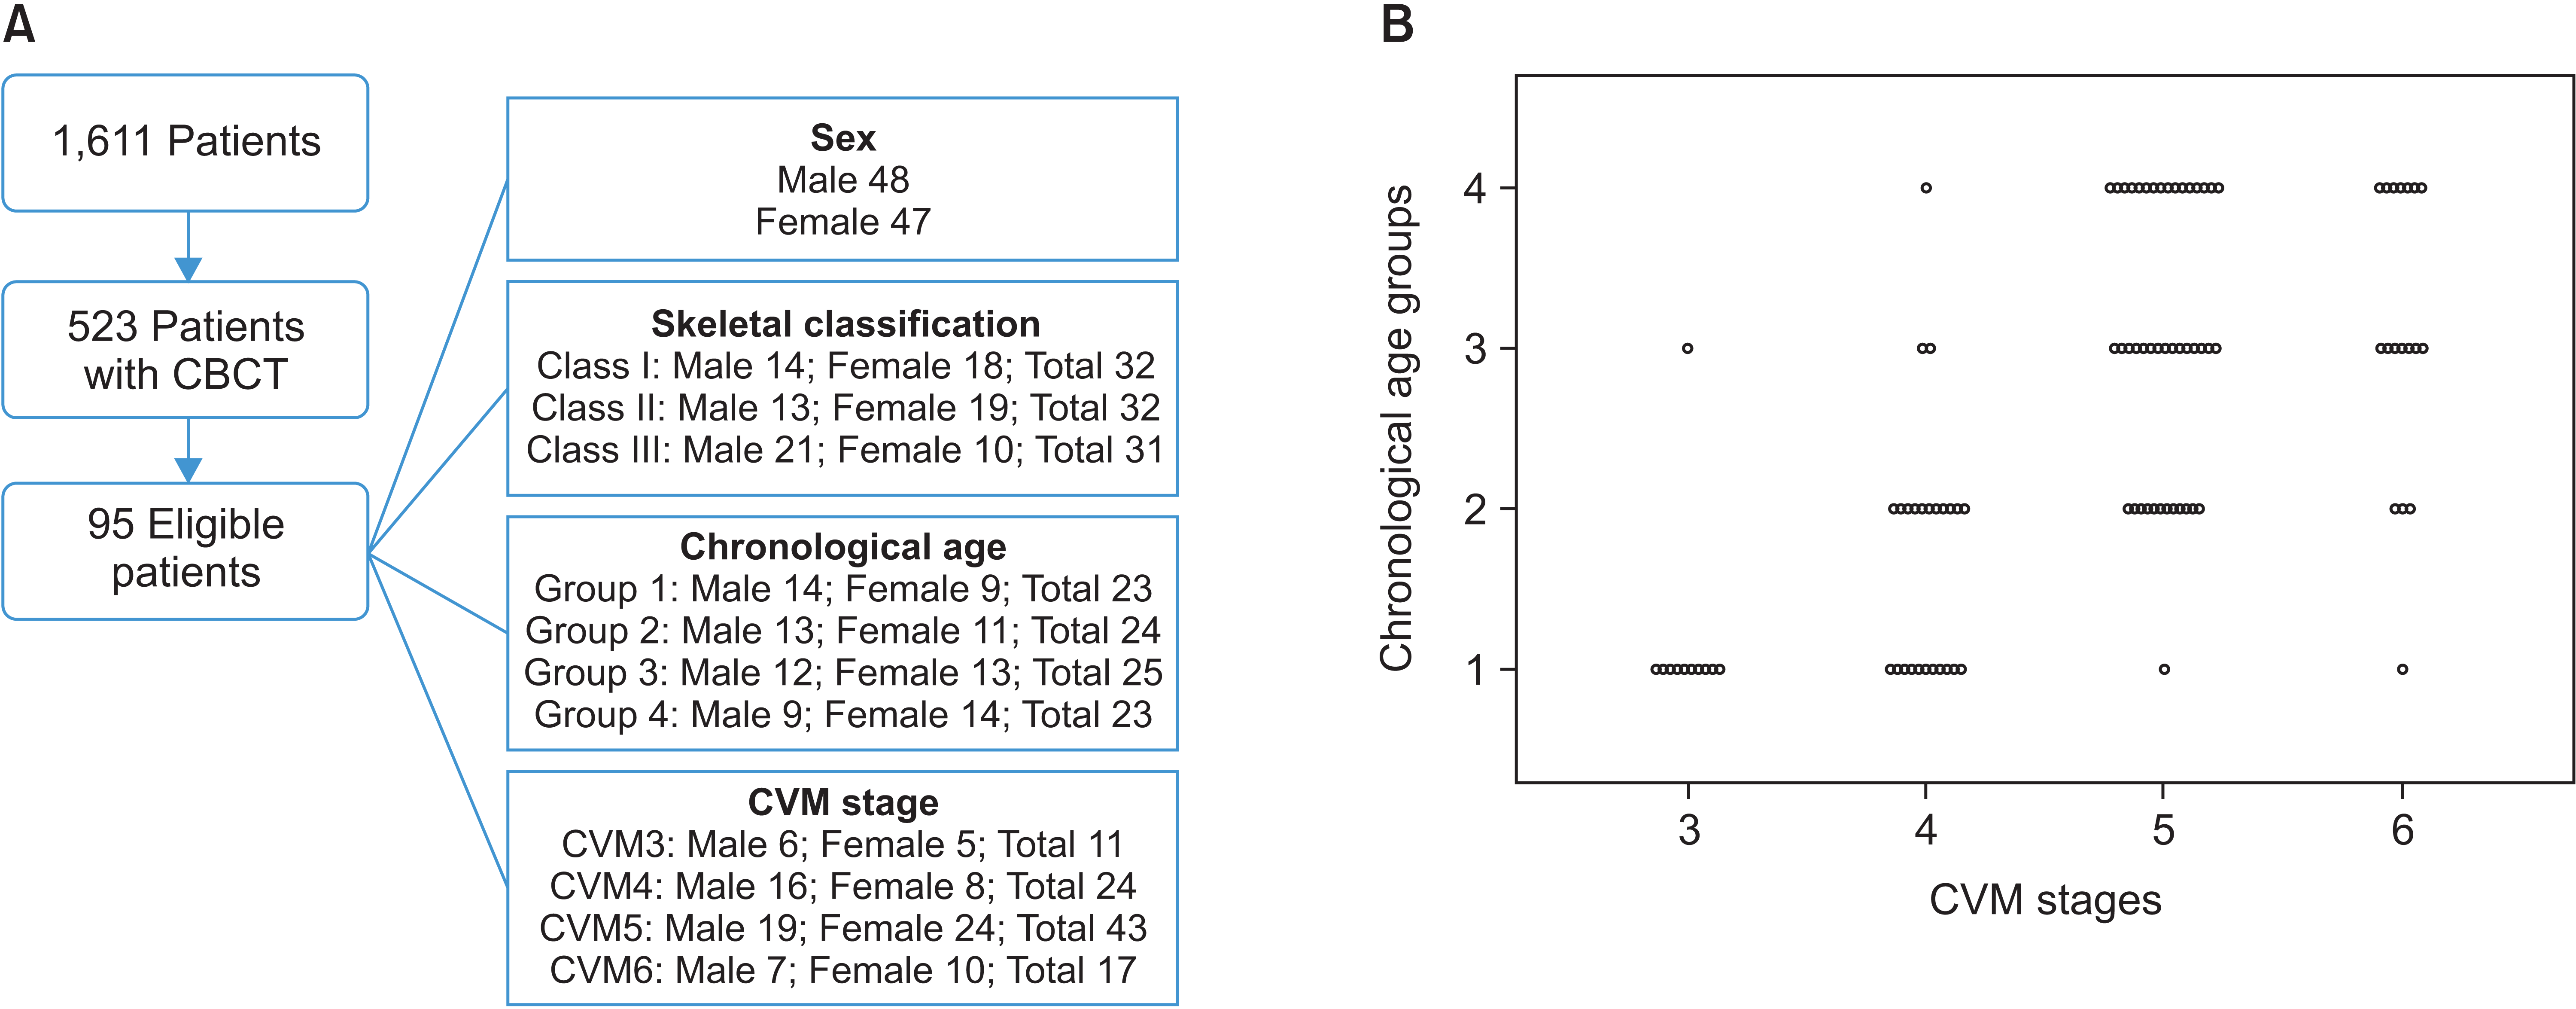
The subject distribution is shown in Figure 2. The sample were distributed into two sex groups: 47 females and 48 males; three skeletal pattern groups: 32 Class I (14 male, 18 female), 32 Class II (13 male, 19 female), and 31 Class III (21 male, 10 female); and four CVM stages: stage 3 (n = 11), stage 4 (n = 24), stage 5 (n = 43), and stage 6 (n = 17). The sample size was too small when it was divided according to chronological age (8 groups, 12–19 years of age); as such, each group was made of individuals of two consecutive ages as follows: group 1 (n = 23), group 2 (n = 24), group 3 (n = 25), and group 4 (n = 23) with the age ranged 12–13, 14–15, 16–17, and 18–19, respectively.
The results of multiple regression analysis are shown in Table 1. Age, CVM, and SNB have significant effects on all airway volume variables while skeletal pattern has no significant influence on these variables. Sex has significant effect on OPV and TAV while no significant effect was found on NPV. For MCA, no significant effect was found except for ANB angle.
The results of two-way MANOVA analysis of the interaction between age group, CVM and sex on the airway volume variable are shown in Table 2. No significant interaction was found between those variable, except for the interaction between age and sex on NPV.
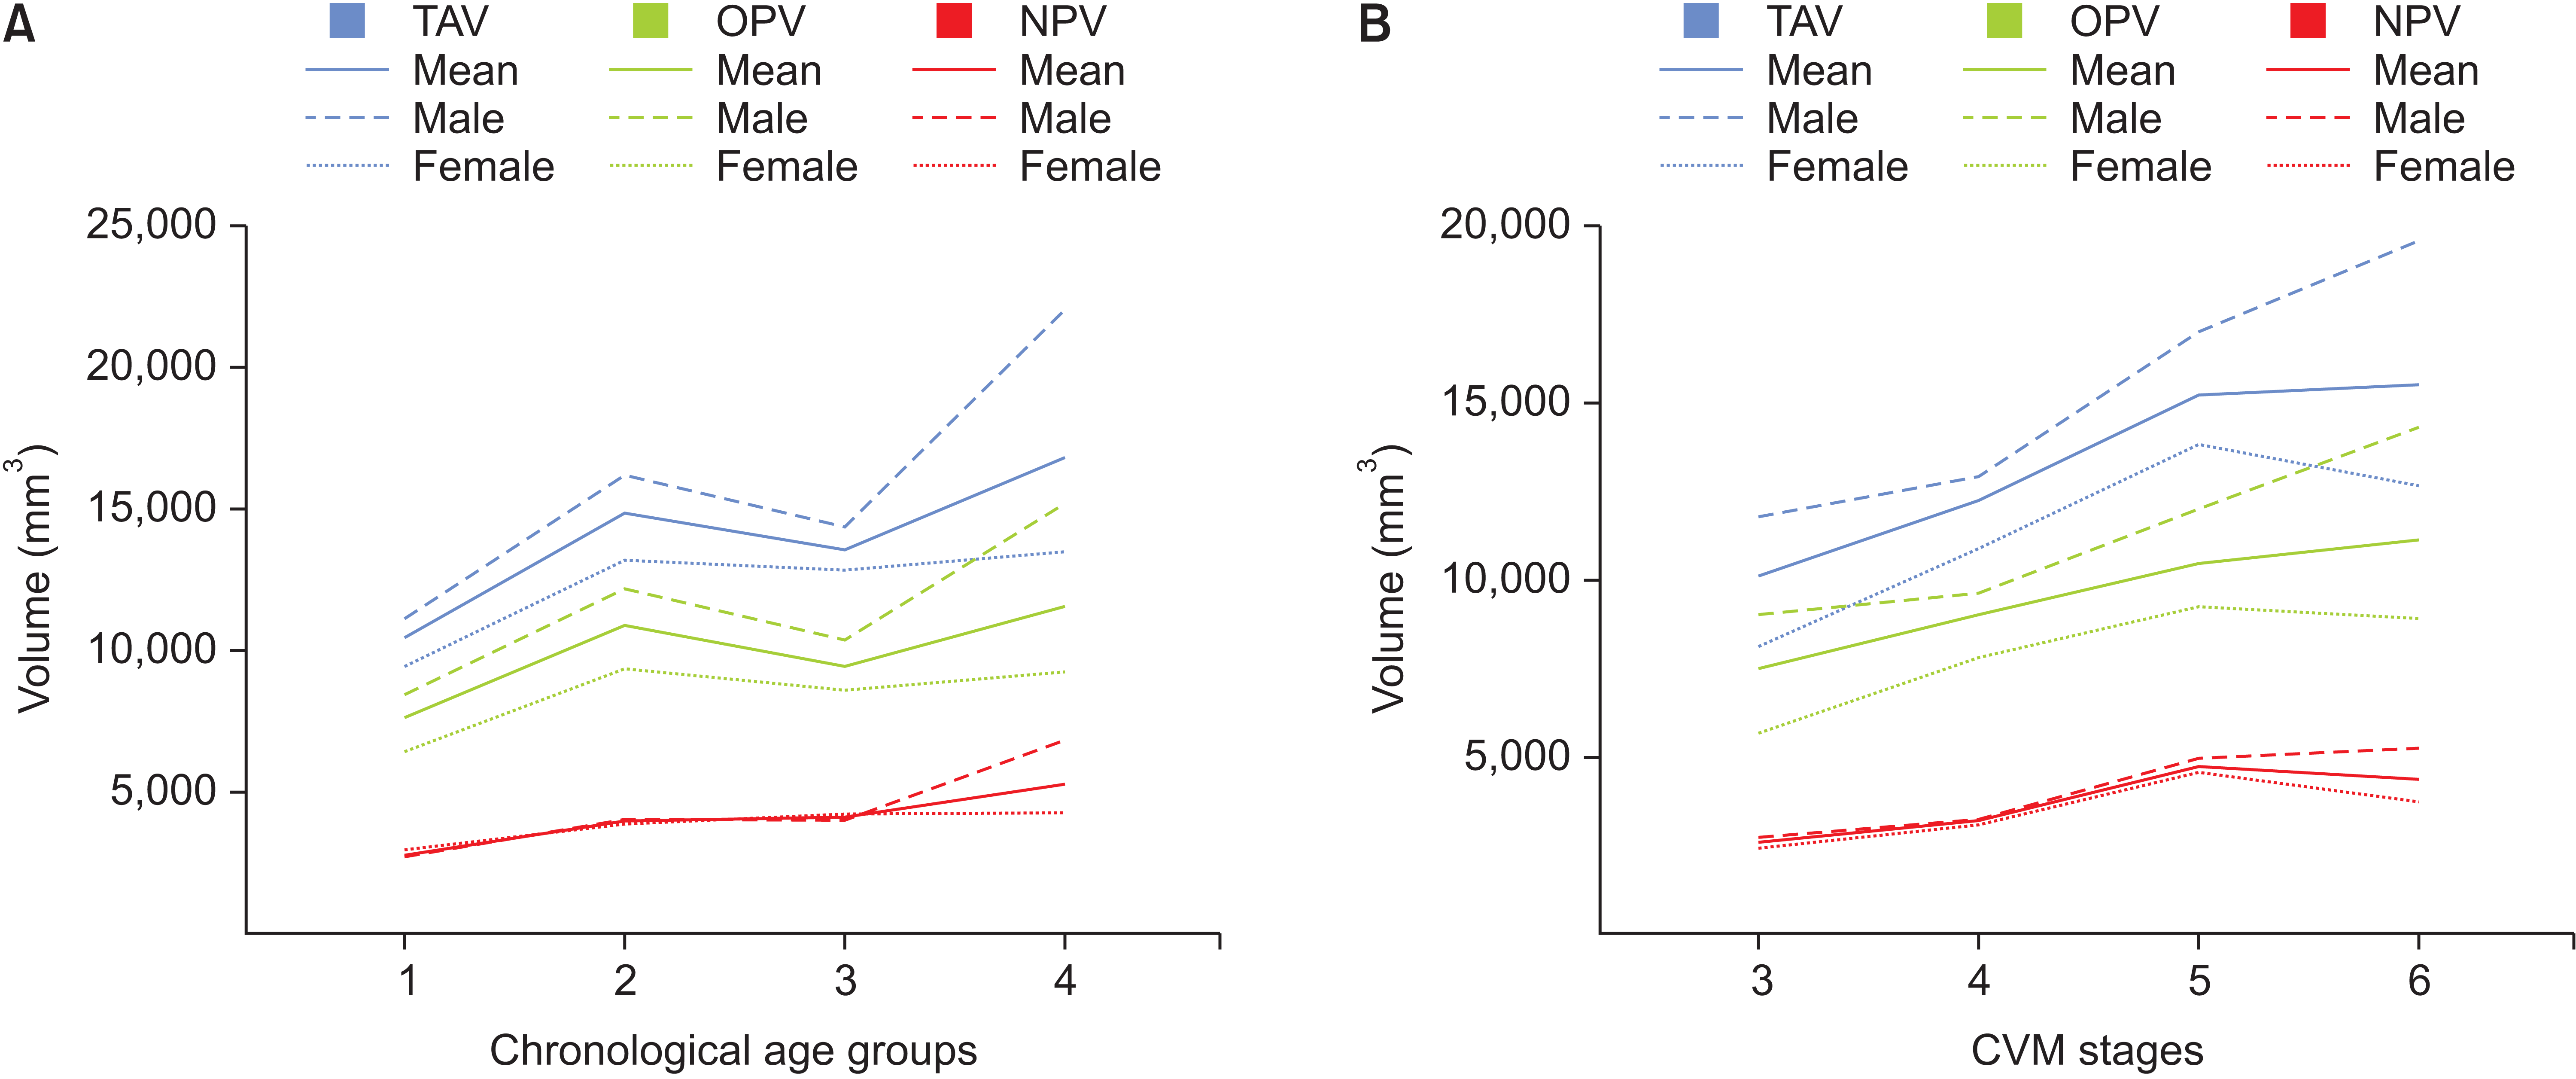
Descriptive statistics according to age groups and comparisons between sexes are shown in Table 3. There were no sex differences in age groups 1 and 3 but there were significant sex differences in NPV, OPV, TAV, and MCA in group 4. Multiple comparisons according to age group are shown in Table 4 and illustrated in Figure 3A. Comparisons in male subjects revealed more differences between age groups, with considerable increments from group 1 to group 2 and from group 3 to group 4; on the other hand, there were no significant differences between the different age groups in females.
Descriptive statistics according to CVM stages and comparisons between sexes are shown in Table 5. There were no significant sex differences at CVM stages 3, 4, and 5 and significant sex differences in OPV, TAV, and MCA at stage 6. Multiple comparisons according to CVM stages are shown in Table 6. Male and female subjects showed different patterns of change. As illustrated in Figure 3B, the values in males kept increasing from CVM stages 3 to 6, whereas in females, the values reached their peak at stage 5 and changed slightly from stage 5 to stage 6. However, statistically significant changes were found only between stage 4 and stage 5.

DISCUSSION

Airway is assumed to be involved in the development of dentofacial complex that causes malocclusion.11 In order to achieve esthetics and function at the same time through orthodontic treatment, it is very critical to evaluate airway dimension among various sagittal/vertical craniofacial structures of growing patients. Although there have been some studies that have assessed airway volumes in adolescents, the data have not been conclusive in terms of the effect of skeletal patterns and sex on airway volumes. Most studies14,15,17 evaluated airway volumes according to chronological age, and only a few studies21,22 used skeletal age. In our study, airway volumes were analyzed based on skeletal patterns, sex, and chronological and skeletal age.
ANB angle was the most commonly used cephalometric measurement to determine the sagittal relationship of the jaws. Based on this classification, the results from some studies15,25 have shown that skeletal patterns do not influence airway volumes. In our study, the conventional classification of skeletal patterns has no effect on airway volumes but skeletal structure will show the effect when other skeletal parameters were taken into account. Some previous studies9,10 have shown that Class II subjects had smaller NPV and OPV volumes and it seems to be an agreement on the relationship between mandibular position and the airway volume.10,11
Although most previous studies11,13 have shown that there are no significant sex differences in airway volumes, one large sample-sized study reported that male patients had greater volumes compared to female patients.14 Chan et al.,15 in a recent study, showed that male subjects had greater NPV volumes, but no significant sex difference was observed for OPV and TAV. In our study, the mean values of airway volumes was higher in male than in female but significant difference only found in later age or CVM stage. It is quite difficult to see the sex effect with the large variability of the data, which also may be affected by age, and skeletal structure. However, it seems that the sex effect will be clearer at the end of growing stage.
Growth studies have shown that skeletal age is more closely associated with pubertal growth spurts than chronological age.26 However, there are only a few studies that correlate airway volumes to skeletal age. Recently, Abdalla et al.,20 in a report on growing Class II skeletal subjects, proposed that skeletal age is more closely associated with airway development compared with chronological age, whereas Vuong and Kang21 doubted the relevance of CVM staging in terms of airway volume measurements.
In our cross-sectional study, all skeletal Classes I, II, and III were included and our results have provided more information about airway development in adolescents. As shown in Figure 3, NPV, OPV, and TAV increased gradually from CVM stage 3 to stage 6. For female subjects, it increased gradually and reached its peak at stage 5, whereas in male subjects it kept increasing until stage 6. Similarly, with chronological age, male and female subjects showed a similar pattern of change from group 1 to group 2. It then increased considerably in males from group 3 to group 4, whereas in females, the values remained quite stable from group 2 to group 4. This corresponds to the findings of Chiang at al.,14 wherein they reported that females do not show further lengthening of the airway after age 15, whereas in males, it continues to increase.
Vuong and Kang21 found a steady increment from CVM stage 1 to 5, which corresponds with our results, but they also found an apparent drop in airway volumes at stage 6. This pattern differs from our study, and this could be due to the different sample characteristics in both studies. In that study,21 only subjects aged 9–15 years were selected, whereas our study had a different age range, 12–19 years of age. Many studies have reported that airways continue to grow until 20 years of age.14,19,22,25 From our results, the mean value of the airway volume is higher in males than in females but the differences were statistically significant only in group 4 (aged 18–19) and CVM stage 6.

Limitations

Airway volume of growing patients can be changed by natural growth and orthodontic treatment as well as mandibular advancement devices for helping sleep-disordered breathing in orthodontic practices. We are only interested in understanding the association between airway volume and skeletal pattern, developmental stage and sex through 3D measurements as a baseline, which is a limitation of our study.
In addition, as a cross-sectional study, our study has limitations in providing evidence-based data for examining the changes of airway according to the CVM stage and chronological age individually. Therefore, longitudinal studies need to be conducted in the future.

CONCLUSIONS

1. Skeletal patterns have an effect on airway volumes.
2. The mean value of the airway volume is higher in males than in females, and statistically significant differences were found at CVM stage 6.
3. Females reach the highest airway volume at CVM stage 5, whereas males increase their volume consistently until CVM stage 6.

SUPPLEMENTAL VIDEO

A video presentation of this article is available at https://youtu.be/HJ7s9xmTsV4 or www.e-kjo.org.

ACKNOWLEDGEMENTS

This research was supported by Kyungpook National University Research Fund, 2020.

Notes

CONFLICTS OF INTEREST

No potential conflict of interest relevant to this article was reported.

REFERENCES

1. Silva MA, Wolf U, Heinicke F, Bumann A, Visser H, Hirsch E. 2008; Cone-beam computed tomography for routine orthodontic treatment planning: a radiation dose evaluation. Am J Orthod Dentofacial Orthop. 133:640.e1–5. DOI: 10.1016/j.ajodo.2007.11.019. PMID: 18456133. PMID: https://www.scopus.com/inward/record.uri?partnerID=HzOxMe3b&scp=43049170124&origin=inward.
2. Quan SF, Schmidt-Nowara W. 2017; The role of dentists in the diagnosis and treatment of obstructive sleep apnea: consensus and controversy. J Clin Sleep Med. 13:1117–9. DOI: 10.5664/jcsm.6748. PMID: 28942761. PMCID: PMC5612624. PMID: https://www.scopus.com/inward/record.uri?partnerID=HzOxMe3b&scp=85031687541&origin=inward.
3. Huynh NT, Morton PD, Rompré PH, Papadakis A, Remise C. 2011; Associations between sleep-disordered breathing symptoms and facial and dental morphometry, assessed with screening examinations. Am J Orthod Dentofacial Orthop. 140:762–70. DOI: 10.1016/j.ajodo.2011.03.023. PMID: 22133940. PMID: https://www.scopus.com/inward/record.uri?partnerID=HzOxMe3b&scp=82455203929&origin=inward.
4. Behrents RG, Shelgikar AV, Conley RS, Flores-Mir C, Hans M, Levine M, et al. 2019; Obstructive sleep apnea and orthodontics: an American Association of Orthodontists White Paper. Am J Orthod Dentofacial Orthop. 156:13–28.e1. DOI: 10.1016/j.ajodo.2019.04.009. PMID: 31256826. PMID: https://www.scopus.com/inward/record.uri?partnerID=HzOxMe3b&scp=85067785682&origin=inward.
5. Joy A, Park J, Chambers DW, Oh H. 2020; Airway and cephalometric changes in adult orthodontic patients after premolar extractions. Angle Orthod. 90:39–46. DOI: 10.2319/021019-92.1. PMID: 31403835. PMCID: PMC8087059. PMID: https://www.scopus.com/inward/record.uri?partnerID=HzOxMe3b&scp=85077403366&origin=inward.
6. Katyal V, Pamula Y, Martin AJ, Daynes CN, Kennedy JD, Sampson WJ. 2013; Craniofacial and upper airway morphology in pediatric sleep-disordered breathing: systematic review and meta-analysis. Am J Orthod Dentofacial Orthop. 143:20–30.e3. DOI: 10.1016/j.ajodo.2012.08.021. PMID: 23273357. PMID: https://www.scopus.com/inward/record.uri?partnerID=HzOxMe3b&scp=84871872030&origin=inward.
7. Angle EH. 1907. greatly enl. and entirely rewritten, with six hundred and forty-one illustrations. Treatment of malocclusion of the teeth. Angle's system. 7th ed.S.S. White dental manufacturing Co.;Philadelphia:
8. Feng X, Li G, Qu Z, Liu L, Näsström K, Shi XQ. 2015; Comparative analysis of upper airway volume with lateral cephalograms and cone-beam computed tomography. Am J Orthod Dentofacial Orthop. 147:197–204. DOI: 10.1016/j.ajodo.2014.10.025. PMID: 25636553. PMID: https://www.scopus.com/inward/record.uri?partnerID=HzOxMe3b&scp=84922791131&origin=inward.
9. Claudino LV, Mattos CT, Ruellas AC, Sant' Anna EF. 2013; Pharyngeal airway characterization in adolescents related to facial skeletal pattern: a preliminary study. Am J Orthod Dentofacial Orthop. 143:799–809. DOI: 10.1016/j.ajodo.2013.01.015. PMID: 23726330. PMID: https://www.scopus.com/inward/record.uri?partnerID=HzOxMe3b&scp=84878485351&origin=inward.
10. Hong JS, Oh KM, Kim BR, Kim YJ, Park YH. 2011; Three-dimensional analysis of pharyngeal airway volume in adults with anterior position of the mandible. Am J Orthod Dentofacial Orthop. 140:e161–9. DOI: 10.1016/j.ajodo.2011.04.020. PMID: 21967954. PMID: https://www.scopus.com/inward/record.uri?partnerID=HzOxMe3b&scp=80053521948&origin=inward.
11. El H, Palomo JM. 2011; Airway volume for different dentofacial skeletal patterns. Am J Orthod Dentofacial Orthop. 139:e511–21. DOI: 10.1016/j.ajodo.2011.02.015. PMID: 21640863. PMID: https://www.scopus.com/inward/record.uri?partnerID=HzOxMe3b&scp=79958020949&origin=inward.
12. Brito FC, Brunetto DP, Nojima MCG. 2019; Three-dimensional study of the upper airway in different skeletal Class II malocclusion patterns. Angle Orthod. 89:93–101. DOI: 10.2319/112117-806.1. PMID: 30230378. PMCID: PMC8137119. PMID: https://www.scopus.com/inward/record.uri?partnerID=HzOxMe3b&scp=85060030308&origin=inward.
13. Zheng ZH, Yamaguchi T, Kurihara A, Li HF, Maki K. 2014; Three-dimensional evaluation of upper airway in patients with different anteroposterior skeletal patterns. Orthod Craniofac Res. 17:38–48. DOI: 10.1111/ocr.12029. PMID: 24033888. PMID: https://www.scopus.com/inward/record.uri?partnerID=HzOxMe3b&scp=84892482585&origin=inward.
14. Chiang CC, Jeffres MN, Miller A, Hatcher DC. 2012; Three-dimensional airway evaluation in 387 subjects from one university orthodontic clinic using cone beam computed tomography. Angle Orthod. 82:985–92. DOI: 10.2319/122811-801.1. PMID: 22668315. PMCID: PMC8813138. PMID: https://www.scopus.com/inward/record.uri?partnerID=HzOxMe3b&scp=84869465626&origin=inward.
15. Chan L, Kaczynski R, Kang HK. 2020; A cross-sectional retrospective study of normal changes in the pharyngeal airway volume in white children with 3 different skeletal patterns from age 9 to 15 years: part 1. Am J Orthod Dentofacial Orthop. 158:710–21. DOI: 10.1016/j.ajodo.2019.10.019. PMID: 32828607. PMID: https://www.scopus.com/inward/record.uri?partnerID=HzOxMe3b&scp=85089592257&origin=inward.
16. McNamara JA Jr, Franchi L. 2018; The cervical vertebral maturation method: a user's guide. Angle Orthod. 88:133–43. DOI: 10.2319/111517-787.1. PMID: 29337631. PMCID: PMC8312535. PMID: https://www.scopus.com/inward/record.uri?partnerID=HzOxMe3b&scp=85043601438&origin=inward.
17. Srinivasan B, Padmanabhan S, Chitharanjan AB. 2018; Constancy of cervical vertebral maturation indicator in adults: a cross-sectional study. Int Orthod. 16:486–98. DOI: 10.1016/j.ortho.2018.06.015. PMID: 30006077.
18. Fernandes-Retto P, Matos D, Ferreira M, Bugaighis I, Delgado A. 2019; Cervical vertebral maturation and its relationship to circum-pubertal phases of the dentition in a cohort of Portuguese individuals. J Clin Exp Dent. 11:e642–9. DOI: 10.4317/jced.55907. PMID: 31516663. PMCID: PMC6731008. PMID: https://www.scopus.com/inward/record.uri?partnerID=HzOxMe3b&scp=85072766548&origin=inward.
19. Schendel SA, Jacobson R, Khalessi S. 2012; Airway growth and development: a computerized 3-dimensional analysis. J Oral Maxillofac Surg. 70:2174–83. DOI: 10.1016/j.joms.2011.10.013. PMID: 22326177. PMID: https://www.scopus.com/inward/record.uri?partnerID=HzOxMe3b&scp=84865245434&origin=inward.
20. Abdalla Y, Brown L, Sonnesen L. 2020; Effects of a fixed functional appliance on upper airway volume: a 3-dimensional cone-beam computed tomography study. Am J Orthod Dentofacial Orthop. 158:40–9. DOI: 10.1016/j.ajodo.2019.07.013. PMID: 32389570. PMID: https://www.scopus.com/inward/record.uri?partnerID=HzOxMe3b&scp=85084399313&origin=inward.
21. Vuong L, Kang HK. 2021; A cross-sectional retrospective study of normal changes in the pharyngeal airway volume in white children with different skeletal patterns. Part 2: cervical vertebral maturation method and hyoid bone. Am J Orthod Dentofacial Orthop. 159:e377–88. DOI: 10.1016/j.ajodo.2020.10.024. PMID: 33583695. PMID: https://www.scopus.com/inward/record.uri?partnerID=HzOxMe3b&scp=85100722059&origin=inward.
22. Akarsu-Guven B, Karakaya J, Ozgur F, Aksu M. 2019; Upper airway features of unilateral cleft lip and palate patients in different growth stages. Angle Orthod. 89:575–82. DOI: 10.2319/022518-155.1. PMID: 30694706. PMCID: PMC8117190. PMID: https://www.scopus.com/inward/record.uri?partnerID=HzOxMe3b&scp=85068490817&origin=inward.
23. Kim JY, Lee SJ, Kim TW, Nahm DS, Chang YI. 2005; Classification of the skeletal variation in normal occlusion. Angle Orthod. 75:311–9.
24. Cho HJ. 2009; A three-dimensional cephalometric analysis. J Clin Orthod. 43:235–52. discussion 235quiz 273PMID: 19458456. PMID: https://www.scopus.com/inward/record.uri?partnerID=HzOxMe3b&scp=68049089803&origin=inward.
25. Dalmau E, Zamora N, Tarazona B, Gandia JL, Paredes V. 2015; A comparative study of the pharyngeal airway space, measured with cone beam computed tomography, between patients with different craniofacial morphologies. J Craniomaxillofac Surg. 43:1438–46. DOI: 10.1016/j.jcms.2015.06.016. PMID: 26189145. PMID: https://www.scopus.com/inward/record.uri?partnerID=HzOxMe3b&scp=84941904284&origin=inward.
26. Fishman LS. 1979; Chronological versus skeletal age, an evaluation of craniofacial growth. Angle Orthod. 49:181–9. DOI: 10.1043/0003-3219(1979)049<0181:CVSAAE>2.0.CO;2. PMID: 225970.

Figure 1
Demonstration of airway volumes. A, Nasopharyngeal volumes. B, Oropharyngeal volumes.
PNS, posterior nasal spine; S, sella point; B, basion point; M, the midpoint of sella-basion line; PP, palatal plane; C2, the lowermost anterior point of the second cervical vertebrae.
kjod-52-5-345-f1.tif
Figure 2
A, Patient selection process and subject distribution. B, Subject distribution according to age and CVM stages.
CBCT, cone-beam computed tomography; CVM, cervical vertebral maturation.
kjod-52-5-345-f2.tif
Figure 3
A, Changes in airway volumes across age groups. B, Changes in airway volumes across growth stages.
TAV, total pharyngeal airway volume; OPV, oropharyngeal volumes; NPV, nasopharyngeal volumes; CVM, cervical vertebral maturation.
kjod-52-5-345-f3.tif
Table 1
Results of the multiple regression to identify variables that influence airway volumes
Variables NPV OPV TAV MCA Variables NPV OPV TAV MCA
Adjusted R2 0.323 0.208 0.266 0.124 Adjusted R2 0.248 0.206 0.245 0.124
Independent variable Independent variable
Age group < 0.001*** 0.004** < 0.001*** 0.988 CVM < 0.001*** 0.005** 0.001** 0.995
Sex 0.926 0.004** 0.008** 0.940 Sex 0.929 0.005** 0.012* 0.940
Skeletal pattern 0.742 0.733 0.733 0.293 Skeletal pattern 0.937 0.918 0.918 0.749
ANB 0.634 0.616 0.616 <0.001*** ANB 0.636 0.620 0.620 < 0.001***
SNA 0.490 0.477 0.477 0.983 SNA 0.492 0.480 0.480 0.983
SNB < 0.001*** 0.004** 0.002** 0.638 SNB 0.001** 0.007** 0.002** 0.638
FMA 0.857 0.805 0.805 0.913 FMA 0.849 0.791 0.791 0.913

NPV, nasopharyngeal volumes; OPV, oropharyngeal volumes; TAV, total pharyngeal airway volume; MCA, minimum cross-sectional area; ANB, A point-nasion-B point; SNA, sella-nasion-A point; SNB, sella-nasion-B point; FMA, Frankfort mandibular plane angle.

*p < 0.05; **p < 0.01; ***p < 0.001.

Table 2
Two-way MANOVA analysis of the interaction between age groups, CVM and sex on the airway volumes
Variables NPV OPV TAV Variables NPV OPV TAV
Age group < 0.001*** 0.002** < 0.001*** CVM < 0.001*** 0.031* 0.002**
Sex 0.046* < 0.001*** 0.001** Sex 0.088 0.001** 0.002**
Age × Sex 0.001** 0.311 0.068 CVM × Sex 0.530 0.631 0.539

MANOVA, multivariate analysis of variance; CVM, cervical vertebral maturation; NPV, nasopharyngeal volumes; OPV, oropharyngeal volumes; TAV, total pharyngeal airway volume.

*p < 0.05; **p < 0.01; ***p < 0.001.

Table 3
Descriptive statistics according to chronological age groups and comparisons between sexes
Chronological age groups Total N Male N Female N p-value
NPV
1 2,830.43 ± 1,031.52 23 2,728.57 ± 962.71 14 2,988.89 ± 1,172.01 9 0.567
2 3,954.17 ± 1,313.47 24 4,046.15 ± 1,488.63 13 3,845.45 ± 1,133.46 11 0.718
3 4,112.00 ± 1,088.32 25 3,966.67 ± 710.10 12 4,246.15 ± 1,366.03 13 0.525
4 5,273.91 ± 2,167.99 23 6,855.56 ± 2,173.20 9 4,257.14 ± 1,484.13 14 0.003**
OPV
1 7,630.43 ± 3,789.39 23 8,392.86 ± 3,746.89 14 6,444.44 ± 3,751.70 9 0.237
2 10,858.33 ± 3,413.90 24 12,146.15 ± 4,001.59 13 9,336.36 ± 1,698.98 11 0.042*
3 9,468.00 ± 3,541.98 25 10,400.00 ± 3,536.31 12 8,607.69 ± 3,457.95 13 0.213
4 11,534.78 ± 6,250.94 23 15,122.22 ± 7,365.42 9 9,228.57 ± 4,254.85 14 0.023*
TAV
1 10,460.87 ± 4,410.81 23 11,121.43 ± 4,346.74 14 9,433.33 ± 4,565.91 9 0.383
2 14,812.50 ± 4,133.78 24 16,192.31 ± 4,862.18 13 13,181.82 ± 2,352.37 11 0.064
3 13,580.00 ± 4,157.32 25 14,366.67 ± 3,687.16 12 12,853.85 ± 4,573.22 13 0.375
4 16,808.70 ± 7,900.51 23 21,977.78 ± 8,924.09 9 13,485.71 ± 5,121.73 14 0.008**
MCA
1 159.63 ± 77.82 23 167.94 ± 82.85 14 146.71 ± 72.05 9 0.536
2 193.63 ± 66.82 24 209.01 ± 74.07 13 175.45 ± 54.90 11 0.228
3 173.44 ± 86.14 25 175.99 ± 90.55 12 171.08 ± 85.50 13 0.890
4 223.13 ± 139.30 23 310.82 ± 171.16 9 166.76 ± 77.88 14 0.039*

Values are presented as mean ± standard deviation or number only.

The t-tests were used to compare between males and females.

NPV, nasopharyngeal volumes; OPV, oropharyngeal volumes; TAV, total pharyngeal airway volume; MCA, minimum cross-sectional area.

*p < 0.05; **p < 0.01.

Table 4
Post-hoc analysis of airway volumes by age groups
Age
groups
(J)
Age groups (I)
Total Male Female
2 3 4 2 3 4 2 3 4
Mean difference of NPV volumes between age groups (I-J)
1 1,123.73** 1,281.56** 2,443.48*** 1,317.58* 1,238.09* 4,126.98*** 856.56 1,257.26* 1,268.25*
2 157.83 1,319.75** −79.48 2,809.40*** 400.69 411.68
3 1,161.91** 2,888.88*** 10.98
Mean difference of OPV volumes between age groups (I-J)
1 3,227.90** 1,837.56 3,904.35** 3,753.29* 2,007.14 6,729.36** 2,891.91 2,163.24 2,784.12
2 −1,390.33 676.45 −1,746.15 2,976.06 −728.67 −107.79
3 2,033.78 4,722.22* 620.87
Mean difference of TAV volumes between age groups (I-J)
1 4,351.63* 3,119.13* 6,347.83*** 5,070.87* 3,245.23 10,856.34*** 3,748.48 3,420.51 4,052.38*
2 −1,232.5 1,996.19 −1,825.64 5,785.47* −327.97 303.89
3 3,228.69* 7,611.11** 631.86

The post-hoc test (Fisher least significant difference) was conducted to compare each group with each other.

NPV, nasopharyngeal volumes; OPV, oropharyngeal volumes; TAV, total pharyngeal airway volume.

I represents age groups 2, 3 and 4 shown in the column. J represents age groups 1, 2 and 3 shown in the row. I–J stands for the difference between age groups in rows and columns.

*p < 0.05; **p < 0.01; ***p < 0.001.

Table 5
Descriptive statistics according to CVM stages and comparisons between sexes
CVM
stages
Total N Male N Female N p-value
NPV
3 2,609.09 ± 915.92 11 2,750.00 ± 859.65 6 2,440.00 ± 1,052.62 5 0.603
4 3,212.50 ± 1,413.69 24 3,275.00 ± 1,558.85 16 3,087.50 ± 1,154.42 8 0.767
5 4,744.19 ± 1,489.54 43 4,968.42 ± 1,755.96 19 4,566.67 ± 1,250.62 24 0.386
6 4,370.59 ± 1,840.78 17 5,257.14 ± 2,439.85 9 3,750.00 ± 1,008.02 10 0.097
OPV
3 7,509.09 ± 4,038.43 11 9,033.33 ± 4,914.74 6 5,680.00 ± 1,706.46 5 0.166
4 9,020.83 ± 3,812.68 24 9,625.00 ± 3,520.32 16 7,812.50 ± 4,324.82 8 0.282
5 10,462.79 ± 4,767.40 43 12,005.26 ± 5,794.97 19 9,241.67 ± 3,420.64 24 0.058
6 11,123.53 ± 4,865.89 17 14,285.71 ± 5,104.71 9 8,910.00 ± 3,390.98 10 0.019*
TAV
3 10,118.18 ± 4,718.01 11 11,783.33 ± 5,651.70 6 8,120.00 ± 2,563.59 5 0.197
4 12,233.33 ± 4,806.22 24 12,900.00 ± 4,577.48 16 10,900.00 ± 5,286.91 8 0.348
5 15,206.98 ± 5,716.16 43 16,973.68 ± 6,989.26 19 13,808.33 ± 4,100.79 24 0.071
6 15,494.12 ± 6,281.67 17 19,542.86 ± 6,875.77 9 12,660.00 ± 4,118.04 10 0.021*
MCA
3 171.73 ± 85.70 11 190.78 ± 107.14 6 148.86 ± 53.07 5 0.448
4 158.44 ± 74.88 24 165.44 ± 66.23 16 144.44 ± 93.20 8 0.529
5 193.64 ± 104.02 43 216.73 ± 136.43 19 175.37 ± 66.34 24 0.237
6 221.67 ± 109.69 17 295.40 ± 104.61 9 170.06 ± 83.11 10 0.015*

Values are presented as mean ± standard deviation or number only.

The t-tests were used to compare between males and females.

CVM, cervical vertebral maturation; NPV, nasopharyngeal volumes; OPV, oropharyngeal volumes; TAV, total pharyngeal airway volume; MCA, minimum cross-sectional area.

*p < 0.05.

Table 6
Post-hoc analysis of airway volumes by CVM groups
CVM groups
(J)
CVM groups (I)
Total Male Female
4 5 6 4 5 6 4 5 6
Mean difference of NPV volumes between CVM groups (I-J)
3 603.4 2,135.09*** 1,761.49** 525 2,218.42** 2,507.14* 647.5 2,126.67** 1,310.00*
4 1,531.68*** 1,158.08* 1,693.42** 1,982.14* 1,479.16** 662.5
5 −373.59 288.72 −816.66
Mean difference of OPV volumes between CVM groups (I-J)
3 1,511.74 2,953.69* 3,614.43* 591.66 2,971.92 5,252.38 2,132.5 3,561.67* 3,230
4 1,441.95 2,102.69 2,380.26 4,660.71* 1,429.16 1,097.5
5 660.74 2,282.45 −331.66
Mean difference of TAV volumes between CVM groups (I-J)
3 2,115.15 5,088.79** 5,375.93* 1,116.66 5,190.35 7,759.52* 2,780 5,688.33** 4,540
4 2,973.64* 3,260.78 4,073.68 6,642.85* 2,908.33 1,760
5 287.14 2,569.17 −1,148.33

The post-hoc test (Fisher least significant difference) was conducted to compare each group with each other.

CVM, cervical vertebral maturation; NPV, nasopharyngeal volumes; OPV, oropharyngeal volumes; TAV, total pharyngeal airway volume.

I represents age groups 2, 3 and 4 shown in the column. J represents age groups 1, 2 and 3 shown in the row. I–J stands for the difference between age groups in rows and columns.

*p < 0.05; **p < 0.01; ***p < 0.001.

TOOLS
Similar articles