INTRODUCTION
CASE REPORT
Case 1
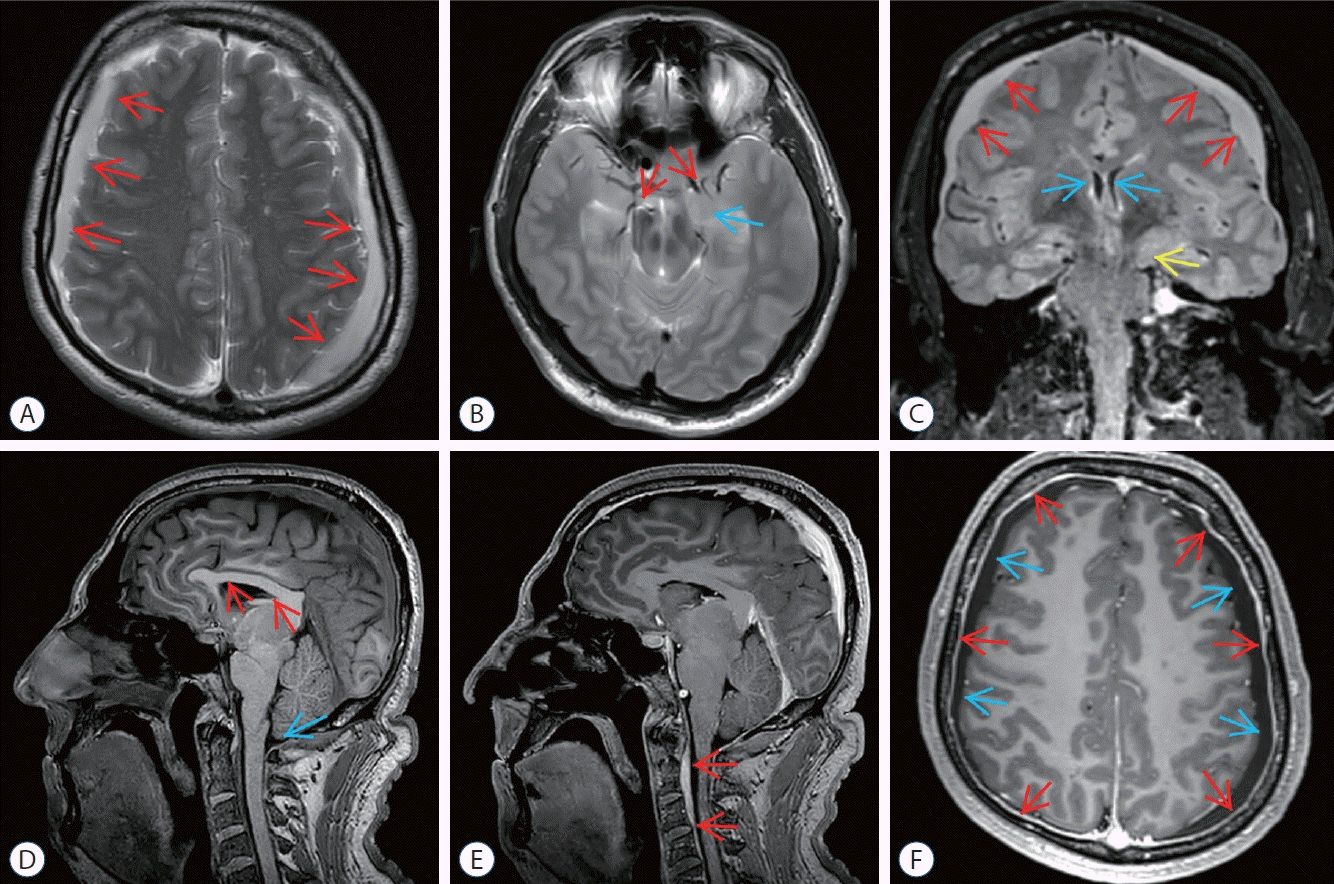
 | Fig. 1.Preoperative magnetic resonance imaging (MRI) of epidural blood patch (ebP)-refractory case 1. A : Axial T2-weighted MRI shows bilateral widening of subdural spaces and subdural hematoma (SH) (arrows). b : Axial T2-weighted MRI at the level of the uncus shows obliteration of bilateral sylvian and basal cisterns (red arrows) and bilateral uncal herniation especially on the left side (blue arrow). c : coronal fluid-attenuated inversion recovery MRI shows bilateral SH (red arrows), shrinkage of lateral ventricles (blue arrows), obliteration of the third ventricle and bilateral uncal herniation especially on the left side (yellow arrow). d : Sagittal T1-weighted MRI shows shrinkage of corpus callosum (red arrows), reduction of pontomesencephalic angle, mesencephalic compression due to transtentorial herniation, and tonsillar herniation (blue arrow). e : Sagittal enhanced T1- weighted MRI shows epidural venous congestion extending to c4 level (red arrows). f : Axial enhanced T1-weighted MRI shows increase of pachymeningeal enhancement (red arrows) and bilateral SH (blue arrows). |
 | Fig. 2.Angiographic images of middle meningeal artery embolization (MMAe). A : Pre embolization lateral image of the right middle meningeal artery (MMA) (arrow). b : Post embolization lateral image shows end-branch pruning of the right MMA (arrows). c : Pre embolization lateral image of the left MMA (arrow). d : Post embolization lateral image shows end-branch pruning of the left MMA (arrows). |
 | Fig. 3.Post embolization magnetic resonance imaging (MRI) of epidural blood patch (ebP)-refractory case 1. A : Axial T2-weighted MRI at the level of centrum semiovale shows total regression of subdural hematoma (SH) and better sulcus-gyrus differentiation (arrows). b : Axial T2-weighted MRI at the level of the third ventricle shows enlarging of the third ventricle and bilateral sylvian cisterns (arrows). c : coronal T2-weighted MRI shows enlarging of the lateral and third ventricles (blue arrows), total regression of SH and improving of bilateral uncal herniation (red arrows). d : Sagittal T2-weighted MRI shows regression of the shrinkage of corpus callosum and increment of the pontomesencephalic angle (arrows). |
Case 2
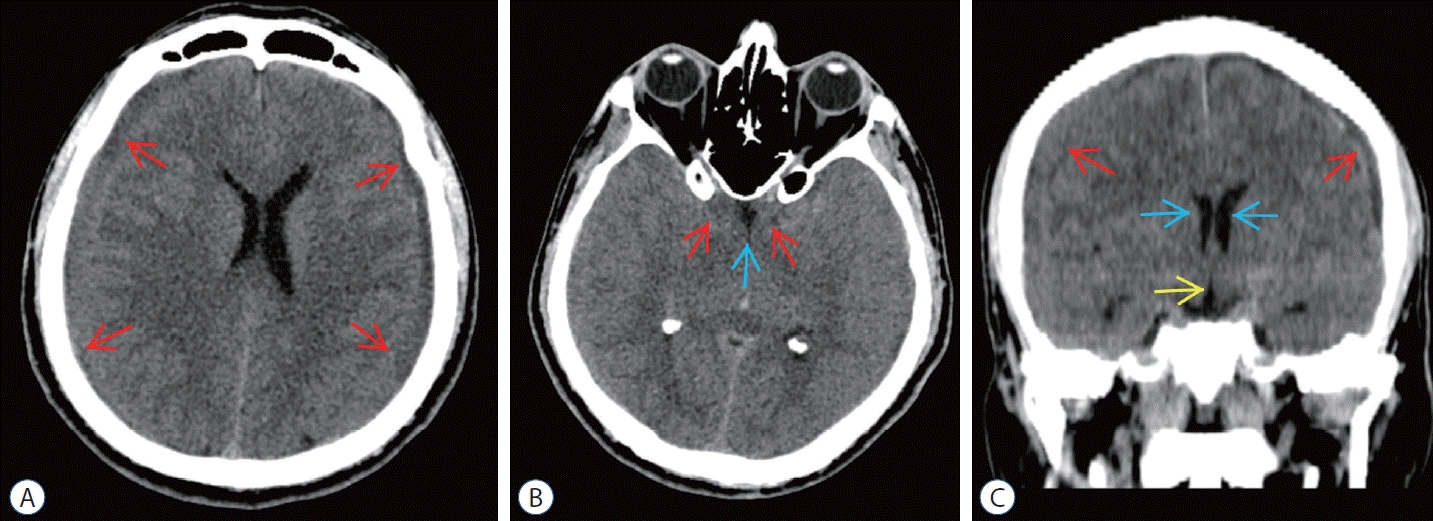
 | Fig. 4.Preoperative computed tomography (cT) scans of epidural blood patch (ebP)-refractory case 2. A : Axial cT image at the level of centrum semiovale shows bilateral subdural hematoma (SH) and difficulty of sulcus-gyrus differentiation (arrows). b : Axial cT image at the level of basal cisterns shows obliteration in sylvian and basal cisterns (red arrows) and third ventricle (blue arrow). c : coronal cT image shows bilateral SH (red arrows), shrinkage of lateral ventricles (blue arrows), and obliteration of the third ventricle (yellow arrow). |
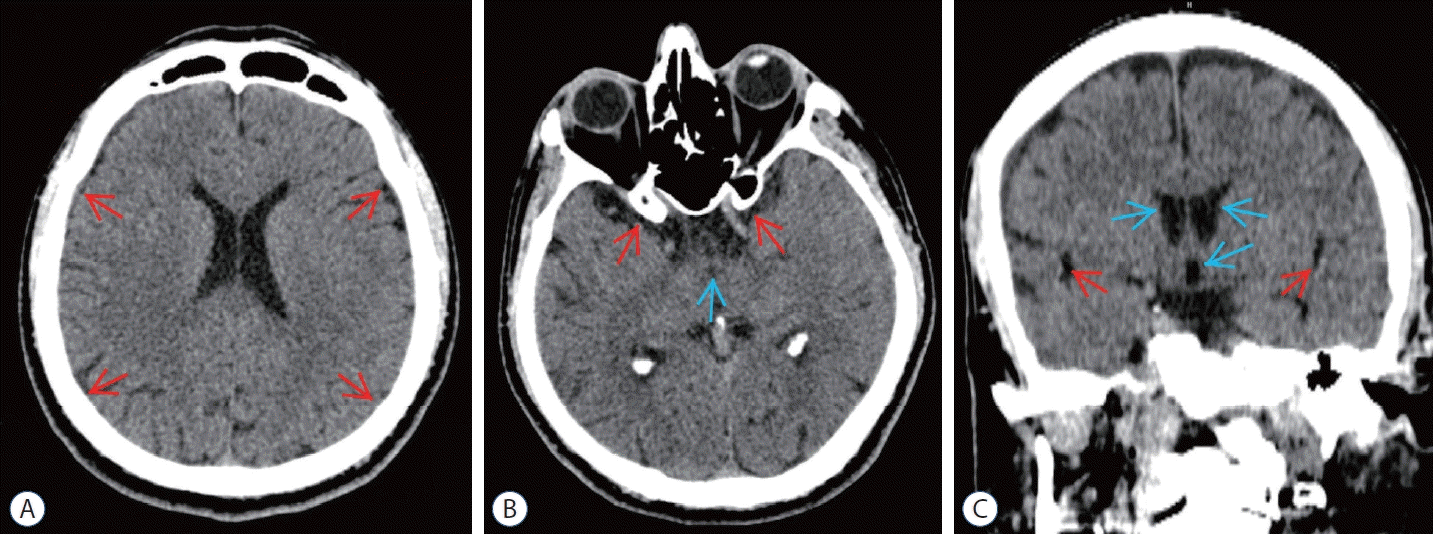
 | Fig. 5.Post embolization computed tomography (cT) scans of epidural blood patch (ebP)-refractory case 2. A : Axial cT image at the level of centrum semiovale shows total regression of the subdural hematoma and better sulcus-gyrus differentiation (arrows). b : Axial cT image at the level of the third ventricle shows enlarging of the third ventricle (blue arrow) and bilateral sylvian cisterns (red arrows). c : coronal cT image shows enlarging of the lateral and third ventricles (blue arrows) and bilateral sylvian cisterns (red arrows) and also total regression of SH. |


 PDF
PDF Citation
 Print
Print


 XML Download