Abstract
Background and Purpose
Methods
Results
Supplementary materials
Supplementary Table 1.
Supplementary Table 2.
Supplementary Table 3.
Supplementary Figure 1.
Supplementary Figure 2.
Notes
Disclosure
Gregory W. Albers reports equity and consulting for iSchemaView and consulting from Medtronic; Jens Fiehler reports grants and personal fees from Acandis, Cerenovus, MicroVention, Medtronic, Stryker, Phenox and grants from Route 92 outside the submitted work; Jeremy J. Heit reports consulting for Medtronic and MicroVention and Medical and Scientific Advisory Board membership for iSchemaView; Tobias D. Faizy reports grants from the German Research Foundation (DFG) during the conduct of the study.
ACKNOWLEDGMENTS
References
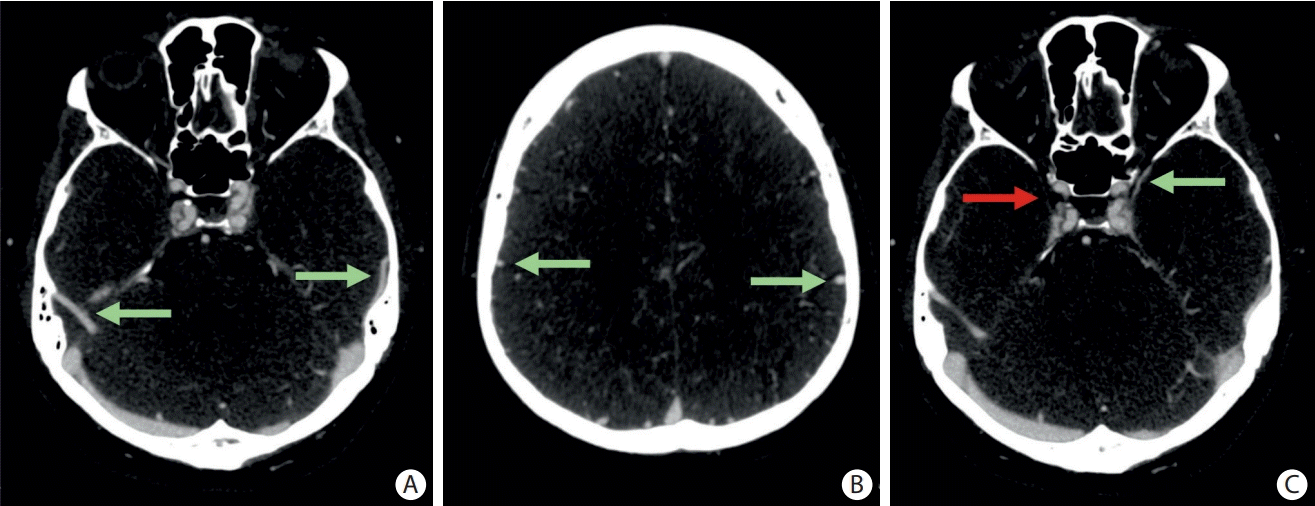
Figure 1.

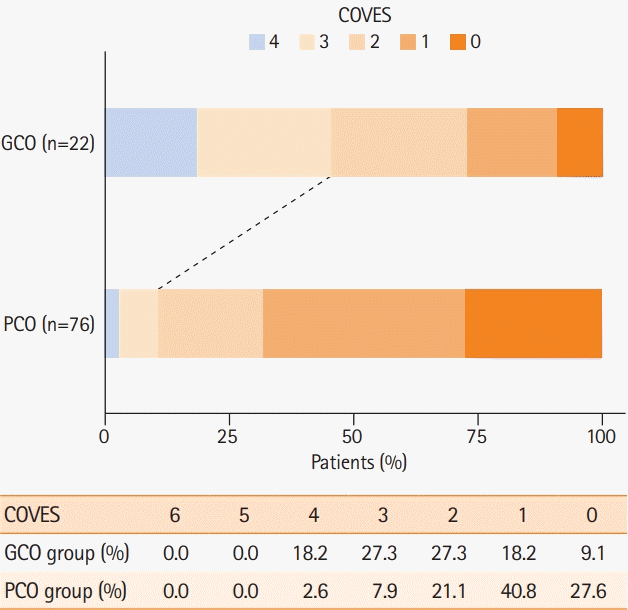
Figure 2.

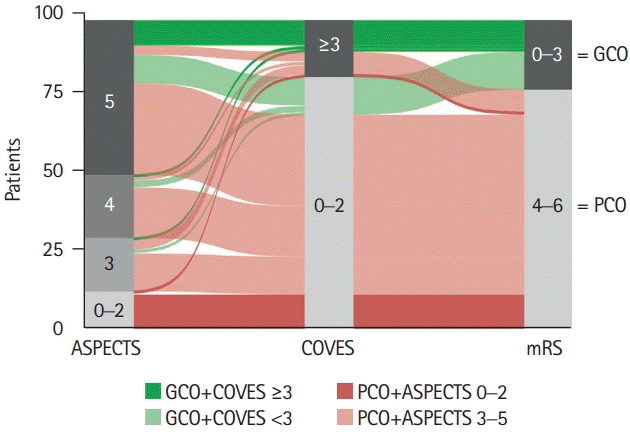
Figure 3.

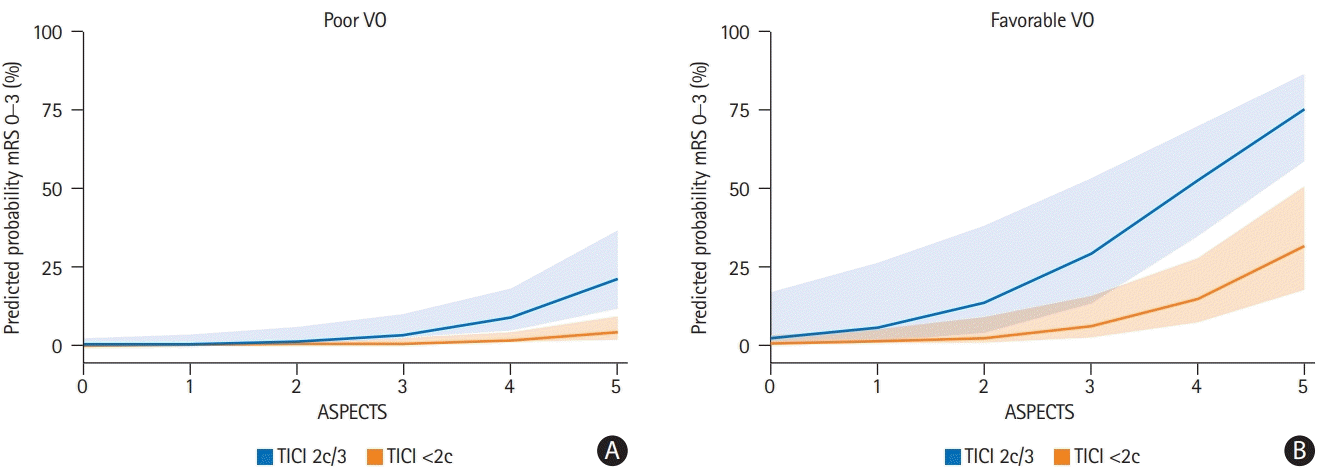
Figure 4.

Table 1.
| Variable |
ASPECTS ≤5 |
|||
|---|---|---|---|---|
| All patients (n=98) | mRS 4–6 (PCO) (n=76) | mRS 0–3 (GCO) (n=22) | P * | |
| Patient characteristics | ||||
| Age (yr) | 77 (64–82) | 77 (66–83) | 65 (57–78) | 0.010† |
| Male sex | 42/98 (42.9) | 28/76 (36.8) | 14/22 (63.6) | 0.025‡ |
| Atrial fibrillation | 35/98 (35.7) | 29/76 (38.2) | 6/22 (27.3) | 0.348‡ |
| Hypertension | 72/98 (73.5) | 58/76 (76.3) | 14/22 (63.6) | 0.236‡ |
| Diabetes | 21/98 (21.4) | 16/76 (21.1) | 5/22 (22.7) | 0.866‡ |
| Glucose (mg/dL)§ | 129 (113–158) | 131 (114–163) | 126 (107–141) | 0.211† |
| Lipid disorder | 24/89 (27.0) | 19/70 (27.1) | 5/19 (26.3) | 0.943‡ |
| Smoking (current/former) | 21/98 (21.4) | 16/76 (21.1) | 5/22 (22.7) | 0.866‡ |
| Admission NIHSS | 18 (14–20) | 19 (16–21) | 12 (9–18) | <0.001† |
| Imaging characteristics | ||||
| Location of arterial occlusion | 0.745‡ | |||
| ICA | 31/98 (31.6) | 25/76 (32.9) | 6/22 (27.3) | |
| MCA: M1 | 61/98 (62.2) | 47/76 (61.8) | 14/22(63.6) | |
| MCA: M2 | 6/98(6.1) | 4/76 (5.3) | 2/22 (9.1) | |
| ASPECTS, median (range) | 5 (0–5) | 4 (0–5) | 5 (3–5) | 0.002† |
| 0–2 | 12/98 (12.2) | 12/76 (15.7) | 0/22 (0.0) | |
| 3 | 17/98 (17.3) | 15/76 (19.7) | 2/22 (9.1) | |
| 4 | 20/98 (20.4) | 17/76 (22.4) | 3/22 (13.6) | |
| 5 | 49/98 (50.0) | 32/76 (42.1) | 17/22 (77.3) | |
| Baseline ischemic core volume (CBF <30%) (mL)∥ | 35 (16–78) | 36 (16–87) | 34 (15–75) | <0.712† |
| COVES | 1 (1–2) | 1 (0–2) | 2 (1–3) | <0.001† |
| 0 | 23/98 (23.5) | 21/76 (27.6) | 2/22(9.1) | |
| 1 | 35/98 (35.7) | 31/76 (40.8) | 4/22 (18.2) | |
| 2 | 22/98 (22.4) | 16/76 (21.1) | 6/22 (27.3) | |
| 3 | 12/98 (12.2) | 6/76 (7.9) | 6/22 (27.3) | |
| 4 | 6/98 (6.1) | 2/76 (2.6) | 4/22 (18.2) | |
| 5–6 | 0/98 (0) | 0/76 (0) | 0/22 (0) | |
| Favorable VO profile (COVES ≥3) | 18/98 (18.4) | 8/76 (10.5) | 10/22 (45.5) | <0.001‡ |
| Favorable arterial collaterals (Maas score ≥3) | 34/98 (34.7) | 22/76 (28.9) | 12/22 (54.5) | 0.026‡ |
Values are presented as median (interquartile range) or number (%) unless otherwise indicated.
ASPECTS, Alberta Stroke Program Early CT Score; mRS, modified Rankin Scale; PCO, poor clinical outcome; GCO, good clinical outcome; NIHSS, National Institutes of Health Stroke Scale; ICA, internal carotid artery; MCA, middle cerebral artery; CBF, cerebral blood flow; COVES, Cortical Vein Opacification Score; VO, venous outflow.
Table 2.
| Variable |
ASPECTS ≤5 |
|||
|---|---|---|---|---|
| All patients (n=98) | mRS 4–6 (PCO) (n=76) | mRS 0–3 (GCO) (n=22) | P * | |
| Procedural characteristics | ||||
| Time from symptom onset to imaging (min)§ | 221 (131–419) | 210 (121–412) | 257 (193–440) | 0.343† |
| Time from imaging to reperfusion (min)∥ | 79 (40–109) | 76 (41–109) | 87 (35–123) | 0.925† |
| Administration of tPA | 52/98 (53.1) | 41/76 (53.9) | 11/22 (50.0) | 0.744‡ |
| Mechanical thrombectomy | 88/98 (89.8) | 68/76 (89.5) | 20/22 (90.9) | 0.845‡ |
| General anesthesia | 38/98 (38.8) | 32/76 (42.1) | 6/22 (27.3) | 0.209‡ |
| Recanalization outcomes | 0.050‡ | |||
| TICI 0 | 14/88 (15.9) | 14/68 (20.6) | 0/20 (0) | |
| TICI 1 | 0/88 (0) | 0/68 (0) | 0/20 (0) | |
| TICI 2a | 10/88 (11.4) | 7/68 (10.3) | 3/20 (15.0) | |
| TICI 2b | 26/88 (29.5) | 22/68 (32.4) | 4/20 (20.0) | |
| TICI 2c | 2/88 (2.3) | 2/68 (2.9) | 0/20 (0) | |
| TICI 3 | 36/88 (40.9) | 23/68 (33.8) | 13/20 (65.0) | |
| Good mechanical recanalization (TICI 2b/2c/3) | 64/88 (72.7) | 47/68 (69.1) | 17/20 (85.0) | 0.161‡ |
| Excellent mechanical recanalization (TICI 2c/3) | 38/88 (43.2) | 25/68 (36.8) | 13/20 (65.0) | 0.025‡ |
| Clinical outcomes | ||||
| 24-Hour NIHSS | 17 (9–22) | 19 (14–24) | 6 (3–9) | <0.001† |
| mRS score at 90-day follow-up | 5 (4–6) | 5 (5–6) | 2 (1–3) | <0.001† |
| mRS 0–2 | 12/98 (12.2) | 0/76 (0) | 12/22 (54.5) | |
| mRS 0–3 | 22/98 (22.4) | 0/76 (0) | 22/22 (100.0) | |
| mRS 4–5 | 42/98 (42.9) | 42/76 (55.3) | 0/22 (0) | |
| mRS 6 | 34/98 (34.7) | 34/76 (44.7) | 0/22 (0) | |
Values are presented as median (interquartile range) or number (%).
ASPECTS, Alberta Stroke Program Early CT Score; mRS, modified Rankin Scale; PCO, poor clinical outcome; GCO, good clinical outcome; tPA, tissue plasminogen activator; TICI, thrombolysis in cerebral infarction; NIHSS, National Institutes of Health Stroke Scale.
Table 3.
Ninety-eight patients included. Akaike Information Criterion=77.25. R2=0.56. Statistical significance: P<0.05.
mRS, modified Rankin Scale; ASPECTS, Alberta Stroke Program Early CT Score; aOR, adjusted odds ratio; CI, confidence interval; NIHSS, National Institutes Health Stroke Scale; COVES, Cortical Vein Opacification Score; tPA, tissue plasminogen activator; TICI, thrombolysis in cerebral infarction.


 PDF
PDF Citation
 Print
Print


 XML Download