



 PDF
PDF Citation
 Print
Print


Introduction
Several randomized trials have demonstrated the effectiveness of mechanical thrombectomy (MT) in acute ischemic stroke (AIS) patients with large vessel occlusion (LVO) and pre-morbid modified Rankin Scale (mRS) score <2 [1-3]. Based on this, the recent American (AHA/ASA) guidelines recommend MT for patients with previous disability up to mRS 1 [4]. While approximately 30% of patients with LVO have pre-stroke mRS ≥2 [5,6], randomized data on efficacy and safety of MT in these patients are unavailable. Previous observational studies suggested a similar benefit of MT in patients with and without pre-stroke disability [7-9]. These studies mainly compared MT-treated patients with moderate pre-stroke disability to those without any or only minimal previous disability [7-9]. However, studies comparing MT with best medical treatment (BMT) including intravenous thrombolysis (IVT) in previously disabled patients, allowing examination of the effect size of MT, are scarce [10].
Using retrospective data from two large European stroke registries, we aimed to investigate the efficacy and safety of MT as compared to medical treatment, including IVT, in consecutive stroke patients with moderate to severe pre-stroke disability.
Go to : 
Methods
Patients
The study population consisted of consecutive AIS patients registered in the Austrian Stroke Unit Registry (ASUR) and the Acute STroke Registry and Analysis of Lausanne (ASTRAL) database. ASUR is a nationwide prospective registry of the Austrian stroke unit network founded by the Federal Ministry of Health. Anonymized data on baseline characteristics, risk factors and etiology, acute management, and functional outcome at discharge and at 3 months are registered for all patients admitted to one of currently 38 stroke units in Austria. Data collection and clinical ratings are performed by experienced stroke neurologists using standardized definitions of variables and scores. To ensure high data quality, immediate electronic data entry is performed. The web-based database includes online plausibility checks and a help function. Biannual educational meetings are also held to guarantee uniform data documentation. A detailed methodological description has been published previously [11]. On the other hand, ASTRAL is a single center-based cohort of all ischemic stroke patients admitted within 24 hours of stroke onset at the stroke center and/or intensive care unit of the Centre Hospitalier Universitaire Vaudois (CHUV) [12]. This registry is approved by its institution as a clinical and research registry and follows institutional regulations. Data on pre-stroke conditions, cerebrovascular risk factors, imaging and laboratory findings, stroke mechanism, acute management, functional outcome, and recurrences are collected up to 12 months. Data are collected online in a prespecified format by experienced and formed medical personnel. The web-based database also includes online plausibility checks and a help function. There is no uniform policy in ASUR-participating centers on whether patients with preexisting disability mRS ≥2 should be offered MT. At the CHUV, MT was offered standardly when pre-stroke mRS was ≤2 until 2017, and ≤3 since 2018. However, the final decision to offer MT remained at the discretion of the treating stroke unit physician at the time of stroke.
For the current analysis, we extracted from both databases those patients with AIS, treated between January 1, 2015 and December 31, 2019, aged ≥18 years, who had a pre-stroke mRS [13] ≥3, and potentially treatable LVO. Demographic and clinical data collection included age, sex, pre-stroke mRS, stroke severity, history of atrial fibrillation, arterial hypertension, and diabetes mellitus. Stroke severity on admission was measured using the National Institutes of Health Stroke Scale (NIHSS) [14]. LVO was categorized based on treatable occlusions in vessel segments M1 and M2 of the middle cerebral artery, extracranial and/or intracranial internal carotid artery, P1 segment of the posterior cerebral artery, and basilar artery. Patients were further categorized based on treatment received: MT, IVT, both, or none. Patients not receiving MT were considered as BMT.
Primary efficacy endpoint was defined with regard to pre-stroke disability as no or negative difference between pre-stroke mRS and mRS at follow-up at 3 months. Secondary efficacy endpoint was defined as a NIHSS difference of ≥8 points (early neurological improvement) between admission and at 24–48 hours. Further endpoint included mortality at 3 months. Safety endpoint was defined as a symptomatic intracerebral hemorrhage (sICH) according to the Thrombolysis with Alteplase 3 to 4.5 Hours after Acute Ischemic Stroke (ECASS3) study criteria [15].
Statistics
We summarized the categorical variables as absolute numbers and percentages and continuous variables as means and standard deviation; quantitatively skewed variables were summarized as medians and interquartile range. Categorical variables were compared using the chi-square test, Fisher’s exact test, or Kruskal-Wallis test, whereas continuous variables were compared using the Student’s t-test or Mann-Whitney U test. Multivariable regression models were used to examine the adjusted effects of MT on outcomes. Standard demographic and clinical factors known to influence outcome, including age, sex, admission NIHSS, pre-stroke mRS, hypertension, diabetes mellitus, atrial fibrillation, occlusion site, IVT use, and center, were used as covariates. We performed propensity score matching based on a logistic regression model controlling for the covariates as mentioned above, which matched the patients with most similar regression scores against each other, as implemented in the R package “MatchIt.” Statistical was analyses were performed using the IBM SPSS statistical software version 27 (IBM Co., Armonk, NY, USA), as well as the R statistical software version 4.0.2 (R Foundation for Statistical Computing, Vienna, Austria), with GLM function from the MASS package and “rpart” function from the “rpart” package.
Ethics
The ASUR is part of a government quality assessment program for nationwide stroke care and is financed by the Federal Ministry of Health. Data entry is mandatory for stroke units. All data are anonymized and centrally administered by the Gesundheit Österreich GmbH, which is the national research and planning institute for health care and a competence and funding center of health promotion. All scientific analyses included in this study were approved and supervised by a national academic review board. Based on this setting, informed consent for patients enrolled in the registry was waived. In ASTRAL, all data came from routine clinical and radiological management and were anonymized before analysis following the principles of the Swiss Human Research Ordinance. Therefore, there was no need for ethical commission approval or patient consent according to the Swiss Human Research Act and the applicable data protection legislation.
Data availability
Anonymized patient data are administered by the Gesundheit Österreich GmbH; inquiries on data availability are reviewed and granted by an academic review board. The anonymized data from ASTRAL supporting the findings of this study are available from the authors upon reasonable request and after signing a data transfer and use agreement.
Go to :
Results
Population
Within the study period, 2,111 patients with AIS were entered in the ASTRAL registry. Of those, 347 has pre-stroke mRS 3–5; 170 patients with potentially treatable LVO and pre-stroke mRS 3–5 were included in the study. In the same period, 8,664 AIS patients with pre-stroke mRS 3–5 were included in the ASUR registry. Of those, 292 with potentially treatable LVO and pre-stroke mRS 3–5 were included in the study. Overall, we included 462 patients in the analysis: 292 from the ASUR registry (111 MT, 181 BMT) and 170 from the ASTRAL registry (64 MT, 106 BMT). Altogether, 175 patients underwent MT and 287 received BMT. Patients undergoing MT were younger, had slightly higher admission stroke severity, and lower pre-stroke disability. Thrombolysis in cerebral infarction scores of 2b/3 in patients undergoing MT were achieved in 142 (81.1%) patients. IVT was administered in 75 (42.9%) patients in the MT group and 100 (34.8%) patients in the BMT group (P=0.100). Onsetto-door times and door-to-needle delays did not differ significantly between the two groups (Table 1).
Table 1.
Demographic and clinical characteristics of the study population categorized by MT and best medical treatment
| Characteristic | MT (n=175) | Medical (n=287) | P * |
|---|---|---|---|
| Age (yr) | 79.4±12.2 (25–99) | 85.2±8.8 (24–102) | <0.001 |
| Female sex | 109 (62.3) | 187 (65.2) | 0.550 |
| Admission NIHSS | 18 (1–36) (13–21) | 15 (0–36) (8–21) | 0.010 |
| Pre-stroke mRS | 0.010 | ||
| 3 | 136 (77.7) | 185 (64.5) | |
| 4 | 33 (18.9) | 83 (28.9) | |
| 5 | 6 (3.4) | 19 (6.6) | |
| Hypertension | 140 (80) | 248 (86.4) | 0.100 |
| Diabetes mellitus | 46 (27.2) | 75 (26.2) | 0.800 |
| Atrial fibrillation | 120 (71) | 156 (58.2) | 0.010 |
| Occlusion site | 0.070 | ||
| M1† | 99 (56.6) | 136 (47.4) | |
| M2† | 30 (17.1) | 82 (28.6) | |
| ICA | 26 (14.9) | 35 (12.2) | |
| PCA P1 | 11 (6.3) | 21 (7.3) | |
| BA | 9 (5.1) | 13 (4.5) | |
| Intravenous thrombolysis | 75 (42.9) | 100 (34.8) | 0.100 |
| ODT | 96 (29–886) (52–121) | 67.5 (24–544) (67–135) | 0.900 |
| DTN | 36 (15–89) (27–59) | 41 (20–88) (28–49) | 0.200 |
Values are presented as mean±standard deviation (range), number (%), or median (range) (interquartile range).
MT, mechanical thrombectomy; NIHSS, National Institutes of Health Stroke Scale Score; mRS, modified Ranking Scale; ICA, internal carotid artery; PCA, posterior cerebral artery (P1–P1 segment); BA, basilar artery; ODT, onset-to-door time; DTN, door-to-needle time.

Efficacy outcomes
At 3 months after stroke, 47 (26.9%) patients in the MT group returned to their pre-stroke mRS, compared to 58 (20.2%) in the BMT group (P=0.100) (Table 2). After adjusting for age, sex, admission NIHSS, pre-stroke mRS, hypertension, diabetes mellitus, atrial fibrillation, occlusion site, IVT, and center, MT was associated with higher odds of returning to the pre-stroke mRS at 3 months (adjusted odds ratio [aOR], 2.5; 95% confidence interval [CI], 1.39 to 4.47; P=0.002) as compared to BMT (Table 3). Early neurological improvement NIHSS ≥8 points occurred in 50 (30.3%) patients undergoing MT compared to 26 (11.8%) receiving BMT (P<0.001) (Table 2). After adjustment, MT was associated with early neurological improvement NIHSS ≥8 points (aOR, 2.62; 95% CI, 1.41 to 4.88; P=0.002) (Table 3). Death at 3 months occurred in 76 (43.4%) patients in the MT group compared to 180 (62.7%) in BMT group (P<0.001) (Table 2). After adjustment, MT was inversely associated with death at 3 months (aOR, 0.29; 95% CI, 0.18 to 0.49; P<0.001) (Table 3).
Table 2.
Univariate analysis of the efficacy and safety of MT versus best medical treatment in stroke patients with pre-stroke mRS ≥3
| Endpoint | MT (n=175) | Medical (n=287) | P * |
|---|---|---|---|
| Return to at least pre-stroke mRS at 3 months | 47 (26.9) | 58 (20.2) | 0.100 |
| Improvement NIHSS ≥8 | 50 (28.6) | 26 (9.1) | <0.001 |
| Mortality at 3 months | 76 (43.4) | 180 (62.7) | <0.001 |
| Symptomatic ICH ECASS3 | 7 (4) | 6 (2.1) | 0.250 |
Table 3.
Multivariate analysis of the efficacy of MT versus best medical treatment in stroke patients with pre-stroke mRS ≥3
Safety outcome
As defined by the ECASS3 criteria, sICH was present in seven (4%) patients in the MT group and in six (2.1%) patients in the BMT group (P=0.250) (Table 2).
Results after propensity score matching
Using propensity score matching, 168 MT and 168 BMT patients were selected. Except for age, there were no significant differences between the groups (Table 4).
Table 4.
Demographic and clinical characteristics of the study population categorized by MT and best medical treatment after propensity score matching
| Characteristic | MT (n=168) | Medical (n=168) | P * |
|---|---|---|---|
| Age (yr) | 79±12.2 (25–97) | 83±9.5 (24–99) | 0.002 |
| Female sex | 108 (64.3) | 105 (62.5) | 0.820 |
| Admission NIHSS | 17 (1–36) (13–19) | 17 (0–36) (13–21) | 0.360 |
| Pre-stroke mRS | 0.360 | ||
| 3 | 132 (78.6) | 123 (73.2) | |
| 4 | 32 (19) | 37 (22) | |
| 5 | 4 (2.4) | 8 (4.8) | |
| Hypertension | 134 (79.8) | 136 (81.5) | 0.780 |
| Diabetes mellitus | 46 (27.4) | 41 (24.4) | 0.620 |
| Atrial fibrillation | 119 (70.8) | 121 (72) | 0.900 |
| Occlusion site | 0.750 | ||
| M1† | 95 (56.5) | 86 (51.2) | |
| M2† | 30 (17.9) | 39 (23.2) | |
| ICA | 25 (14.9) | 23 (13.7) | |
| PCA P1 | 6 (3) | 10 (6) | |
| BA | 8 (4.8) | 10 (6) | |
| Intravenous thrombolysis | 72 (42.9) | 65 (38.7) | 0.500 |
| ODT | 70 (24–544) (53–125) | 97 (35–886) (73–130) | 0.940 |
| DTN | 40 (20–88) (27–56) | 36 (15–89) (28–49) | 0.230 |
Values are presented as mean±standard deviation (range), number (%), or median (range) (interquartile range).
MT, mechanical thrombectomy; NIHSS, National Institutes of Health Stroke Scale Score; mRS, modified Ranking Scale; ICA, internal carotid artery; PCA, posterior cerebral artery (P1–P1 segment); BA, basilar artery; ODT, onset-to-door time; DTN, door-to-needle time.
Efficacy outcomes after propensity score matching
At 3 months after stroke, 47 (28.0%) patients in the MT group returned to their pre-stroke mRS, compared to 32 (19.0%) in the BMT group (P=0.040) (Table 5). Detailed distribution of mRS at 3 months categorized by MT versus BMT is shown in Figure 1. After adjustment, MT was associated with higher odds of returning to the pre-stroke mRS at 3 months (aOR, 2.54; 95% CI, 1.16 to 5.57; P=0.020) compared with the BMT (Table 5). Early neurological improvement NIHSS ≥8 points occurred in 50 (29.8%) patients undergoing MT compared to 18 (10.7%) receiving BMT (P<0.001) (Table 5). After adjustment, MT was associated with early neurological improvement NIHSS ≥8 points (aOR, 2.72; 95% CI, 1.26 to 5.92; P=0.010) (Table 6). Death at 3 months occurred in 71 (42.3%) patients in the MT group compared to 107 (63.7%) in BMT group (P<0.001) (Table 5). After adjustment, MT was inversely associated with death at 3 months (aOR, 0.27; 95% CI, 0.15 to 0.51; P<0.001) (Table 6).
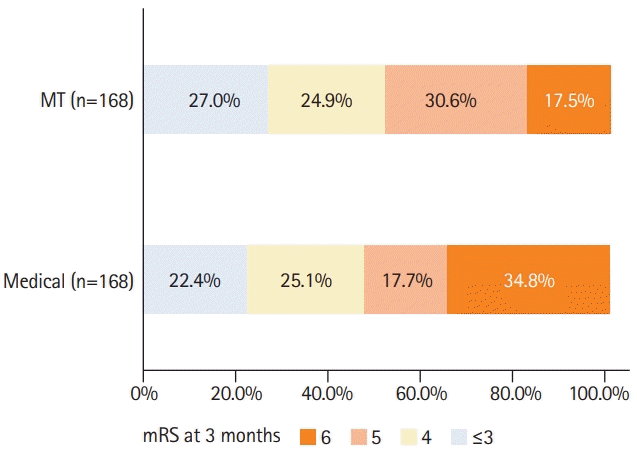 | Figure 1.Distribution of modified Ranking Scale (mRS) score at 3 months for mechanical thrombectomy (MT) versus best medical treatment in stroke patients with pre-stroke mRS ≥3 after propensity score matching.
|

Table 5.
Univariate analysis of the efficacy and safety of MT versus best medical treatment in stroke patients with pre-stroke mRS ≥3 after propensity score matching
| Endpoint | MT (n=168) | Medical (n=168) | P * |
|---|---|---|---|
| Return to at least pre-stroke mRS at 3 months | 47 (28.0) | 32 (19.0) | 0.040 |
| Improvement NIHSS ≥8 | 50 (29.8) | 18 (10.7) | <0.001 |
| Mortality at 3 months | 71 (42.3) | 107 (63.7) | <0.001 |
| Symptomatic ICH ECASS3 | 7 (4.2) | 4 (2.4) | 0.270 |
Table 6.
Multivariate analysis of the efficacy of MT versus best medical treatment in stroke patients with pre-stroke mRS ≥3 after propensity score matching
Safety outcome after propensity score matching
As defined by the ECASS3 criteria, sICH was present in seven (4.2%) patients in the MT group and in four (2.4%) patients in the BMT group (P=0.270) (Table 5).
Go to :
Discussion
In this retrospective multicenter observational study of AIS patients with pre-stroke disability, MT was significantly associated with higher odds of 3-month return to baseline mRS or better, short-term NIHSS improvement, and lower odds of mortality, without increased risk for sICH.
Patients with relevant pre-stroke disability represent a special subgroup of stroke patients. Due to the preexisting handicap, usual outcome measures, such as excellent or favorable functional outcome defined as mRS 0–1 or mRS 0–2 at 3 months are not appropriate. For a patient with moderate pre-stroke disability, any mRS increase may represent a clinically unfavorable outcome. On the other hand, a stable mRS may represent a favorable outcome.
Our observation is consistent with that of previous studies. Several single center studies and registries have reported a probably beneficial effect of MT in pre-stroke dependent patients [7-9,16]. However, only two studies used a control group. A monocentric study by Kastrup et al. [17] (MT, n=142) showed that MT in patients with pre-stroke mRS 2–4 increased the odds of avoiding a poor outcome as compared with IVT controls. A multicenter study by Tanaka et al. [10] suggested that in 175 patients with pre-stroke mRS 2–4, MT increased the odds of return to at least the pre-stroke mRS score as compared to medical management including IVT. Moreover, 28% of patients in the MT group returning to the pre-stroke mRS at 3 months and the aOR of 3.0 (95% CI, 1.4 to 6.6) for MT to return to the pre-stroke mRS at 3 months are fully consistent with our findings (27% and aOR 2.5; 95% CI, 1.4 to 4.5). Interestingly, we observed, in both arms, higher mortality rates (43.4% and 62.7%) as compared to the similarly designed study by Tanaka et al. [10] (17.7% and 26.8%). This may partially be explained by the fact that our population had cumulatively higher pre-stroke disability and more comorbidities and that we also included patients with posterior circulation stroke.
As in previous studies, the MT and medical treatment groups displayed baseline differences, mirroring probable treatment indication biases. Patients undergoing MT were younger, had a lower degree of pre-stroke disability, and had more favorable occlusion sites. Meanwhile, the medical treatment group had lower admission NIHSS and fewer atrial fibrillation, counterbalancing at least hypothetically the predicted better outcome in the MT group. Selection bias is a recognized limitation of the observational study design. Standard logistic regression models and propensity score matching have been used to account for the group’s asymmetry, although it has to be considered a major limitation. The indication for MT was made individually by the treating physician, based on patient’s cumulative comorbidity, cognitive impairment, frailty, center’s preferences, and ischemic core volumes. Unfortunately, we were unable to include data on infarct core sizes (e.g., The Alberta Stroke Program Early CT Score [ASPECTS] [18] scores) as the ASUR does not contain data on ASPECTS scores in patients not treated by MT. Altogether, these factors represent possible unmeasured confounders and account for additional limitations. Thus, our results should be interpreted with caution and with regard to the abovementioned limitations.
Meanwhile, the strength of our study is the rigorously collected large prospective multicenter dataset reflecting closely the real-world setting in hospitalized AIS patients.
Plausibly, patients with pre-stroke disability show increased rates of poor outcome and mortality despite treatment efforts. Nevertheless, MT seems to be clinically effective and prevent further functional deterioration and mortality in our series. Prestroke quality of life and regaining the previous quality of life may be crucial in decision-making processes. Pre-stroke mRS may not fully reflect the quality of life and adaptation to disability of individuals. Some patients with mRS 3, 4, or even 5 may eventually have, with supportive care, a meaningful quality of life. Therefore, pre-stroke mRS alone should not constitute a contraindication for endovascular treatment. Stroke-derived neurological impairment could potentially exacerbate suffering and decrease the quality of life. For patients with pre-stroke disability due to other serious health conditions or even life-limiting conditions, MT may represent a measure to decrease their sum of harm and alleviate further suffering. Basic ethical principles of beneficence and nonmaleficence make these considerations of offering stroke interventions in those previously disabled or even in a palliative setting justifiable [19].
It would be very unlikely that this specific patient subgroup will be in focus of future randomized control trials examining the efficacy of MT. Therefore, based on results from this study and those of others [10,17], we suggest that MT should not be routinely withheld based solely on pre-stroke mRS. Careful and individualized decision-making, including quality of life considerations, ethical issues, and patients’ declared or putative will, seems to be justified in this situation.
Go to :
Conclusions
MT seems to be effective and safe in reducing neurological deficits and preventing further functional deterioration in patients with relevant pre-stroke disability. Careful and individual case-by-case decisions instead of unselected withholding of treatment based on pre-stroke mRS may be appropriate.
Go to :
 XML Download