Introduction
Subjects and Method
Data collection
Physical examination
Body composition parameters
Rhinomanometry
PSG
Statistical analysis
Results
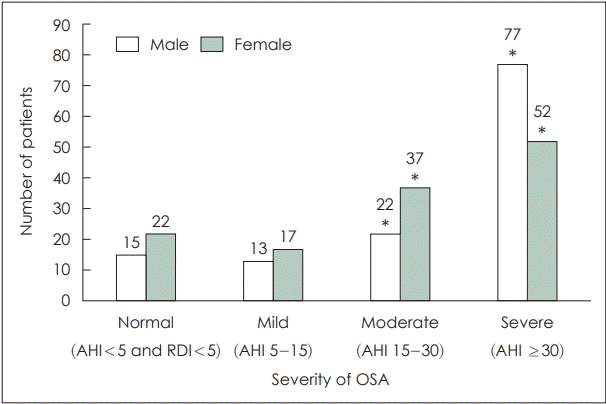
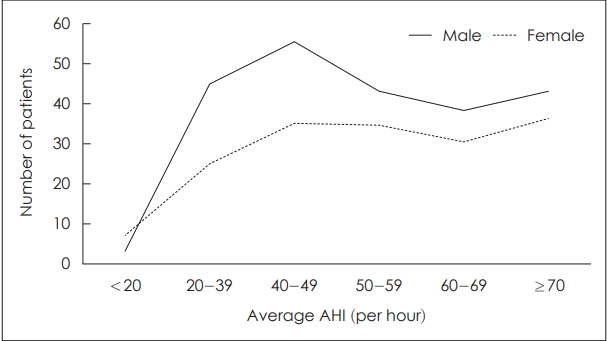
The characteristics between male and female subjects
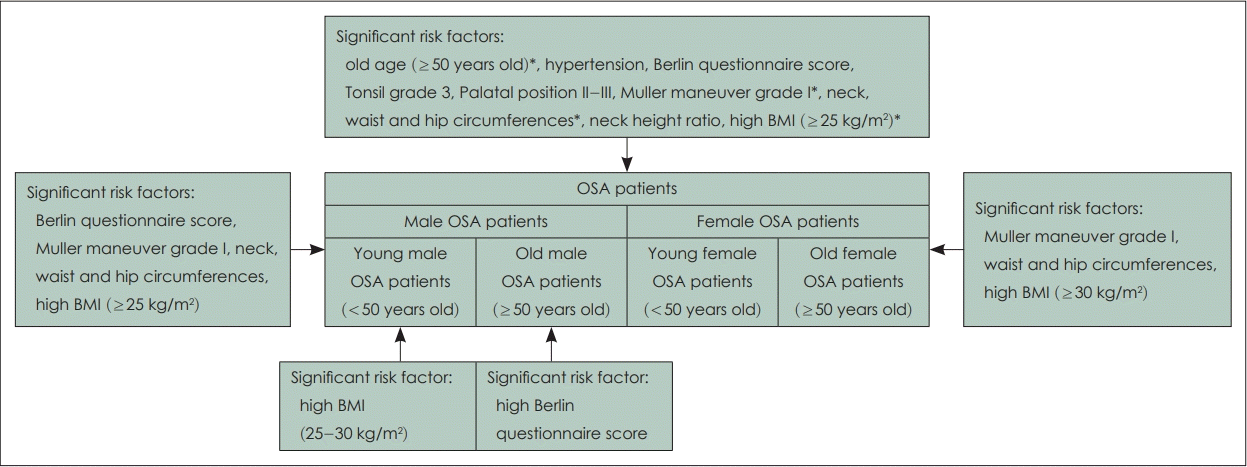
Different OSA risk factors between male and female patients
Table 1.
|
All patients (n=255) |
Male (n=127) |
Female (n=128) |
||||||||
|---|---|---|---|---|---|---|---|---|---|---|
| Non OSA (n=37) | OSA (n=218) | p value | Non OSA | OSA | p value | Non OSA (n=22) | OSA (n=106) | p value | ||
| Age (years, ≥50) | 6 (16.2) | 168 (77.1) | <0.001* | 1 (6.7) | 86 (76.8) | <0.001* | 5 (22.7) | 82 (77.4) | <0.001* | |
| Comorbidities | ||||||||||
| Hypertension | 2 (5.4) | 84 (38.5) | <0.001* | 0 (0.0) | 46 (41.1) | 0.002* | 2 (9.1) | 38 (35.8) | 0.014* | |
| Diabetes | 2 (5.4) | 32 (14.7) | 0.189 | 1 (6.7) | 14 (12.5) | >0.999 | 1 (4.5) | 18 (17.0) | 0.193 | |
| Dyslipidemia | 1 (2.7) | 20 (9.2) | 0.328 | 0 (0.0) | 4 (3.6) | >0.999 | 1 (4.5) | 16 (15.1) | 0.302 | |
| COPD or asthma | 1 (2.7) | 7 (3.2) | >0.999 | 0 (0.0) | 1 (0.9) | >0.999 | 1 (4.5) | 6 (5.7) | >0.999 | |
| Cardiovascular disease | 0 (0.0) | 11 (5.0) | 0.375 | 0 (0.0) | 6 (5.4) | >0.999 | 0 (0.0) | 5 (4.7) | 0.587 | |
| Cerebellar vascular disease | 0 (0.0) | 9 (4.1) | 0.365 | 0 (0.0) | 5 (4.5) | >0.999 | 0 (0.0) | 4 (3.8) | >0.999 | |
| Scoring | ||||||||||
| ESS (>10) | 4 (18.2) | 82 (39.6) | 0.048* | 1 (10.0) | 44 (40.4) | 0.087 | 3 (25.0) | 38 (38.8) | 0.529 | |
| Berlin | 5.6±2.9 | 8.2±3.7 | 0.017* | 3.0±1.4 | 8.2±3.8 | 0.025* | 6.3±2.8 | 8.2±3.6 | 0.119 | |
| Physical examinations | ||||||||||
| Tonsil grade 0 | 0 (0.0) | 3 (1.4) | <0.001* | 0 (0.0) | 3 (2.7) | <0.001* | NA | NA | <0.001* | |
| Tonsil grade 1 | 3 (8.1) | 81 (37.2) | 0 (0.0) | 28 (25.0) | 3 (13.6) | 53 (50.0) | ||||
| Tonsil grade 2 | 9 (24.3) | 110 (50.5) | 2 (13.3) | 65 (58.0) | 7 (31.8) | 45 (42.5) | ||||
| Tonsil grade 3 | 25 (67.6) | 23 (10.6) | 13 (86.7) | 15 (13.4) | 12 (54.5) | 8 (7.5) | ||||
| Tonsil grade 4 | 0 (0.0) | 1 (0.5) | <0.001* | 0 (0.0) | 1 (0.9) | <0.001* | NA | NA | 0.001* | |
| Palatal position 1 | 28 (75.7) | 37 (17.0) | 13 (86.7) | 13 (11.6) | 15 (68.2) | 24 (22.6) | ||||
| Palatal position 2 | 3 (8.1) | 65 (29.8) | 1 (6.7) | 37 (33.0) | 2 (9.1) | 28 (26.4) | ||||
| Palatal position 3 | 6 (16.2) | 114 (52.3) | 1 (6.7) | 61 (54.5) | 5 (22.7) | 53 (50.0) | ||||
| Palatal position 4 | 0 (0.0) | 1 (0.5) | NA | NA | 0 (0.0) | 1 (0.9) | ||||
| Muller maneuver 1 | 33 (89.2) | 82 (37.8) | <0.001* | 14 (93.3) | 42 (37.5) | 0.001* | 19 (86.4) | 40 (38.1) | <0.001* | |
| Muller maneuver 2 | 2 (5.4) | 100 (46.1) | 1 (6.7) | 49 (43.8) | 1 (4.5) | 51 (48.6) | ||||
| Muller maneuver 3 | 2 (5.4) | 29 (13.4) | 0 (0.0) | 19 (17.0) | 2 (9.1) | 10 (9.5) | ||||
| Body composition | ||||||||||
| Neck circumferences (cm) | 30.3±8.0 | 38.1±4.4 | <0.001* | 30.2±6.6 | 40.3±3.7 | 0.001* | 30.3±9.1 | 35.8±3.7 | 0.025* | |
| Waist circumferences (cm) | 75.9±14.2 | 93.6±11.3 | <0.001* | 71.8±15.2 | 96.4±9.7 | 0.002* | 78.9±13.8 | 90.5±12.2 | 0.013* | |
| Hip circumferences (cm) | 84.5±14.2 | 102.2±9.5 | <0.001* | 76.4±16.8 | 103.8±7.7 | 0.001* | 90.3±9.3 | 100.4±11.0 | 0.027* | |
| Neck height ratio | 0.20±0.05 | 0.23±0.02 | 0.001* | 0.22±0.02 | 0.24±0.02 | 0.042* | 0.20±0.06 | 0.23±0.02 | 0.022* | |
| BMI (>30 kg/m2) | 0 (0.0) | 47 (21.6) | <0.001* | 0 (0.0) | 26 (23.2) | <0.001* | 0 (0.0) | 21 (19.8) | 0.001* | |
| Rhinomanometry (total nasal cavity resistance before mucosal constriction, mean±sd) | ||||||||||
| Under 75 Pa | 0.15±0.04 | 0.15±0.11 | 0.410 | 0.17±0.01 | 0.13±0.12 | 0.291 | 0.15±0.05 | 0.17±0.10 | >0.999 | |
| Under 150 Pa | 0.21±0.06 | 0.23±0.15 | 0.638 | 0.23±0.01 | 0.22±0.16 | 0.420 | 0.21±0.08 | 0.24±0.13 | 0.952 | |
Table 2.
Multivariable analysis models included variables with p<0.05 on univariable analysis (eliminate multicollinearity : excluded neck circumferences, height). Logistic regression adjusted for age (≥50) by sex and interaction (sex×predictor) was done. OSA, obstructive sleep apnea; AHI, apnea-hypopnea index; RDI, respiratory disturbance index; OR, odds ratio; CI, confidence index; COPD, chronic obstructive pulmonary disease; ESS, Epworth Sleepiness Scale; SD, standard deviation; BMI, body mass index; Pa, pascal


 PDF
PDF Citation
 Print
Print


 XML Download