서 론
Table 1.
| Nutritional status | MUAC | WHO Child Growth Standards (0–5 years) | 2017 Korean National Growth Charts (0–18 years) |
|---|---|---|---|
| Severe acute malnutrition | <115 mm | ||
| Moderate acute malnutrition | 115–124 mm | ||
| Risk of acute malnutrition | 125–134 mm | ||
| Stunting | HA z-score <-2SD | HA < 3rd percentile | |
| Underweight | WA z-score < -2SD | WA < 5th percentile | |
| Wasting | WH z-score < -2SD | WH < 5th percentile (0–23 months) | |
| BA < 5th percentile (2–18 years) | |||
| Obesity | BA z-scores > 2SD | BA ≥ 95th percentile (2–18 years) |
본 론
1. 북한어린이 건강 및 영양상태
Table 2.
Data from the Global Health Observatory. Available from: https://www.who.int/data/gho/data/indicators/indicator-details/GHO/maternal-mortality-ratio-(per-100-000-live-births).
Table 3.
SK, South Korea; MCV1, first dose of measles-containing-vaccine; MCV2, second dose of measles-containing-vaccine; HepB3, 3 doses of hepatitis B; PAB, protection at birth against tetanus; Hib3, third dose of hemophilus influenza type B vaccine; BCG, Bacillus Calmette– Gué rin vaccine; Pol3, 3 doses of oral polio vaccine; DTP3, 3 doses of diphtheria, tetanus toxoid, and pertussis.
Data are available from the Global Health Observatory. Available from: https://www.who.int/data/gho/data/indicators/indicator-details/GHO/bcg-immunization-coverage-among-1-year-olds-(-).
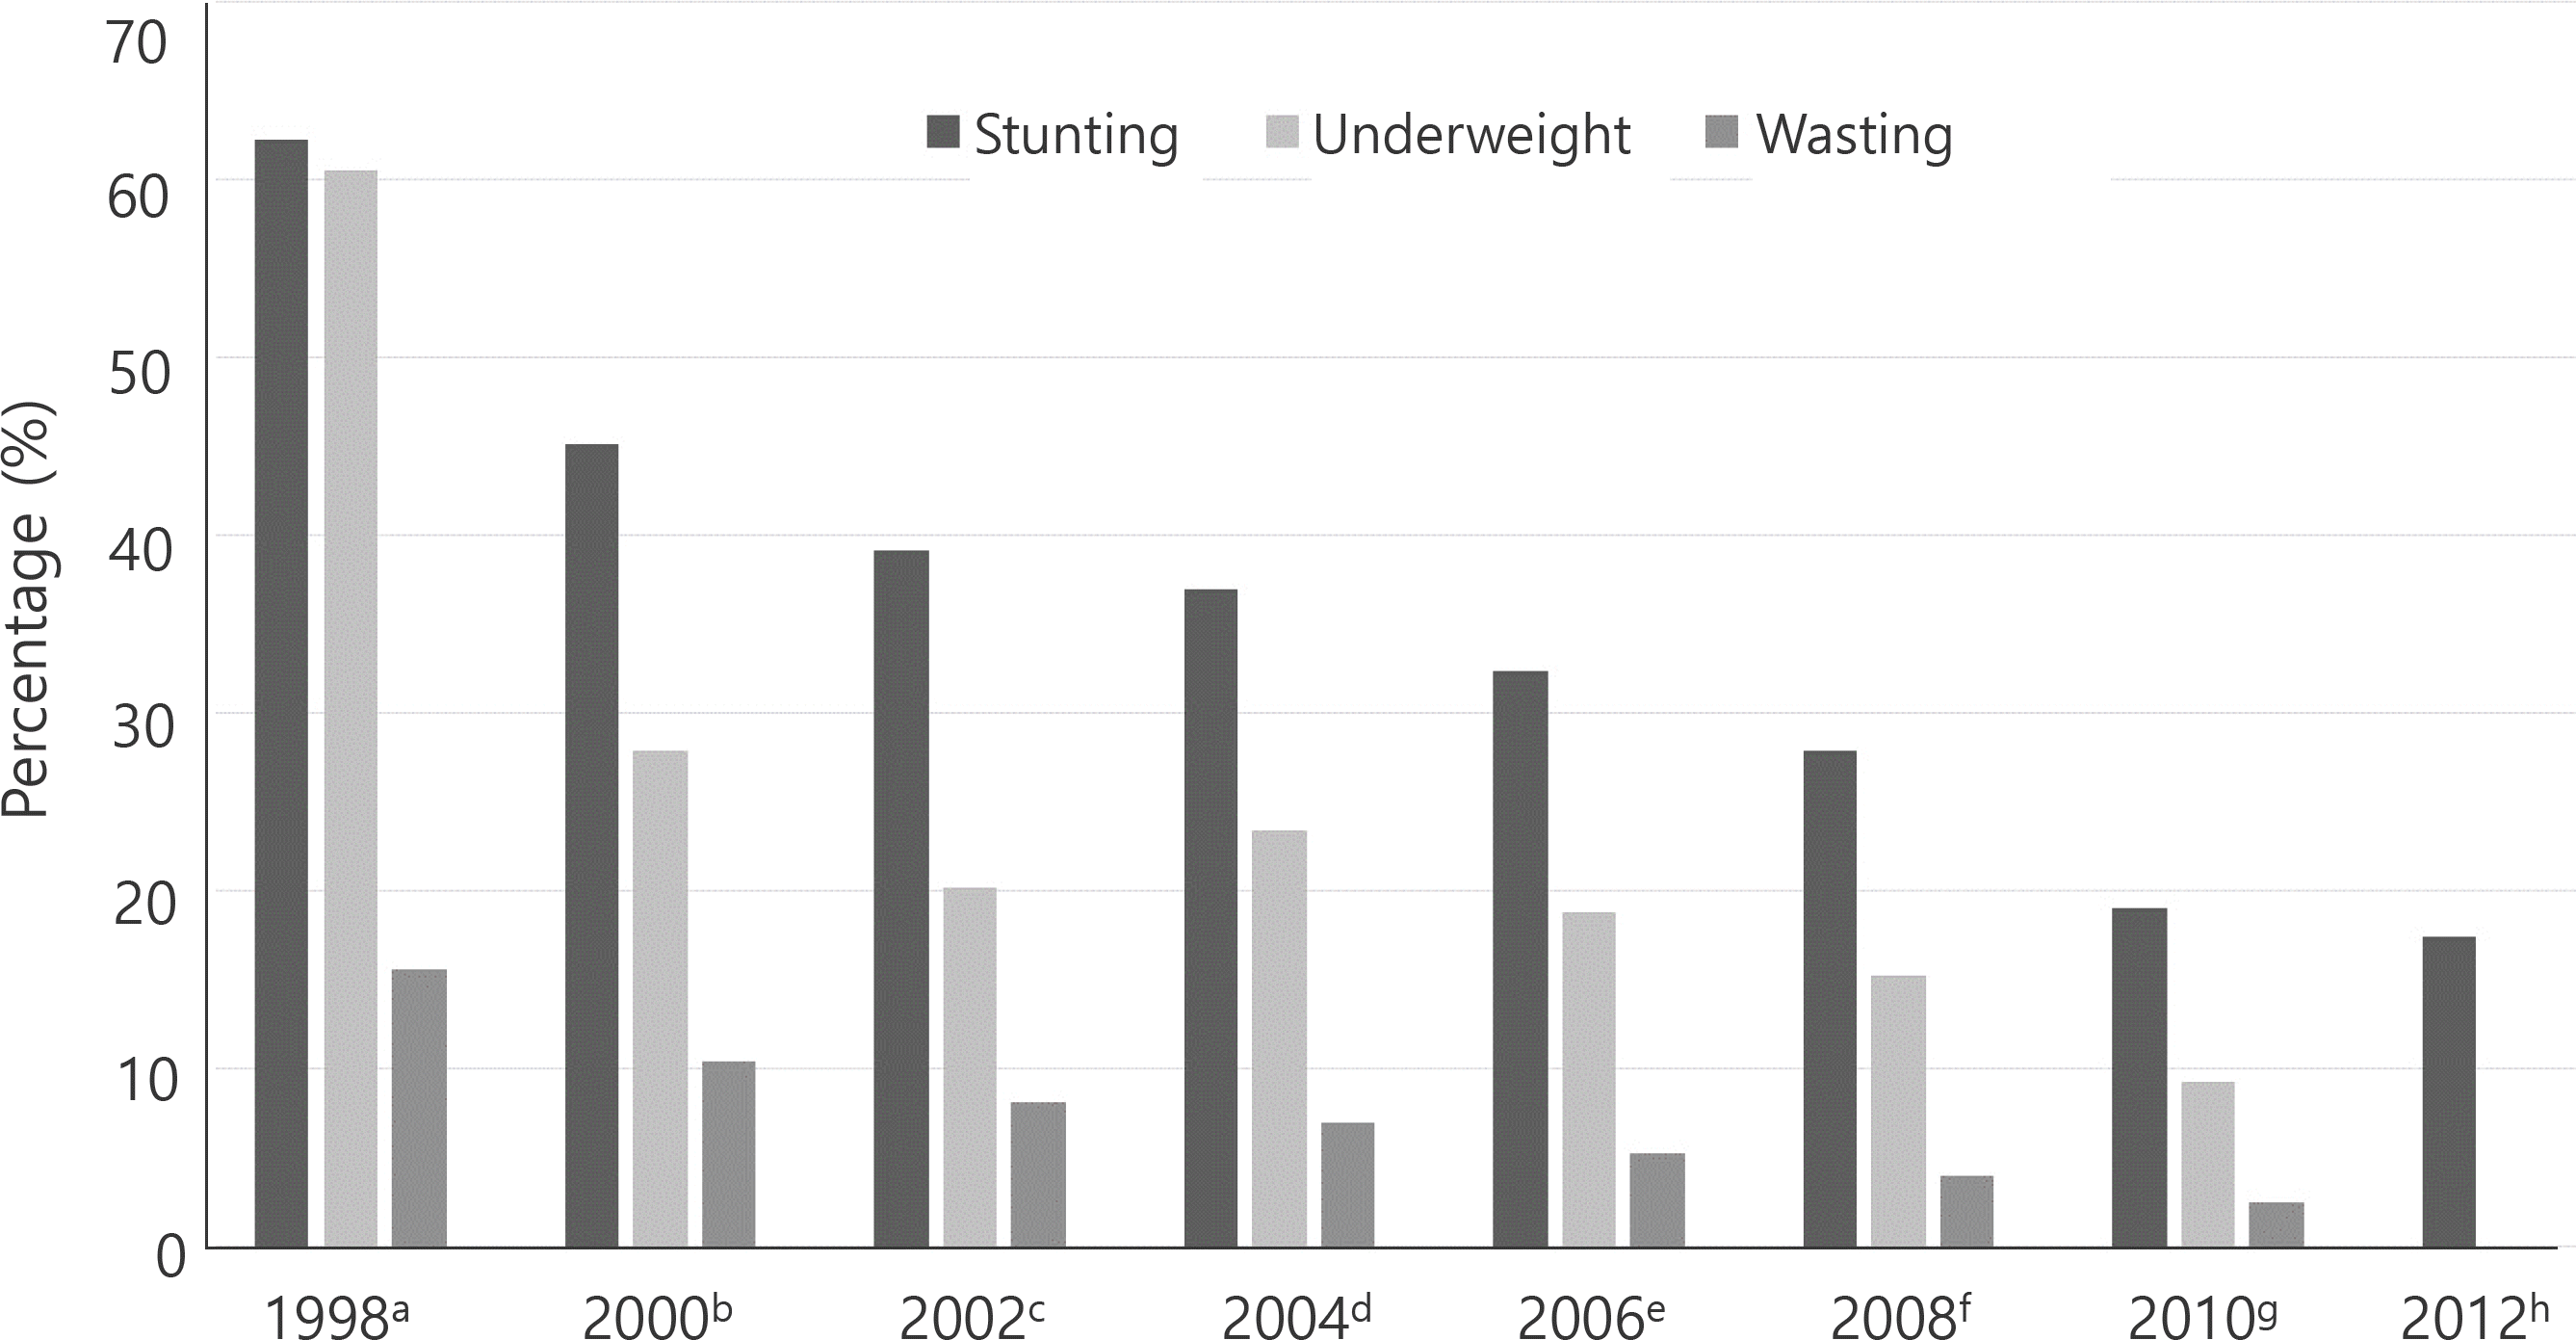
 | Fig. 1.Change in nutritional status in North Korean children. a Nutrition survey of the Democratic People's Republic of Korea (DPRK) 1998, b Report of the second multiple indicator cluster survey 2000, c Report on the DPRK Nutrition Assessment 2002, d DPRK 2004 Nutrition Assess ment Report of Survey Results, e DPRK Multiple Indicator Cluster Survey 2009: final report, f Democratic People's Republic of Korea Final Report of the National Nutrition Survey 2012, g DPR Korea Multiple Indicator Cluster Survey 2017: survey findings report, h Democratic People's Republic of Korea voluntary national review on the implementation of the 2030 agenda. |
2. 북한이탈가정 어린이 영양
Table 4.
| Period | Study | Year | Subjects | Nutrition status | Remark | ||||
|---|---|---|---|---|---|---|---|---|---|
| Age (yr) | Number (boys/girls) | Stunting | Underweight | Wasting | Obesity | ||||
| Immediately after escaping NK | Chang et al., 2000 | 1999 | 4–19 | 436 (306/130) | – | – | – | – | NK refugee children in China Height and weight of NK is 70–90% of SK reference |
| Immediately after entering | Pak, 2004 | 1999–2003 | 0–20 | 283 (152/131) | 29.4% | 10.4% | 0.0% | – | Using Hanawon health examination data |
| SK | Kim, 2005 | 2005 | 9–19 | 43 (18/25) | 30.2% | 27.9% | – | – | Investigation in Hanawon |
| After settling in SK | Lee et al., 2011 | 2009–2010 | 7–14 | 109(44/65) | 18.6% | 14.7% | – | – | Investigation in Hanawon |
| Choi et al., 2010 | 2007–2008 | 12–24 | 103(50/53) | – | – | – | – | NK refugee adolescents 4.9–10.8 cm shorter and 6.0–12.5 kg lighter than SK adolescents | |
| Kim and Choi 2020 | 2017–2019 | 0–18 | 526 (276/250) | 7.0% | 6.8% | 5.3% | 9.1% | Settled in SK about 4.2 years | |
| Lee et al., 2010 | NA | 6-15 | 70(35/35) | 11.4%→5.7% | 14.3%→1.4% | – | 1.4%→5.7% | Changes between immediately after entry and settled about 2 years | |


 Citation
 Print
Print


 XML Download