INTRODUCTION
METHODS
Study population
Clinical measurements
Statistical analysis
RESULTS
Table 1.
| Characteristic | Control (n=20) | T2DM (n=218) | NDR (n=110) | NPDR (n=84) | PDR (n=24) | P valuea | P valueb |
|---|---|---|---|---|---|---|---|
| Sex, male/female | 11/9 | 136/82 | 68/42 | 57/27 | 11/13 | 0.515 | 0.143 |
| Age, yr | 49.0 (39.0–53.8) | 56.0 (47.0–66.3) | 54.09±14.28 | 56.79±13.11 | 63.04±9.72 | 0.018 | 0.011 |
| Diabetes duration, yr | – | 8.0 (2.0–12.0) | 5.0 (0.9–10.0) | 10.0 (5.0–10.0) | 10.0 (7.0–13.5) | - | 0.004 |
| Age of diabetes diagnosis | – | 48.0 (39.0–55.0) | 48.0 (39.0–55.3) | 47.0 (39.0–54.8) | 53.0 (45.5–57.0) | - | 0.220 |
| Weight, kg | 65.71±7.86 | 69.85±12.57 | 70.70±13.64 | 68.84±10.87 | 69.51±13.28 | 0.043 | 0.588 |
| BMI, kg/m2 | 23.5 (22.6–25.5) | 24.6 (22.3–27.5) | 25.1 (22.3–27.6) | 23.9 (22.1–26.0) | 25.7 (22.7–29.4) | 0.246 | 0.132 |
| WC, cm | 73.70±6.01 | 90.01±11.57 | 90.0 (83.8–96.3) | 89.0 (82.0–96.0) | 90.0 (80.8–102.0) | <0.001 | 0.619 |
| SBP, mm Hg | 113.5 (109.3–130.0) | 133.0 (121.8–145.3) | 133.0 (122.8–142.8) | 132.0 (119.0–144.0) | 134.5 (123.8–153.0) | 0.001 | 0.455 |
| DBP, mm Hg | 75.0 (64.3–79.5) | 78.0 (71.0–85.0) | 79.19±10.40 | 76.99±10.47 | 76.33±8.75 | 0.061 | 0.233 |
| HbA1c, % | 5.1 (4,7–5.4) | 9.6 (8.0–11.1) | 9.0 (7.9–11.0) | 9.8 (8.4–11.1) | 9.4 (7.3–12.1) | <0.001 | 0.416 |
| FPG, mmol/L | 5.1 (4.9–5.3) | 10.0 (8.2–12.2) | 10.0 (8.0–12.4) | 9.9 (8.4–12.0) | 10.1 (9.0–13.4) | <0.001 | 0.654 |
| 2hPG, mmol/L | 7.10±0.50 | 21.57±5.27 | 21.7 (18.0–24.9) | 21.5 (18.3–26.1) | 22.7 (20.3–24.9) | <0.001 | 0.745 |
| FINS, mIU/L | 8.5 (5.3–13.6) | 7.4 (3.7–13.3) | 8.1 (4.0–14.1) | 6.5 (3.4–11.7) | 6.5 (4.4–26.0) | 0.263 | 0.255 |
| FCP, μg/L | 1.9 (1.1–3.1) | 1.9 (1.2–2.8) | 2.1 (1.3–3.1) | 1.8 (1.0–2.3) | 1.8 (1.3–2.8) | 0.993 | 0.090 |
| HOMA-IR | 1.9 (1.2–3.1) | 2.9 (1.6–6.5) | 3.7 (1.6–7.4) | 2.7 (1.5–5.4) | 2.7 (1.7–11.6) | 0.021 | 0.223 |
| TC, mmol/L | 5.2 (4.3–5.4) | 4.5 (3.7–5.5) | 4.4 (3.7–5.6) | 4.6 (3.8–5.6) | 4.4 (3.6–5.0) | 0.053 | 0.695 |
| TG, mmol/L | 1.0 (0.7–1.4) | 1.5 (1.0–2.4) | 1.6 (1.0–2.6) | 1.4 (0.9–2.2) | 1.5 (0.9–1.8) | 0.011 | 0.172 |
| HDL, mmol/L | 1.4 (1.2–1.7) | 1.1 (0.9–1.3) | 1.0 (0.9–1.2) | 1.1 (0.9–1.3) | 1.1 (1.0–1.4) | <0.001 | 0.149 |
| LDL, mmol/L | 2.68±0.69 | 2.67±0.93 | 2.69±1.01 | 2.69±0.86 | 2.57±0.76 | 0.994 | 0.831 |
| ALT, U/L | 20.0 (18.0–22.0) | 22.0 (16.0–34.0) | 23.0 (16.0–37.3) | 22.0 (14.0–31.8) | 24.5 (15.3–35.3) | 0.126 | 0.379 |
| AST, U/L | 16.5 (14.3–23.5) | 20.0 (16.0–26.0) | 20.5 (17.0–28.0) | 19.0 (15.0–24.0) | 23.0 (18.0–29.3) | 0.037 | 0.035 |
| ALP, U/L | 70.0 (56.0–87.0) | 84.5 (71.0–105.3) | 83.0 (69.0–105.0) | 84.5 (73.3–106.3) | 87.0 (69.0–115.0) | 0.003 | 0.610 |
| BUN, mmol/L | 4.7 (4.1–5.4) | 5.4 (4.2–6.5) | 5.30 (3.9–6.6) | 5.6 (4.5–6.4) | 5.3 (4.5–6.8) | 0.049 | 0.287 |
| SUA, μmol/L | 306.5 (243.8–368.3) | 283.0 (225.8–344.3) | 283.0 (221.3–344.3) | 286.5 (234.8–347.5) | 271.0 (226.3–345.8) | 0.219 | 0.794 |
| Scr, mg/dL | 0.7 (0.6–0.9) | 0.7 (0.5–0.8) | 0.6 (0.5–0.7) | 0.7 (0.6–0.7) | 0.7 (0.5–0.9) | 0.042 | 0.305 |
| UACR, mg/g | 10.2 (3.5–13.2) | 22.9 (8.8–81.5) | 22.3 (7.8–64.9) | 19.1 (8.0–106.1) | 35.6 (10.8–84.0) | <0.001 | 0.445 |
| Scys C, mg/L | 0.7 (0.6–0.9) | 0.6 (0.5–0.8) | 0.6 (0.5–0.7) | 0.6 (0.5–0.8) | 0.7 (0.6–1.0) | 0.299 | 0.083 |
| eGFR, mL/min/1.73 m2 | 115.7 (94.5–123.2) | 116.2 (99.7–130.0) | 118.19±24.82 | 112.70±27.02 | 97.86±29.28 | 0.485 | 0.003 |
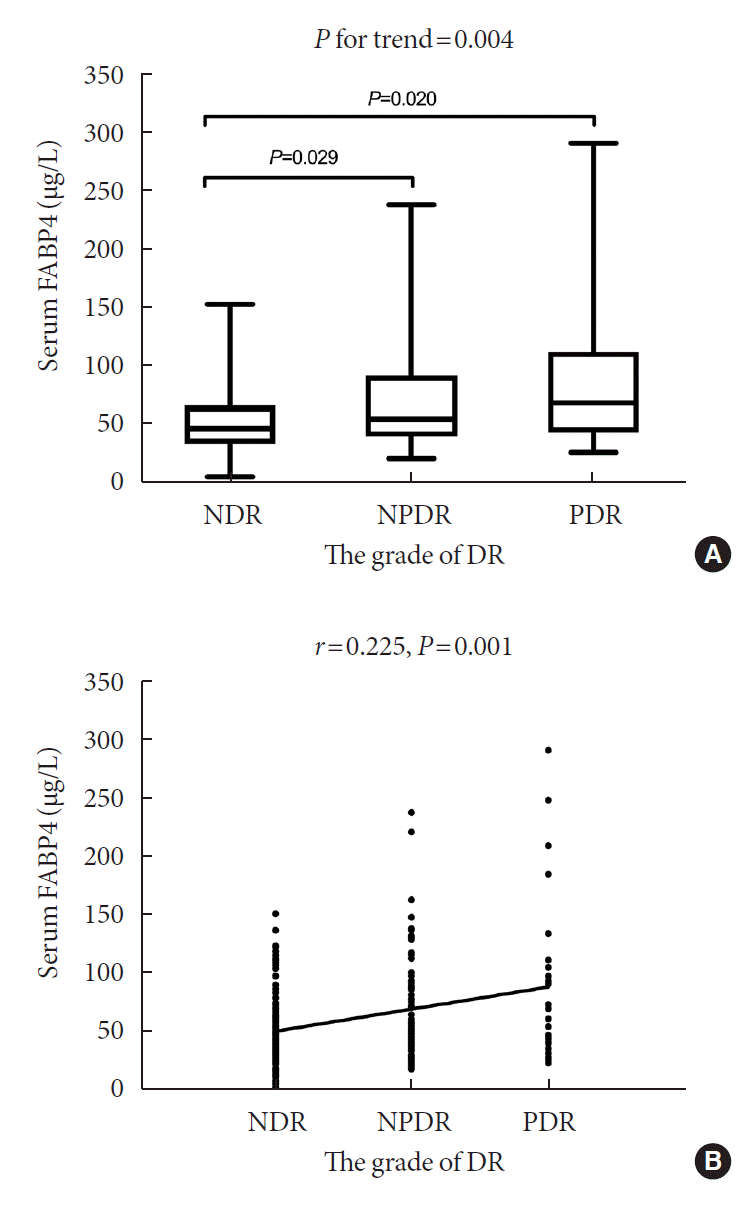
| FABP4, μg/L | 28.3 (24.4–33.7) | 49.3 (34.5–81.0) | 45.5 (32.4–64.8) | 53.7 (38.7–90.7) | 66.9 (42.1–111.3) | <0.001 | 0.004 |
Values are presented as median (interquartile range) or mean±standard deviation.
T2DM, type 2 diabetes mellitus; NDR, non-diabetic retinopathy; NPDR, non-proliferative diabetic retinopathy; PDR, proliferative diabetic retinopathy; BMI, body mass index; WC, waist circumference; SBP, systolic blood pressure; DBP, diastolic blood pressure; HbA1c, glycosylated hemoglobin; FPG, fasting plasma glucose; 2hPG, 2-hour postprandial plasma glucose; FINS, fasting insulin; FCP, fasting C-peptide; HOMA-IR, homeostasis model assessment-estimated insulin resistance; TC, total cholesterol; TG, triglyceride; HDL, high-density lipoprotein; LDL, low-density lipoprotein; ALT, alanine aminotransferase; AST, aspartate aminotransferase; ALP, lkaline phosphatase; BUN, blood urea nitrogen; SUA, serum uric acid; Scr, serum creatinine; UACR, urinary albumin to creatinine ratio; Scys C, serum cystatin C; eGFR, estimated glomerular filtration rate; FABP4, fatty acid-binding protein 4.
 | Fig. 1.(A) Comparison of serum fatty acid-binding protein 4 (FABP4) levels among subgroups divided by the severity of diabetic retinopathy (DR). P for trend by Kruskal-Wallis test. (B) The correlation between serum FABP4 levels and the severity of DR. NDR, non-diabetic retinopathy; NPDR, non-proliferative diabetic retinopathy; PDR, proliferative diabetic retinopathy. |
Table 2.
| Variable |
FABP4a |
|
|---|---|---|
| r | P value | |
| Female sex | 0.168 | 0.013 |
| Age, yr | 0.140 | 0.039 |
| Diabetes duration, yr | 0.099 | 0.147 |
| Age of diabetes diagnosis, yr | 0.094 | 0.169 |
| Weight, kg | 0.110 | 0.104 |
| BMI, kg/m2 | 0.180 | 0.008 |
| WC, cm | 0.103 | 0.130 |
| SBP, mm Hg | 0.064 | 0.344 |
| DBP, mm Hg | –0.070 | 0.306 |
| HbA1c, % | 0.032 | 0.638 |
| FPG, mmol/L | 0.111 | 0.102 |
| 2hPG, mmol/L | 0.033 | 0.631 |
| FINS, mIU/L | 0.151 | 0.026 |
| FCP, μg/L | 0.046 | 0.501 |
| HOMA-IR | 0.179 | 0.008 |
| TC, mmol/L | –0.059 | 0.385 |
| TG, mmol/L | 0.103 | 0.129 |
| HDL, mmol/L | 0.004 | 0.958 |
| LDL, mmol/L | –0.108 | 0.111 |
| ALT, U/L | 0.004 | 0.954 |
| AST, U/L | 0.068 | 0.314 |
| ALP, U/L | 0.040 | 0.552 |
| BUN, mmol/L | 0.028 | 0.679 |
| SUA, μmol/L | 0.091 | 0.183 |
| Scr, mg/dL | –0.005 | 0.939 |
| UACR, mg/g | 0.130 | 0.055 |
| Scys C, mg/L | 0.217 | 0.001 |
| eGFR, mL/min/1.73 m2 | –0.230 | 0.001 |
| The severity of DR | 0.225 | 0.001 |
FABP4, fatty acid-binding protein 4; T2DM, type 2 diabetes mellitus; BMI, body mass index; WC, waist circumference; SBP, systolic blood pressure; DBP, diastolic blood pressure; HbA1c, glycosylated hemoglobin; FPG, fasting plasma glucose; 2hPG, 2-hour postprandial plasma glucose; FINS, fasting insulin; FCP, fasting C-peptide; HOMA-IR, homeostasis model assessment-estimated insulin resistance; TC, total cholesterol; TG, triglyceride; HDL, high-density lipoprotein; LDL, low-density lipoprotein; ALT, alanine aminotransferase; AST, aspartate aminotransferase; ALP, alkaline phosphatase; BUN, blood urea nitrogen; SUA, serum uric acid; Scr, serum creatinine; UACR, urinary albumin to creatinine ratio; Scys C, serum cystatin C; eGFR, estimated glomerular filtration rate; DR, diabetic retinopathy.
Table 3.
| Variable |
FABP4 |
|
|---|---|---|
| OR (95% CI) | P value | |
| NDR | Reference | |
| NPDR | 1.013 (1.005–1.022) | 0.003 |
| PDR | 1.019 (1.008–1.030) | 0.001 |
Multivariate logistic regression model was adjusted for the following covariates: age, sex, body mass index, duration of diabetes, aspartate aminotransferase, homeostasis model assessment-estimated insulin resistance, and estimated glomerular filtration rate.
FABP4, fatty acid-binding protein 4; OR, odds ratio; CI, confidence interval; NDR, non-diabetic retinopathy; NPDR, non-proliferative diabetic retinopathy; PDR, proliferative diabetic retinopathy.
Table 4.
| Variable |
NPDR |
PDR |
||
|---|---|---|---|---|
| OR (95% CI) | P value | OR (95% CI) | P value | |
| FABP4 ≤76.4 μg/L (n=160) | Reference | - | - | - |
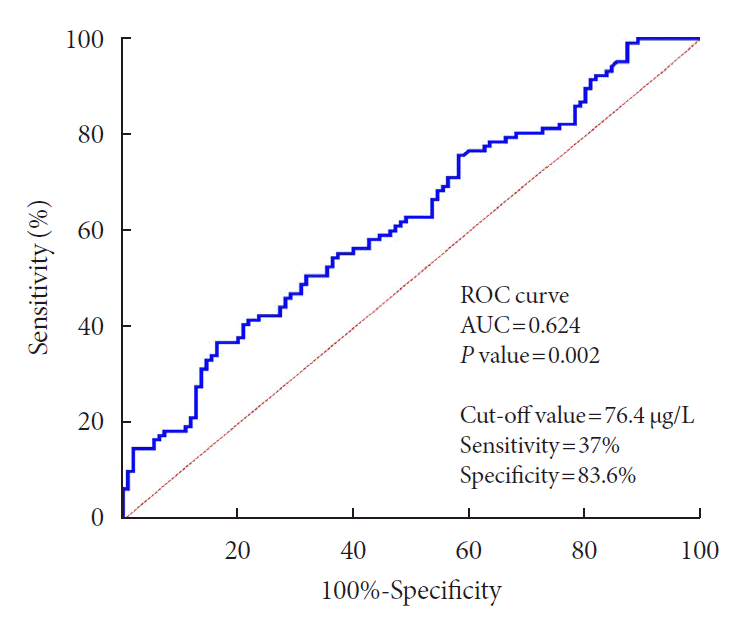
| FABP4 >76.4 μg/L (n=58) | 3.231 (1.574–6.632) | 0.001 | 3.689 (1.306–10.424) | 0.014 |
Reference category: The non-diabetic retinopathy group. Multivariate logistic regression analysis including FABP4 as a categorized binary variable using the cut-off value of 76.4 μg/L. FABP4 was given value 0 in patients with FABP >76.4 μg/L (n=58) and value 1 in patients with FABP ≤76.4 μg/L (n=160). This model was adjusted for the following covariates: age, sex, body mass index, duration of diabetes, aspartate aminotransferase, homeostasis model assessment-estimated insulin resistance, and estimated glomerular filtration rate.
FABP4, fatty acid-binding protein 4; NPDR, non-proliferative diabetic retinopathy; PDR, proliferative diabetic retinopathy; OR, odds ratio; CI, confidence interval.


 PDF
PDF Citation
 Print
Print


 XML Download