Abstract
Background
Methods
Results
SUPPLEMENTARY MATERIALS
Notes
CONFLICTS OF INTEREST
Dongwon Yi has been editorial board member of the Diabetes & Metabolism Journal since 2021. He was not involved in the review process of this article. Otherwise, there was no conflict of interest.
REFERENCES
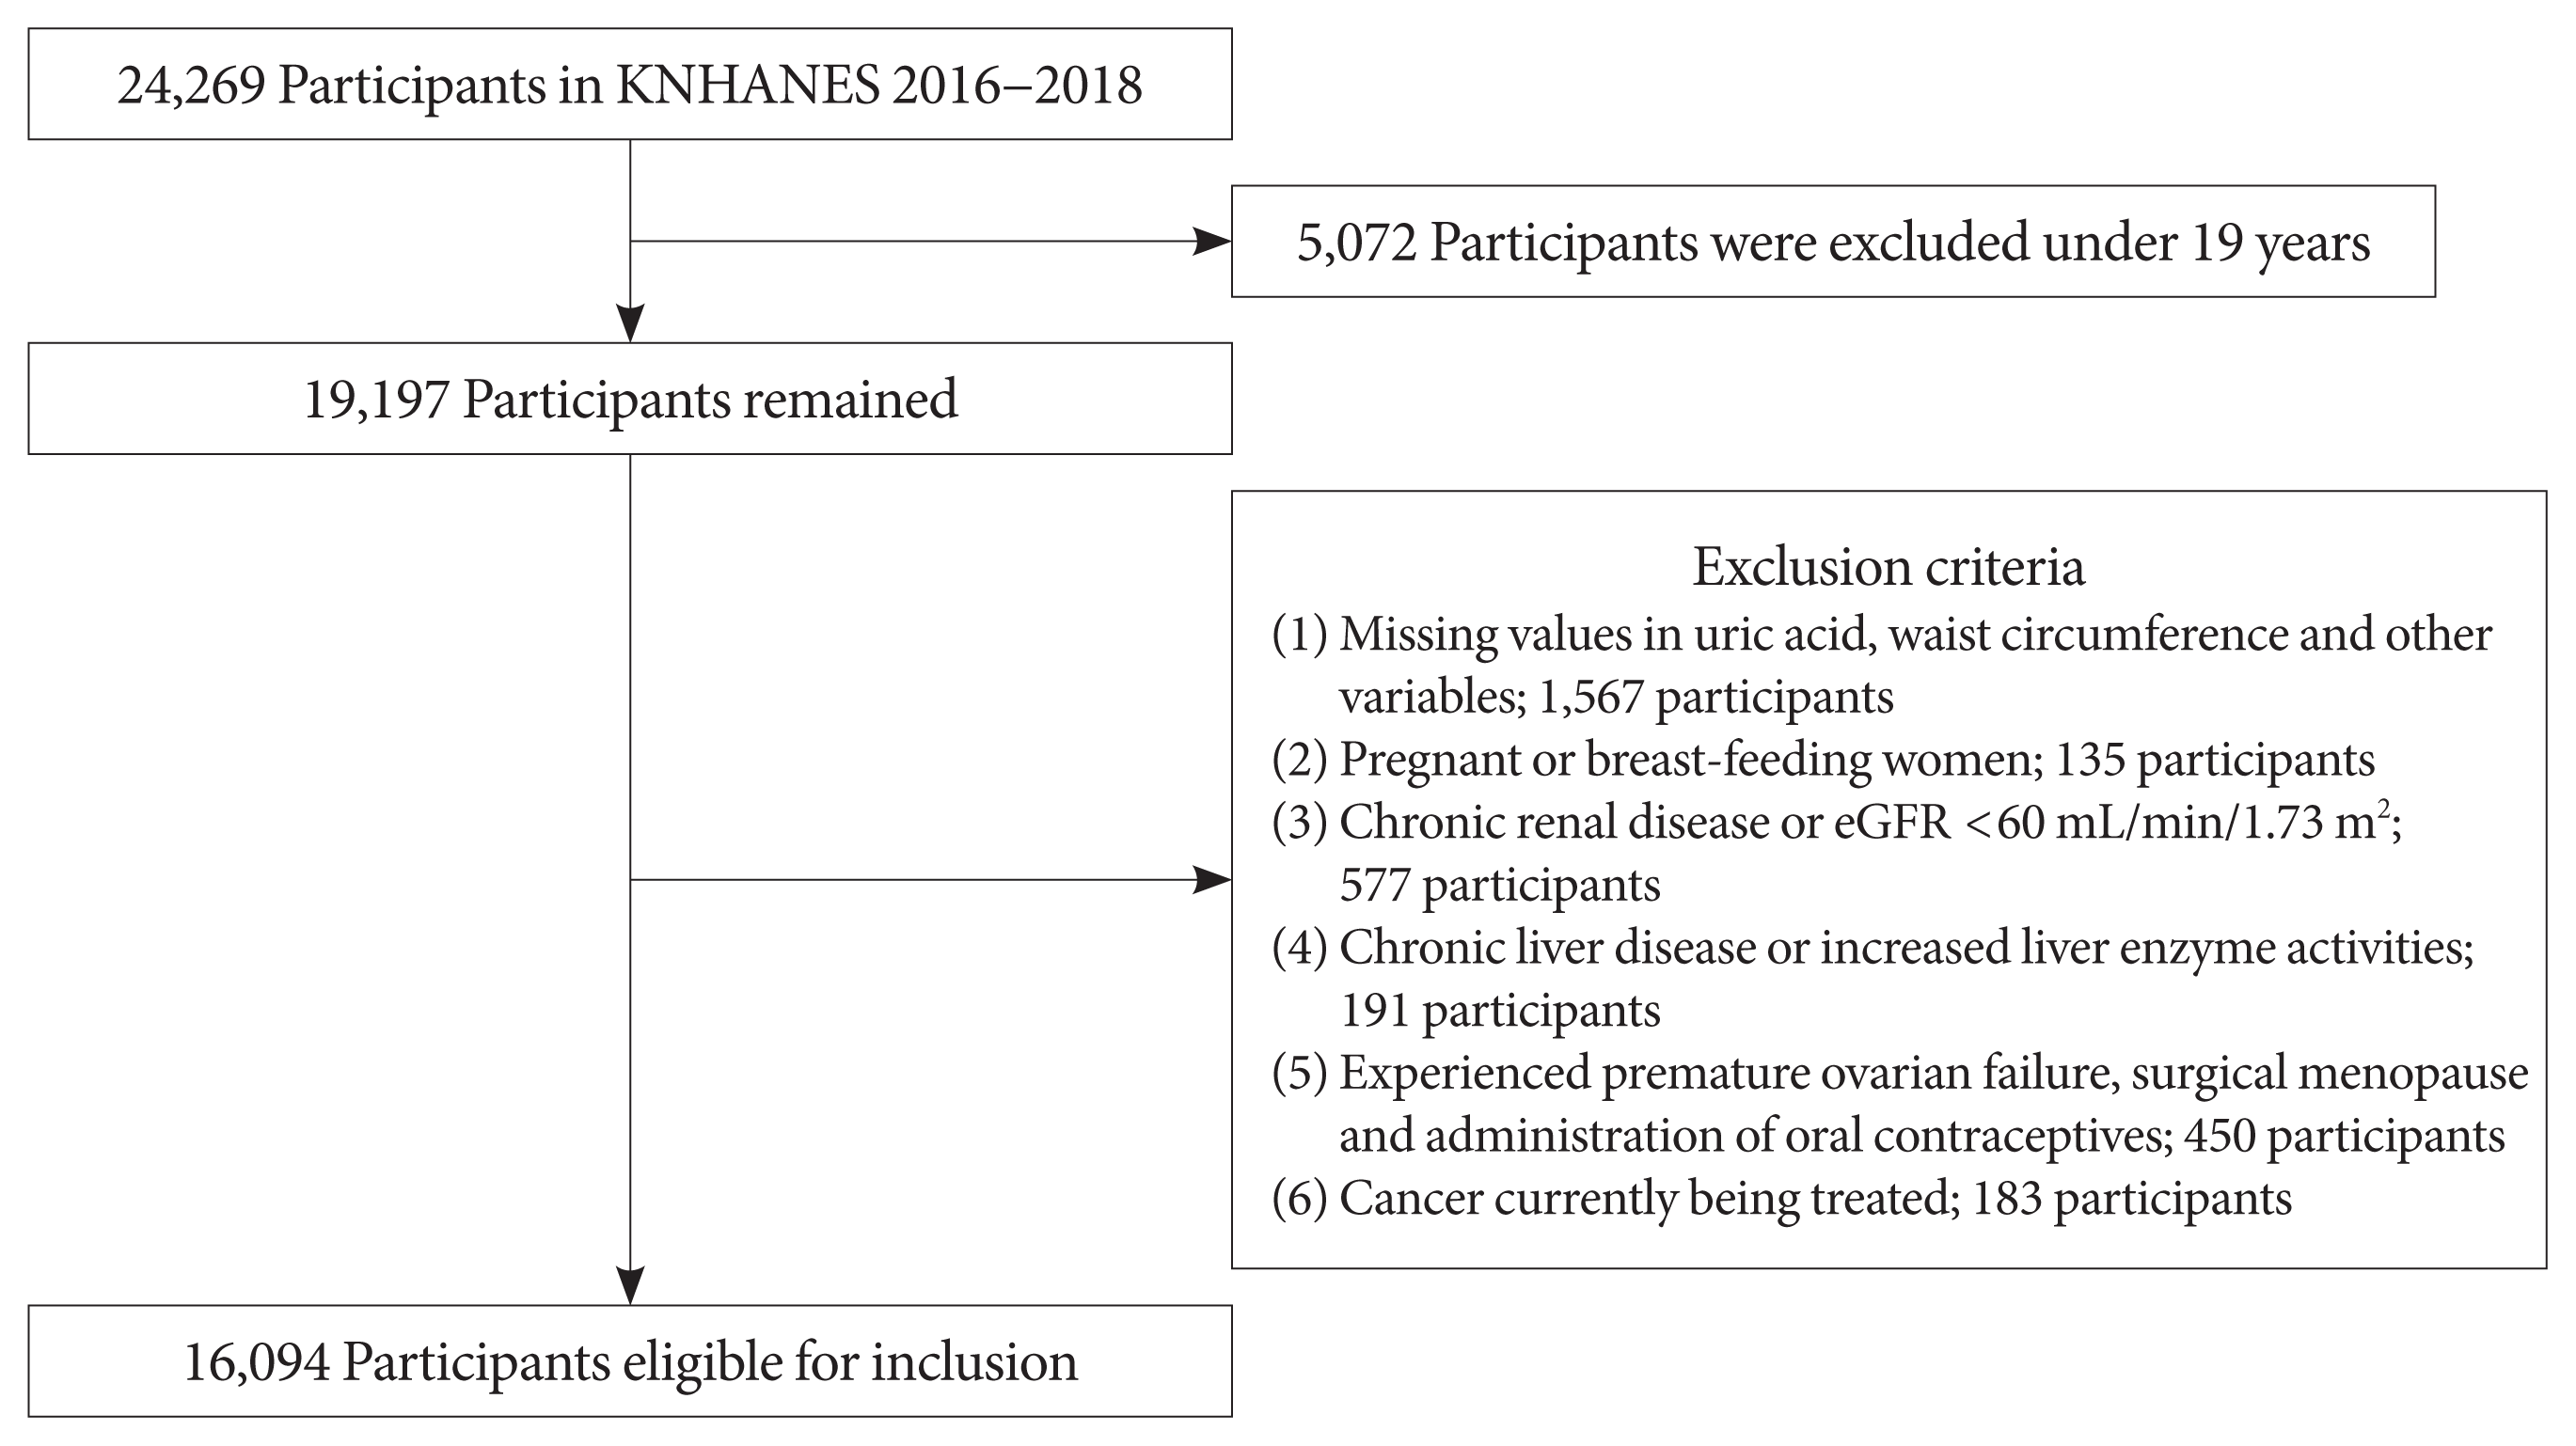
Fig. 1

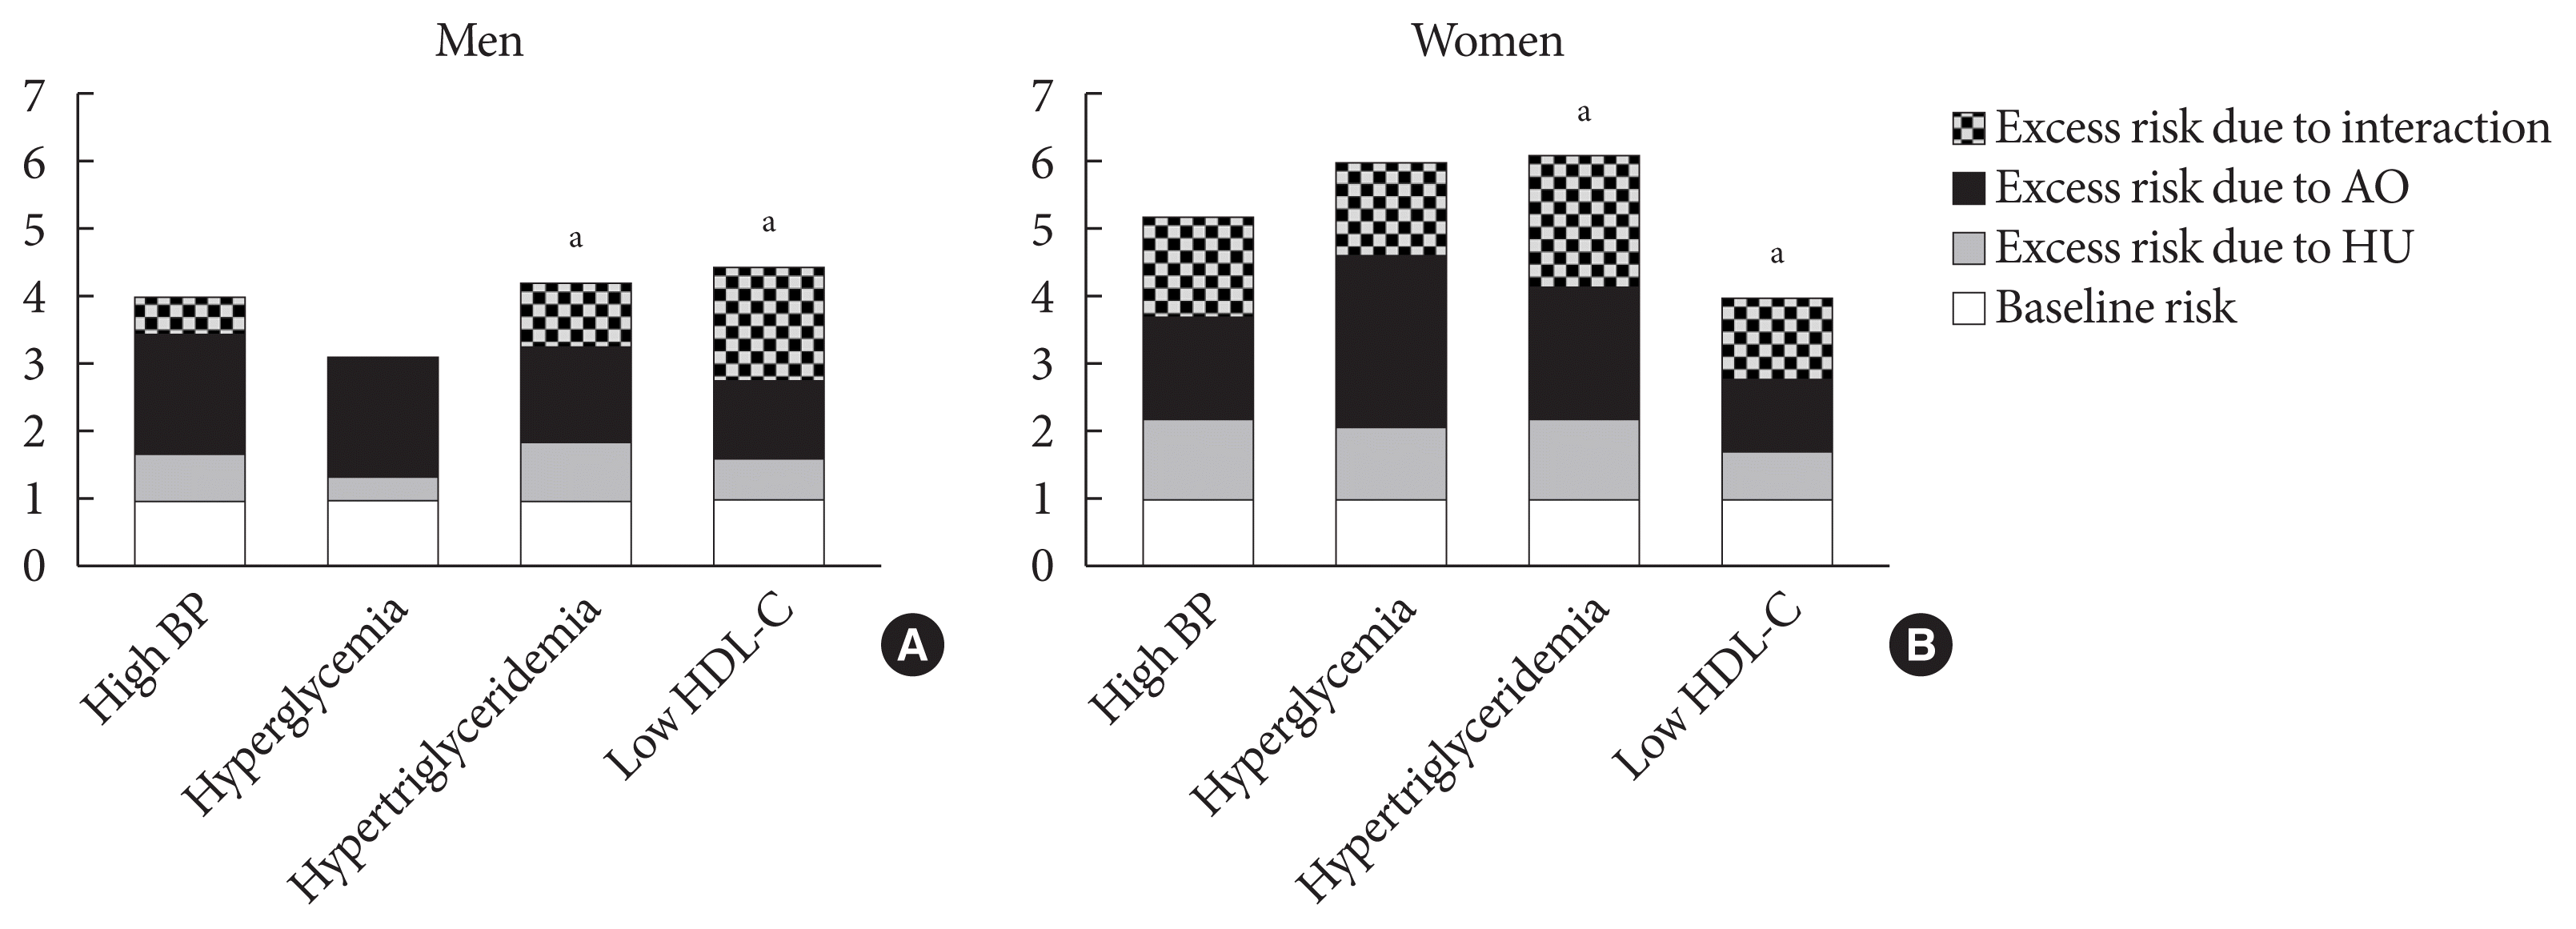
Fig. 2

Table 1
| Characteristic | Men (n=7,256) | Women (n=8,838) | ||||
|---|---|---|---|---|---|---|
|
|
|
|||||
| Normouricemia (n=5,920) | Hyperuricemiaa (n=1,336) | P value | Normouricemia (n=8,332) | Hyperuricemia (n=506) | P value | |
| Age, yr | 46.91±0.27 | 41.45±0.42 | <0.001 | 47.75±0.29 | 50.17±0.96 | 0.012 |
|
|
||||||
| BMI, kg/m2 | 24.22±0.05 | 25.77±0.11 | <0.001 | 23.12±0.05 | 26.07±0.23 | <0.001 |
|
|
||||||
| WC, cm | 85.33±0.14 | 88.72±0.3 | <0.001 | 77.63±0.16 | 85.12±0.58 | <0.001 |
|
|
||||||
| SBP, mm Hg | 119.38±0.25 | 121.18±0.42 | <0.001 | 114.87±0.26 | 120.88±1.08 | <0.001 |
|
|
||||||
| DBP, mm Hg | 77.99±0.17 | 80.8±0.34 | <0.001 | 73.36±0.14 | 76.69±0.57 | <0.001 |
|
|
||||||
| FPG, mg/dL | 102.95±0.43 | 99.67±0.51 | <0.001 | 97.01±0.26 | 101.59±1.12 | <0.001 |
|
|
||||||
| HbA1c, % | 5.69±0.01 | 5.54±0.02 | <0.001 | 5.58±0.01 | 5.77±0.05 | <0.001 |
|
|
||||||
| TG, mg/dL | 153.03±2.09 | 207.04±6.98 | <0.001 | 108.45±1.01 | 155.13±5.69 | <0.001 |
|
|
||||||
| HDL-C, mg/dL | 48.09±0.18 | 44.97±0.33 | <0.001 | 55.26±0.19 | 50.71±0.68 | <0.001 |
|
|
||||||
| LDL-C, mg/dL | 114.97±0.5 | 119.8±0.99 | <0.001 | 116.51±0.43 | 125.26±1.85 | <0.001 |
|
|
||||||
| TC, mg/dL | 190.56±0.58 | 199.67±1.25 | <0.001 | 192.84±0.48 | 204.87±1.93 | <0.001 |
|
|
||||||
| Uric acid, mg/dL | 5.44±0.02 | 7.79±0.02 | <0.001 | 4.25±0.01 | 6.55±0.03 | <0.001 |
|
|
||||||
| eGFR, mL/min/1.73 m2 | 96.54±0.35 | 92.17±0.51 | <0.001 | 101.48±0.32 | 92.2±1.04 | <0.001 |
|
|
||||||
| Smoking | 0.134 | 0.004 | ||||
| Never smoker | 1,427 (25.5) | 318 (27.1) | 7,408 (87.7) | 433 (85.2) | ||
| Ex-smoker | 2,431 (37.1) | 501 (33.6) | 494 (6.3) | 24 (4.8) | ||
| Current smoker | 2,061 (37.4) | 517 (39.3) | 429 (6.0) | 49 (10.0) | ||
|
|
||||||
| Alcohol intake | <0.001 | 0.006 | ||||
| Nondrinker | 1,043 (15.1) | 155 (10.8) | 2,842 (30.5) | 172 (29.4) | ||
| Light drinker | 4,006 (69.6) | 896 (69.3) | 5,303 (66.8) | 310 (65.0) | ||
| Moderate-to-heavy drinker | 870 (15.3) | 285 (19.9) | 186 (2.7) | 24 (5.6) | ||
|
|
||||||
| Physically active | 1,296 (24.2) | 348 (29.0) | 0.005 | 1,139 (14.8) | 76 (17.7) | 0.156 |
|
|
||||||
| Household income | 0.045 | 0.178 | ||||
| Low | 671 (16.3) | 205 (19.9) | 992 (16.7) | 60 (15.4) | ||
| Middle | 2,985 (56.4) | 669 (53.5) | 4,153 (55.6) | 271 (60.8) | ||
| High | 1,498 (27.3) | 335 (26.6) | 2,116 (27.8) | 104 (23.8) | ||
|
|
||||||
| Education level | <0.001 | 0.002 | ||||
| Elementary school or less | 809 (9.5) | 105 (4.8) | 1,962 (42.7) | 146 (24.0) | ||
| Middle school | 579 (8.6) | 104 (6.7) | 789 (8.9) | 67 (12.5) | ||
| High school | 1,883 (36.1) | 432 (37.4) | 2,347 (32.2) | 148 (32.0) | ||
| College or more | 2,337 (45.9) | 617 (51.2) | 2,863 (39.6) | 127 (31.5) | ||
|
|
||||||
| Postmenopause | - | - | - | 4,201 (42.7) | 308 (52.7) | <0.001 |
|
|
||||||
| Diabetes | 960 (13.4) | 124 (7.3) | <0.001 | 909 (9.2) | 89 (15.1) | <0.001 |
|
|
||||||
| Hypertension | 2,003 (29.0) | 496 (33.1) | 0.010 | 2,278 (22.5) | 244 (40.7) | <0.001 |
|
|
||||||
| Abdominal obesityb | 1,751 (28.4) | 601 (43.3) | <0.001 | 2,051 (21.7) | 268 (50.0) | <0.001 |
|
|
||||||
| High BPc | 2,753 (41.9) | 701 (49.8) | <0.001 | 2,903 (29.6) | 284 (48.8) | <0.001 |
|
|
||||||
| Hyperglycemiad | 2,973 (43.9) | 661 (43.7) | 0.883 | 3,098 (32.1) | 307 (53.7) | <0.001 |
|
|
||||||
| Hypertriglyceridemiae | 2,539 (41.8) | 761 (56.2) | <0.001 | 2,450 (26.0) | 259 (47.9) | <0.001 |
|
|
||||||
| Low HDL-Cf | 1,452 (22.9) | 445 (32.8) | <0.001 | 3,101 (34.9) | 277 (52.4) | <0.001 |
|
|
||||||
| MetSg | 2,093 (31.6) | 639 (44.4) | <0.001 | 2,436 (24.6) | 299 (53.0) | <0.001 |
BMI, body mass index; WC, waist circumference; SBP, systolic blood pressure; DBP, diastolic blood pressure; FPG, fasting plasma glucose; HbA1c, glycosylated hemoglobin; TG, triglyceride; HDL-C, high-density lipoprotein cholesterol; LDL-C, low-density lipoprotein cholesterol; TC, total cholesterol; eGFR, estimated glomerular filtration rate; BP, blood pressure; MetS, metabolic syndrome.
Table 2
| All | Without abdominal obesity | With abdominal obesity | ||||
|---|---|---|---|---|---|---|
|
|
|
|
||||
| Normouricemia | Hyperuricemiaa | Normouricemia | Hyperuricemia | Normouricemia | Hyperuricemia | |
| Men | ||||||
| Abdominal obesityb | 1 | 1.31 (1.02–1.69) | - | - | - | - |
| High BPc | 1 | 1.46 (1.24–1.73) | 1 | 1.63 (1.31–2.03) | 1 | 1.24 (0.95–1.61) |
| Hyperglycemiad | 1 | 1.17 (0.96–1.42) | 1 | 1.25 (1.03–1.59) | 1 | 1.09 (0.81–1.46) |
| Hypertriglyceridemiae | 1 | 1.69 (1.44–1.99) | 1 | 1.73 (1.40–2.14) | 1 | 1.68 (1.29–2.18) |
| Low HDL-Cf | 1 | 1.72 (1.45–2.03) | 1 | 1.53 (1.21–1.93) | 1 | 1.95 (1.51–2.51) |
| MetSg | 1 | 1.88 (1.55–2.29) | 1 | 2.13 (1.65–2.76) | 1 | 1.69 (1.27–2.25) |
|
|
||||||
| Women | ||||||
| Abdominal obesity | 1 | 1.34 (0.92–1.95) | - | - | - | - |
| High BP | 1 | 1.82 (1.32–2.50) | 1 | 1.97 (1.24–3.12) | 1 | 1.58 (1.02–2.44) |
| Hyperglycemia | 1 | 1.60 (1.23–2.09) | 1 | 1.74 (1.20–2.51) | 1 | 1.44 (0.94–2.18) |
| Hypertriglyceridemia | 1 | 1.85 (1.38–2.49) | 1 | 1.81 (1.19–2.76) | 1 | 1.79 (1.24–2.58) |
| Low HDL-C | 1 | 1.59 (1.23–2.06) | 1 | 1.41 (1.01–2.03) | 1 | 1.77 (1.25–2.52) |
| MetS | 1 | 2.31 (1.63–3.25) | 1 | 2.32 (1.46–3.68) | 1 | 2.11 (1.31–3.39) |
Adjusted for age, body mass index, estimated glomerular filtration rate, low-density lipoprotein cholesterol, alcohol intake, smoking status, physically active, household income, education levels, menopausal status.
Table 3
| High BPa | Hyperglycemiab | Hypertriglyceridemiac | Low HDL-Cd | |
|---|---|---|---|---|
| Men | ||||
| Group A | 1 | 1 | 1 | 1 |
| Group B | 1.72 (1.39–2.11) | 1.40 (1.11–1.77) | 1.89 (1.54–2.32) | 1.67 (1.33–2.10) |
| Group C | 2.70 (2.29–3.18) | 2.67 (2.26–3.16) | 2.37 (2.05–2.74) | 2.06 (1.74–2.43) |
| Group D | 3.97 (3.08–5.11) | 3.12 (2.42–4.03) | 4.15 (3.28–5.23) | 4.43 (3.54–5.55) |
|
|
||||
| Women | ||||
| Group A | 1 | 1 | 1 | 1 |
| Group B | 2.24 (1.46–3.42) | 2.12 (1.50–3.01) | 2.24 (1.52–3.28) | 1.76 (1.26–2.48) |
| Group C | 2.47 (2.08–2.93) | 3.46 (2.92–4.09) | 2.90 (2.48–3.38) | 1.99 (1.72–2.30) |
| Group D | 5.15 (3.25–8.16) | 5.97 (3.93–9.07) | 6.05 (4.06–9.02) | 3.98 (2.78–5.71) |
Values are presented as odds ratio (95% confidence interval). Adjusted for age, estimated glomerular filtration rate, low-density lipoprotein cholesterol, alcohol intake, smoking status, physically active, household income, education levels, menopausal status. Group A: hyperuricemia (−) and abdominal obesity (−). Group B: hyperuricemia (+) and abdominal obesity (−). Group C: hyperuricemia (−) and abdominal obesity (+). Group D: hyperuricemia (+) and abdominal obesity (+).
Table 4
| RERI (95% CI) | AP (95% CI) | SI (95% CI) | |
|---|---|---|---|
| Men | |||
| High BPa | 0.55 (−0.47 to 1.58) | 0.14 (−0.09 to 0.37) | 1.22 (0.85 to 1.77) |
| Hyperglycemiab | 0.05 (−0.81 to 0.92) | 0.02 (−0.26 to 0.29) | 1.03 (0.72 to 1.47) |
| Hypertriglyceridemiac | 0.88 (−0.14 to 1.90) | 0.21 (0.02 to 0.42)e | 1.39 (1.01 to 1.98)e |
| Low HDL-Cd | 1.70 (0.75 to 2.66)e | 0.39 (0.23 to 0.55)e | 2.03 (1.41 to 2.91)e |
|
|
|||
| Women | |||
| High BP | 1.45 (−1.07 to 3.96) | 0.28 (−0.09 to 0.66) | 1.53 (0.79 to 2.97) |
| Hyperglycemia | 1.39 (−1.35 to 4.12) | 0.23 (−0.14 to 0.60) | 1.39 (0.75 to 2.57) |
| Hypertriglyceridemia | 1.92 (−0.52 to 4.36) | 0.32 (0.05 to 0.61)e | 1.61 (1.02 to 2.69)e |
| Low HDL-C | 1.23 (−0.24 to 2.71) | 0.31 (0.07 to 0.59)e | 1.70 (1.05 to 2.95)e |
Adjusted for age, estimated glomerular filtration rate, low-density lipoprotein cholesterol, alcohol intake, smoking status, physically active, household income, education levels, menopausal status.


 PDF
PDF Citation
 Print
Print


 XML Download