Journal List > Endocrinol Metab > v.37(5) > 1516079566

Ahn, Shin, Lee, Park, Hong, and Rhee: Association of Shift Work with Normal-Weight Obesity in Community-Dwelling Adults

Abstract

Background

Shift work is associated with obesity and metabolic syndrome. However, this association in the normal-weight population remains unclear. This study aimed to investigate whether shift work is associated with normal-weight obesity (NWO).

Methods

From the nationally representative Korea National Health and Nutrition Examination Survey (KNHANES) dataset (2008 to 2011), 3,800 full-time workers aged ≥19 years with a body mass index (BMI) ≤25 kg/m2 were analysed. We defined NWO as BMI ≤25 kg/m2 and body fat percentage ≥25% in men and ≥37% in women. Working patterns were classified into “daytime,” “other than daytime,” and “shift.” Multivariable logistic regression analysis was performed to evaluate the relationship between shift work and NWO.

Results

Shift work was associated with higher odds of NWO than daytime work (adjusted odds ratio [aOR], 1.47; 95% confidence interval [CI], 1.04 to 2.09) and night/evening work (aOR, 1.87; 95% CI, 1.11 to 3.14) after adjustment for type of work, working hours, age, sex, BMI, 25-hydroxyvitamin D levels, homeostatic model assessment for insulin resistance, and other sociodemographic factors. In subgroup analyses, the association between shift work and NWO was more robust in those aged ≥60 years and those working ≥56 hours/week.

Conclusion

Shift work was associated with NWO in community-dwelling Korean adults, independent of age, sex, BMI, and other covariates.

INTRODUCTION

Shift work refers to a work pattern that periodically changes its hours [1]. Changes in working hours may be regular or irregular, including working two or more times per day. Approximately 20% of workers are engaged in shift work in the United States [2]. In addition, the proportion of shift workers increased from 17% in 2012 to 21% in 2017 according to the European Working Conditions Survey [3]. The increase in shift work can partly be explained by globalisation and the expansion of 24-hour service culture. Based on the National Statistical Office data in 2017, 9.7% of South Koreans were engaged in shift work [4].
Shift workers are exposed to several health problems. For example, shift work disrupts circadian rhythms, causes irregular sleep-wake cycles, and impairs workers’ recovery from fatigue [5], leading to lifestyle changes, job strain, and social stress. Therefore, shift work has been implicated as a risk factor for some diseases, including metabolic syndrome, cancer, cardiovascular disease, and other related chronic conditions [6,7].
Several studies have shown that shift work is associated with overweight or obesity [8]; however, the data remain conflicting and inconclusive. In a study by Karlsson et al. [6], shift workers were more obese and had higher cholesterol levels than daytime workers, indicating an association between shift work and metabolic syndrome. However, McGlynn et al. [9] reported mixed results—a positive association in a population-based sample and negative results in a cohort study—indicating that the relationship between shift work and obesity is complex and could be susceptible to multiple social determinants of health.
The concept of normal-weight obesity (NWO) differs from conventional obesity, which is generally determined by body mass index (BMI) [10]. NWO is a condition in which BMI is within the normal range; however, the body composition or body fat (BF) distribution is abnormal; this pattern is also called metabolic obesity with a normal weight [11]. Although NWO has also been reported to be associated with increased cardiometabolic risk, it is easily underdiagnosed and underestimated because it inherently involves a BMI within the normal range [12]. However, there is a lack of data regarding the association between shift work and NWO.
Therefore, this study investigated the relationship between shift work and NWO classified by BF percentage using nationally representative data from the Korea National Health and Nutrition Examination Survey (KNHANES).

METHODS

Subjects

This study was based on data acquired from the KNHANES, a nationwide, population-based, cross-sectional survey and health examination conducted by the Korea Disease Control and Prevention Agency [13]. We used data from the last 2 years (2008 to 2009) of KNHANES IV (2007 to 2009) and the first 2 years (2010 to 2011) of KNHANES V (2010 to 2012) because of the available data on BF percentage. The KNHANES uses nationally representative samples from the general population of Korea and a stratified multistage probability sampling design to produce representative data among households. Informed consent was obtained from all subjects involved in the study. All survey protocols were approved by the Institutional Review Board of the Korea Disease Control and Prevention Agency (approval number: 2018-01-03-P-A).
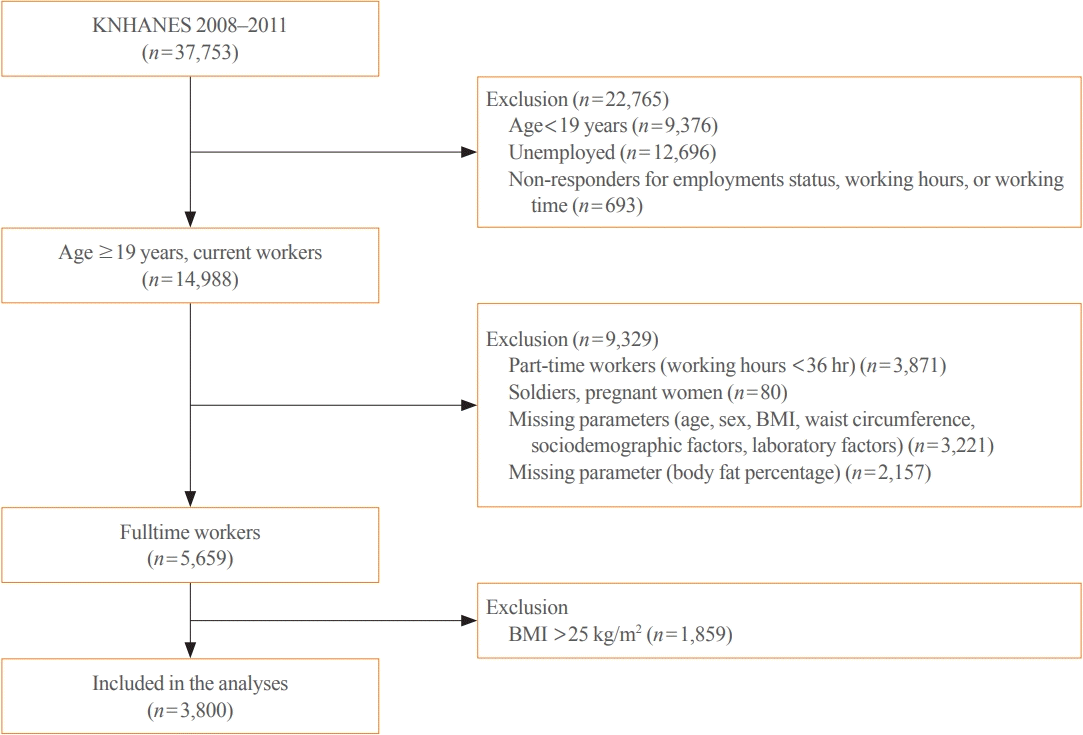
A total of 37,753 participants were enrolled in the KNHANES IV–V (2008–2011). We then excluded those aged <19 years, unemployed participants, and those who did not complete surveys on employment status, working hours, and working time. Part-time workers (working hours <36 hours, based on the definition of the Korea Labour Institute), soldiers, pregnant women, and those with missing parameters that were needed for the statistical analysis were also excluded [14]. Additionally, full-time workers with a BMI >25 kg/m2 were excluded, and 3,800 participants were finally enrolled in the study (Fig. 1).

Definition of working parameters

The participants’ working time, type of work, and working hours per week were recorded using a self-administered questionnaire. These working parameters were stratified as previously described [15]. Study participants reported their working time by selecting one of the five examples: (1) daytime (6:00 AM–6:00 PM); (2) evening (2:00 PM–12:00 AM); (3) night (9:00 PM–8:00 AM); (4) regular shift time (day and night or regular 24 hours); and (5) irregular shift time (including two times or more daily). We combined (2) and (3) into “other than daytime” and combined (4) and (5) into “shift work.” Participants reported their occupations according to the major groups of the Korean Standard Classification of Occupations, which was based on the International Standard Classification of Occupations [16]. Occupations were categorized into three groups. Managers, professionals, and clerks were classified as office workers; service and sales workers were classified as service workers; and skilled agricultural, forestry, and fishery workers, craft and related trades workers, plant and machine operators, assemblers, and elementary manual workers were classified as manual workers. Data on working hours were obtained using a self-reported questionnaire. Working hours were categorized by tertiles (36–44, 45–55, and ≥56 hours/week).

Definition of NWO

The BF percentage was used to set the cut-off value for NWO. We defined NWO as BMI ≤25 kg/m2 and BF percentage ≥25% in men and ≥37% in women, according to the previous guidelines and other published papers [17-19]. Participants with a BMI ≤25 kg/m2 and a BF percentage lower than the NWO cut-off, were defined as normal-weight lean (NWL). The BF percentage (head excluded), which was calculated as total fat mass/total mass×100, was measured using dual-energy X-ray absorptiometry (DXA; QDR 4500A, Hologic Inc., Waltham, MA, USA) equipment located in mobile examination centres.

Measurement of clinical and biochemical variables

Participant demographics, anthropometrics, nutritional intake, medical history (including smoking and alcohol history), and physical activity were collected using standardized health questionnaires. Participants were classified by their smoking status as current smokers or non-smokers. Regular alcohol drinkers were defined as those who currently drank alcohol more than once per month, and all others were defined as non-drinkers. Regular physical activity was evaluated using the International Physical Activity Questionnaire [20] and defined as engaging in vigorous (≥20 minutes at a time, at least three times per week), moderate (≥30 minutes at a time, at least five times per week), or walking activity (≥30 minutes at a time, at least five times per week). The educational level was divided into four categories: elementary school or lower, middle school, high school, and college or higher. Household income levels were categorized into four groups according to income quartiles: low, middle-low, middle-high, and high. Hypertension was defined as systolic blood pressure ≥140 mm Hg, diastolic blood pressure ≥90 mm Hg, or the use of antihypertensive medications. Diabetes mellitus (DM) was considered to be present if the fasting glucose level was ≥126 mg/dL or if a subject was taking oral hypoglycaemic agents or insulin. Energy intake was calculated using a self-administered questionnaire based on reflection for the past 24 hours.
Blood was drawn from the medial cubital or cephalic vein for various biomedical analyses after 8 hours of fasting. The total cholesterol, triglycerides, high-density lipoprotein, insulin, and glucose levels were measured enzymatically using a Hitachi automatic analyser 7600 (Hitachi, Tokyo, Japan). Serum 25-hydroxyvitamin D (25(OH)D) levels were measured using a 1470 Wizard gamma counter (Perkin Elmer, Turku, Finland) and by radioimmunoassay (RIA) (DiaSorin, Stillwater, MN, USA). The homeostasis model assessment-insulin resistance (HOMA-IR) scores were calculated using the following equation: fasting insulin (μIU/mL)×fasting glucose (mg/dL)/405.

Statistical analyses

First, continuous variables were compared between working patterns using one-way analysis of covariance or the Kruskal-Wallis test, and categorical variables were compared using the chi-square test. A post hoc comparison analysis was performed by applying the Bonferroni correction and the Dunn procedure to determine significant differences between the groups. For the Bonferroni correction, the P value of each test was divided by the number of comparisons to compensate for multiple tests. Continuous variables were then presented as means with standard deviations or medians with interquartile ranges. Categorical variables were summarised as frequencies and percentages. Binary logistic regression was used to evaluate the relative contribution of potential determinants for NWO and assess the association of shift work with NWO, with adjustment for covariates including age, sex, BMI, current smoking, physical activity, educational attainment, working time, type of work, working hours, hypertension, DM, energy intake, 25(OH)D levels, and log-transformed HOMA-IR. Next, subgroup analyses with interaction terms were performed to investigate the pre-specified possible effect modifiers in the association between shift work and NWO. Subjects were grouped by age (≥60 or <60 years) and tertiles of working hours. In addition, further subgroup analyses were done to evaluate interactions within subgroups according to the KNHANES investigation time and medication history. All statistical analyses were performed using STATA version 14.1 (Stata Corp., College Station, TX, USA). Statistical significance was set at a two-sided P<0.05.

RESULTS

Study subjects

The mean age of study participants was 46 years, and men comprised 52.7% (n=2,001) (Table 1). The overwhelming majority (3,336/3,800, 87.8%) of participants were daytime workers, 235 (6.2%) were evening or night workers, and 229 (6.0%) were shift workers. Shift workers had a higher proportion of men and manual workers and higher weight, waist circumference, and energy intake than the other groups. In addition, shift workers were younger, had longer working hours and lower 25(OH)D levels, and were more likely to consume alcohol than daytime workers. Shift workers had a higher prevalence of NWO and higher fasting glucose levels than evening or night workers. Daytime workers were older, engaged more in manual work and less in service work, and were less likely to smoke and consume alcohol than evening or night workers. In addition, they had shorter working hours, higher levels of educational attainment, and higher cholesterol and 25(OH)D levels than evening or night workers.

Associations with NWO and working time, demographic, behavioural, health-related, and occupational characteristics

Regression analysis was performed to determine the association between NWO and other clinical factors, including working hours (Table 2). In the univariable analysis, shift work was associated with elevated odds of NWO when daytime work was set as a reference. BMI, current smoking, physical activity, educational attainment, type of work, hypertension, energy intake, 25(OH)D levels, and log-transformed HOMA-IR were also significantly associated with NWO. In multivariate regression analysis, after adjusting for age, sex, and other significant variables, shift time workers were still associated with higher odds of NWO than daytime workers (adjusted odds ratio [aOR], 1.47; 95% confidence interval [CI], 1.04 to 2.09) and even in night/evening workers (aOR, 1.87; 95% CI, 1.11 to 3.14) (Table 3). Additionally, office workers showed elevated odds of NWO compared with manual workers, and low levels of physical activity, energy intake, and 25(OH)D were significantly associated with NWO.

Prespecified subgroup analysis with association between shift work and NWO

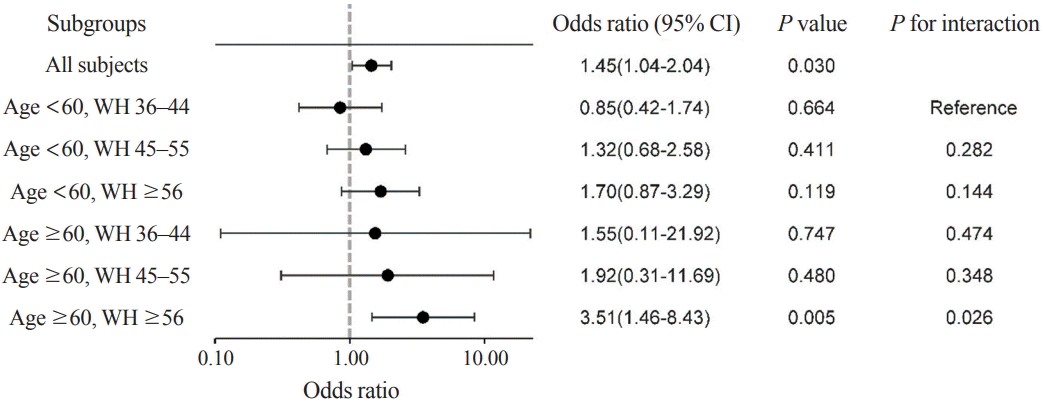
When the participants were classified by age and working hours, shift workers aged ≥60 years and working hours ≥56 hours/week had a significantly higher aOR of having NWO than other groups (aOR, 3.51; 95% CI, 1.46 to 8.43; P=0.005; P for interaction=0.026) (Fig. 2). We also performed a subgroup analysis based on the cohort (KNHANES IV vs. KNHANES V) and medication history. The analysis showed consistent results and non-significant interactions in each subgroup (Supplemental Table S1).

DISCUSSION

This study assessed the relationship between shift work and NWO in a large representative population of Korean community-dwelling adults. Shift work was associated with greater odds of NWO than daytime and night/evening workers, despite adjustment for age, sex, health-related lifestyles, type of work, comorbidities, dietary intake, and HOMA-IR (aOR, 1.47; 95% CI, 1.04 to 2.09 and aOR, 1.87; 95% CI, 1.11 to 3.14, respectively). In the subgroup analysis, the association between shift work and NWO showed more robust results in those aged ≥60 years and in those with working hours ≥56 hours/week.
Shift work is a working pattern that is increasing globally and sleep promotes appetite by altering the leptin and ghrelin levels, which are hormones that control appetite, and generates a preference for a calorie-rich diet [22,23]. Stressful conditions may affect eating behaviour, inducing individuals to eat large quantities of food, and subsequently contribute to obesity [24]. Circadian disruption can be a biological explanation for the intrinsic aspect of this relationship [5,25]. Although the exact mechanism is not fully understood, several animal and human studies have demonstrated a causal relationship between circadian disruption and obesity [26]. Shift work, including night shifts, can cause nocturnal melatonin suppression, which might induce insulin resistance and glucose intolerance, leading to obesity [27]. Circadian disruption can also induce loss of cortisol rhythmicity, and high cortisol level can cause obesity [28].
Previous studies have examined the association between shift work and obesity, which is directly related to multiple metabolic diseases [8,29-31]. In a recent meta-analysis, shift work was found to be positively associated with the risk of overweight (relative risk [RR], 1.25; 95% CI, 1.08 to 1.44) and obesity (RR, 1.17; 95% CI, 1.12 to 1.22) when compared to non-shift workers [8]. In nurses, shift work was associated with an increase in waist circumference, postprandial glucose, and a higher risk of type 2 DM [29,30]. In a prospective cohort study conducted among Chinese workers, permanent night work and irregular night shift work were more likely to result in overweight or abdominal obesity than rotating night shift work [28]. Additionally, Son et al. [15] showed a positive association between shift work and obesity in male manual workers (aOR, 1.78; 95% CI, 1.050 to 3.015), which is similar to our results, but not in the male non-manual and female worker groups. In our study, there was no difference according to sex, and the odds ratio of NWO was higher in shift workers than in evening or night workers.
Most previous studies on shift work and metabolic disorders have defined obesity using BMI [8]. BMI has the advantage of being simple and easy to measure; therefore, it is the most commonly used method for measuring the degree of obesity. However, BMI is limited in that it cannot distinguish fat mass from fat-free mass [32]. According to a relatively recent study examining the association between BMI and DM, cardiovascular disease, and mortality, the cut-off point for BMI was different for each disease and showed a reverse J-shape relationship with all-cause mortality [33]. In particular, Asians have a lower BMI but a higher BF ratio than other races, making them suitable for NWO research [34]. Therefore, this study investigated the relationship between NWO and shift work using Korean community-dwelling adults. Globally, the prevalence of NWO in the general population is 4.5% to 22%, and the prevalence is therefore higher in normal-weight individuals, reaching 29% to 46% [12,35,36]. Compared to NWL, NWO increases susceptibility to inflammation, oxidative stress, and metabolic abnormalities and exacerbates the risk of cardiovascular morbidity and mortality [12]. Comparing shift work and NWO can evaluate the determinant effect of shift work from a new perspective, unlike previous studies that studied the correlation based on BMI.
In the subgroup analysis, the association of shift work with NWO seemed more robust in subjects aged ≥60 years and with working hours of ≥56 hours. A similar interaction was found in a recently published paper that showed that old age is independently associated with a stronger relationship between shift work and being overweight (BMI ≥25 kg/m2) [37]. The moderating role of aging might be explained by a decreased ability for circadian adjustment to shift work [38]. Working long hours has also been associated with obesity, possibly due to a lack of time to exercise, poor eating habits, and lack of sleep [39].
Our study has several strengths. First, it was based on a nationally representative, community-derived dataset from the KNHANES, including men and women. Second, in measuring the degree of BF, NWO was defined using the BF percentage instead of the BMI, which has a relatively low sensitivity [32]. In addition, multiple variables, such as socioeconomic, health, work-related factors, and laboratory results, were adjusted to confirm the correlation between shift work and NWO.
However, our study has several limitations. First, this was cross-sectional in design; thus, it is difficult to draw conclusions regarding a causal relationship between shift work and NWO. Second, the questionnaire recorded the working parameters regarding their working status for the previous year only. In addition, the data did not include specific information, such as details about how long the participants were engaged in the same pattern of work and how often the shift workers changed their working patterns. Therefore, we could not assess how long-term engagement in shift work might be associated with NWO. Third, the criteria for defining NWO, which include the BF percentage cut-off and BF measurement methods, have not been established [40,41]. However, in the AACE/ACE position statement published in 1998, a BF percentage of ≥25% in men and ≥35% in women was defined as indicating obesity [17]. Other studies have suggested a BF percentage cut-off of 20%–25% for men and 30%–37% for women [18]. In our study, NWO was defined using the cut-off of 25% for men and 37% for women, which is the strictest cut-off compared to previous studies. Although this cut-off is similar to that of a previous study in Korea [19], it has not been widely validated yet. Finally, the DXA scan used for NWO diagnosis cannot discriminate between visceral and subcutaneous fat. Because visceral fat or subcutaneous fat have different associations with metabolic profiles [42], the fact that we did not distinguish visceral fat from subcutaneous fat is a limitation of this study. However, it has been reported that the absolute amount of fat, whether visceral or subcutaneous, might have a harmful effect on metabolic profiles [42]. Additionally, NWO is known to increase cardiometabolic risk as an obesity phenotype [12]. Therefore, we speculated that the BF percentage from DXA scans could have clinical implications.
In conclusion, we observed higher odds of NWO in shift workers than in those with other working patterns among Korean community-dwelling adults with BMI ≤25 kg/m2. Although our findings should be confirmed in a prospective multi-ethnic study, our study suggests that shift workers should be considered to be at high risk for metabolic disorders and deserve special attention.

Notes

CONFLICTS OF INTEREST

No potential conflict of interest relevant to this article was reported.

AUTHOR CONTRIBUTION

Conception or design: C.W.A., S.L., H.S.P., N.H., Y.L. Acquisition, analysis, or interpretation of data: C.W.A., S.S., S.L., N.H. Drafting the work or revising: S.S., H.S.P. Final approval of the manuscript: H.S.P., Y.L.

Supplementary Information

Supplemental Table S1.
Risk of Having Normal-Weight Obesity by Subgroup Analysis (Shift Workers Compared to Non-Shift Workers)
enm-2022-1532-suppl.pdf

REFERENCES

1. Williams C. Work-life balance of shift workers. Perspect Labour Income. 2008; 9:5–16.
2. Messenger J. ILO future of work research paper series: working time and the future of work. Geneva: International Labour Organization;2018. p. 44.
3. Wilczynska A, Cabrita J, Parent-Thirion A, Biletta I, Vargas O, et al. 6th European working conditions survey: 2017 update. Luxembourg: Publications Office of the European Union;2017. [cited 2022 Sep 29]. Available from: https://data.europa.eu/doi/10.2806/422172.
4. Baek K, Ha K. Work characteristics and health status of shift workers based on the results of the Fifth Korean Working Conditions Survey. J Korean Soc Occup Environ Hyg. 2019; 29:550–61.
5. Oosterman JE, Wopereis S, Kalsbeek A. The circadian clock, shift work, and tissue-specific insulin resistance. Endocrinology. 2020; 161:bqaa180.
crossref
6. Karlsson B, Knutsson A, Lindahl B. Is there an association between shift work and having a metabolic syndrome? Results from a population based study of 27,485 people. Occup Environ Med. 2001; 58:747–52.
7. Rivera AS, Akanbi M, O’Dwyer LC, McHugh M. Shift work and long work hours and their association with chronic health conditions: a systematic review of systematic reviews with meta-analyses. PLoS One. 2020; 15:e0231037.
crossref
8. Liu Q, Shi J, Duan P, Liu B, Li T, Wang C, et al. Is shift work associated with a higher risk of overweight or obesity? A systematic review of observational studies with meta-analysis. Int J Epidemiol. 2018; 47:1956–71.
crossref
9. McGlynn N, Kirsh VA, Cotterchio M, Harris MA, Nadalin V, Kreiger N. Shift work and obesity among Canadian women: a cross-sectional study using a novel exposure assessment tool. PLoS One. 2015; 10:e0137561.
crossref
10. De Lorenzo A, Soldati L, Sarlo F, Calvani M, Di Lorenzo N, Di Renzo L. New obesity classification criteria as a tool for bariatric surgery indication. World J Gastroenterol. 2016; 22:681–703.
crossref
11. Franco LP, Morais CC, Cominetti C. Normal-weight obesity syndrome: diagnosis, prevalence, and clinical implications. Nutr Rev. 2016; 74:558–70.
crossref
12. Wijayatunga NN, Dhurandhar EJ. Normal weight obesity and unaddressed cardiometabolic health risk-a narrative review. Int J Obes (Lond). 2021; 45:2141–55.
crossref
13. Hong S, Oh HJ, Choi H, Kim JG, Lim SK, Kim EK, et al. Characteristics of body fat, body fat percentage and other body composition for Koreans from KNHANES IV. J Korean Med Sci. 2011; 26:1599–605.
crossref
14. Korea Labor Institute. Center for labor policy analysis 2015. Sejong: Korea Labor Institute;2015.
15. Son M, Ye BJ, Kim JI, Kang S, Jung KY. Association between shift work and obesity according to body fat percentage in Korean wage workers: data from the fourth and the fifth Korea National Health and Nutrition Examination Survey (KNHANES 2008-2011). Ann Occup Environ Med. 2015; 27:32.
crossref
16. Riley EC. International standard classification of occupations. Geneva: Lippincott Williams & Wilkins;1959.
17. Dickey RA, Bartuska D, Bray GW, Callaway CW, Davidson ET, Feld S, et al. AACE/ACE position statement on the prevention, diagnosis, and treatment of obesity (1998 revision). Endocr Pract. 1998; 4:297–350.
18. Oliveros E, Somers VK, Sochor O, Goel K, Lopez-Jimenez F. The concept of normal weight obesity. Prog Cardiovasc Dis. 2014; 56:426–33.
crossref
19. Kim MK, Han K, Kwon HS, Song KH, Yim HW, Lee WC, et al. Normal weight obesity in Korean adults. Clin Endocrinol (Oxf). 2014; 80:214–20.
crossref
20. Craig CL, Marshall AL, Sjostrom M, Bauman AE, Booth ML, Ainsworth BE, et al. International physical activity questionnaire: 12-country reliability and validity. Med Sci Sports Exerc. 2003; 35:1381–95.
crossref
21. Zarrinpar A, Chaix A, Panda S. Daily eating patterns and their impact on health and disease. Trends Endocrinol Metab. 2016; 27:69–83.
crossref
22. Bayon V, Leger D, Gomez-Merino D, Vecchierini MF, Chennaoui M. Sleep debt and obesity. Ann Med. 2014; 46:264–72.
crossref
23. Hulsegge G, Boer JM, van der Beek AJ, Verschuren WM, Sluijs I, Vermeulen R, et al. Shift workers have a similar diet quality but higher energy intake than day workers. Scand J Work Environ Health. 2016; 42:459–68.
crossref
24. Nishitani N, Sakakibara H. Relationship of obesity to job stress and eating behavior in male Japanese workers. Int J Obes (Lond). 2006; 30:528–33.
crossref
25. Stenvers DJ, Scheer FA, Schrauwen P, la Fleur SE, Kalsbeek A. Circadian clocks and insulin resistance. Nat Rev Endocrinol. 2019; 15:75–89.
crossref
26. de Goede P, Sen S, Oosterman JE, Foppen E, Jansen R, la Fleur SE, et al. Differential effects of diet composition and timing of feeding behavior on rat brown adipose tissue and skeletal muscle peripheral clocks. Neurobiol Sleep Circadian Rhythms. 2017; 4:24–33.
crossref
27. Kim TW, Jeong JH, Hong SC. The impact of sleep and circadian disturbance on hormones and metabolism. Int J Endocrinol. 2015; 2015:591729.
crossref
28. Manenschijn L, van Kruysbergen RG, de Jong FH, Koper JW, van Rossum EF. Shift work at young age is associated with elevated long-term cortisol levels and body mass index. J Clin Endocrinol Metab. 2011; 96:E1862–5.
crossref
29. Lee GJ, Kim K, Kim SY, Kim JH, Suh C, Son BC, et al. Effects of shift work on abdominal obesity among 20-39-year-old female nurses: a 5-year retrospective longitudinal study. Ann Occup Environ Med. 2016; 28:69.
crossref
30. Shan Z, Li Y, Zong G, Guo Y, Li J, Manson JE, et al. Rotating night shift work and adherence to unhealthy lifestyle in predicting risk of type 2 diabetes: results from two large US cohorts of female nurses. BMJ. 2018; 363:k4641.
crossref
31. Sun M, Feng W, Wang F, Zhang L, Wu Z, Li Z, et al. Night shift work exposure profile and obesity: baseline results from a Chinese night shift worker cohort. PLoS One. 2018; 13:e0196989.
crossref
32. Okorodudu DO, Jumean MF, Montori VM, Romero-Corral A, Somers VK, Erwin PJ, et al. Diagnostic performance of body mass index to identify obesity as defined by body adiposity: a systematic review and meta-analysis. Int J Obes (Lond). 2010; 34:791–9.
crossref
33. Bae JC, Cho NH, Kim JH, Hur KY, Jin SM, Lee MK. Association of body mass index with the risk of incident type 2 diabetes, cardiovascular disease, and all-cause mortality: a community-based prospective study. Endocrinol Metab (Seoul). 2020; 35:416–24.
crossref
34. Deurenberg P, Deurenberg-Yap M, Guricci S. Asians are different from Caucasians and from each other in their body mass index/body fat per cent relationship. Obes Rev. 2002; 3:141–6.
crossref
35. Martinez KE, Tucker LA, Bailey BW, LeCheminant JD. Expanded normal weight obesity and insulin resistance in US adults of the National Health and Nutrition Examination Survey. J Diabetes Res. 2017; 2017:9502643.
crossref
36. Ohlsson B, Manjer J. Sociodemographic and lifestyle factors in relation to overweight defined by BMI and “normal-weight obesity”. J Obes. 2020; 2020:2070297.
crossref
37. Hulsegge G, van Mechelen W, Paagman H, Proper KI, Anema JR. The moderating role of lifestyle, age, and years working in shifts in the relationship between shift work and being overweight. Int Arch Occup Environ Health. 2020; 93:697–705.
crossref
38. Kecklund G, Axelsson J. Health consequences of shift work and insufficient sleep. BMJ. 2016; 355:i5210.
crossref
39. Guner U, Guner N. The relationship between long working hours and weight gain in older workers in Europe. Work. 2020; 67:753–9.
40. Ho-Pham LT, Campbell LV, Nguyen TV. More on body fat cutoff points. Mayo Clin Proc. 2011; 86:584.
crossref
41. Marques-Vidal P, Chiolero A, Paccaud F. Large differences in the prevalence of normal weight obesity using various cut-offs for excess body fat. E Spen Eur E J Clin Nutr Metab. 2008; 3:e159–62.
crossref
42. Kwon H, Kim D, Kim JS. Body fat distribution and the risk of incident metabolic syndrome: a longitudinal cohort study. Sci Rep. 2017; 7:10955.
crossref

Fig. 1.
Flowchart of the study population from the Korea National Health and Nutrition Examination Survey (KNHANES) VII (2008 to 2011) showing inclusions and exclusions. BMI, body mass index.
enm-2022-1532f1.tif
Fig. 2.
Subgroup analysis and interaction terms for the association with shift work versus non-shift work and normal-weight obesity. WH, working hours; CI, confidence interval.
enm-2022-1532f2.tif
Table 1.
Baseline Characteristics of Study Participants according to Working Pattern
Characteristic Total (n=3,800) Daytime worker (n=3,336) Evening or night worker (n=235) Shift worker (n=229) P value
Age, yr 46.0±13.9 46.4±14.0 42.6±12.5 43.7±13.7 <0.001a,c
Male sex 2,001 (52.7) 1,736 (52.0) 110 (46.8) 155 (67.7) <0.001a,b
Type of work <0.001a,b,c
Manual worker 1,742 (45.8) 1,555 (46.6) 59 (25.1) 128 (55.9)
Office worker 1,295 (34.1) 1,194 (35.8) 56 (23.8) 45 (19.7)
Service worker 763 (20.1) 587 (17.6) 120 (51.1) 56 (24.4)
Working hours, hr/wk 49 (40–60) 48 (40–60) 54 (42–70) 51 (40–65) <0.001a,c
Working hour tertiles, hr <0.001a,c
36–44 1,308 (34.4) 1,176 (35.2) 61 (26.0) 71 (31.0)
45–55 1,245 (32.8) 1,122 (33.6) 61 (26.0) 62 (27.1)
56 1,247 (32.8) 1,038 (31.2) 113 (48.0) 96 (41.9)
Weight, kg 58.7±8.5 58.6±8.5 58.6±8.0 61.1±8.5 <0.001a,b
BMI, kg/m2 22.0±2.0 22.0±2.0 21.8±2.1 22.1±2.0 0.336
Waist circumference, cm 77.2±7.5 77.1±7.4 76.5±7.4 78.6±9.1 0.006a,b
Current smoker 951 (25.0) 806 (24.2) 75 (31.9) 70 (30.6) 0.004c
Alcohol drinker 3,010 (79.2) 2,608 (78.2) 202 (86.1) 200 (87.3) <0.001a,c
Physical activity 2,193 (57.7) 1,947 (58.3) 126 (53.6) 120 (52.4) 0.089
Educational attainment <0.001c
Elementary school or lower 800 (21.1) 749 (22.5) 27 (11.5) 24 (10.5)
Middle school 433 (11.4) 382 (11.4) 26 (11.1) 25 (10.9)
High school 1,222 (34.0) 1,066 (32.0) 115 (48.9) 111 (48.5)
College or higher 1,275 (33.6) 1,139 (34.1) 67 (28.5) 69 (30.1)
Household income 0.040
Low 468 (12.4) 431 (13.0) 21 (9.0) 16 (7.1)
Middle-low 898 (23.8) 781 (23.6) 50 (26.7) 67 (29.6)
Middle-high 1,166 (30.9) 1,017 (30.7) 78 (33.8) 71 (31.4)
High 1,237 (32.6) 1,083 (32.7) 82 (35.5) 72 (31.9)
Hypertension 651 (17.1) 582 (17.5) 39 (16.6) 30 (13.1) 0.234
Diabetes mellitus 216 (5.7) 195 (5.9) 6 (2.6) 15 (6.6) 0.092
Energy intake, g/day 1,923 (1,481–2,488) 1,906 (1,482–2,469) 1,875 (1,380–2,382) 2,100 (1,590–2,648) 0.005a,b
Fasting glucose, mg/dL 94.9±20.3 94.9±19.0 91.9±16.7 96.8±35.4 0.031b
Insulin, pmol/L 8.6±3.5 8.6±3.3 8.3±3.6 8.7±5.9 0.419
HOMA-IR 2.03±1.04 2.03±0.97 1.90±0.91 2.11±1.90 0.081
Cholesterol, mg/dL 183.7±34.0 184.3±34.1 178.6±32.7 180.3±33.0 0.014c
HDL cholesterol, mg/dL 49.7±10.8 49.6±10.8 51.1±10.4 49.0±10.7 0.079
Triglyceride, mg/dL 92 (64–140) 92 (64–139) 90 (62–138) 94 (62–150) 0.850
25(OH)D, ng/mL 19.2±7.3 19.4±7.3 17.9±6.4 17.2±6.7 <0.001a,c
NWO 666 (17.5) 580 (17.4) 33 (14.0) 53 (23.1) 0.030b

Values are expressed as mean±standard deviation, number (%), or median (interquartile range).

BMI, body mass index; HOMA-IR, homeostasis model assessment-insulin resistance; HDL, high-density lipoprotein; 25(OH)D, 25-hydroxyvitamin D; NWO, normal-weight obesity.

Significant differences between groups: a(Shift worker–Daytime worker); b(Shift worker–Evening or night worker); c(Daytime worker–Evening or night worker).

Table 2.
Univariable and Multivariable-Adjusted Odds Ratios for Normal-Weight Obesity
Variable Unadjusted
Adjusted
Odds ratio (95% CI) P value Odds ratio (95% CI) P value
Working pattern
Daytime 1.00 (1.00–1.00) reference 1.00 (1.00–1.00) reference
Night/Evening 0.78 (0.53–1.13) 0.190 0.79 (0.52–1.18) 0.249
Shift work 1.43 (1.04–1.97) 0.028 1.47 (1.04–2.09) 0.031
Age, yr 1.00 (1.00–1.01) 0.158 1.01 (1.00–1.02) 0.024
Sex (ref. men) 0.96 (0.81–1.14) 0.651 0.98 (0.78–1.23) 0.888
BMI, kg/m2 1.60 (1.51–1.69) <0.001 1.60 (1.51–1.70) <0.001
Current smoker 0.80 (0.65–0.97) 0.026 0.88 (0.70–1.12) 0.311
Alcohol drinker 0.88 (0.72–1.08) 0.225
Physical activity 0.73 (0.62–0.87) <0.001 0.79 (0.66–0.95) 0.011
Educational attainment 1.09 (1.01–1.18) 0.020 1.12 (0.99–1.27) 0.075
Household income 1.05 (0.96–1.14) 0.272
Type of work
Manual worker 1.00 (1.00–1.00) reference 1.00 (1.00–1.00) reference
Office worker 1.50 (1.24–1.81) <0.001 1.62 (1.23–2.12) 0.001
Service worker 1.24 (0.98–1.55) 0.068 1.12 (0.86–1.46) 0.388
Working hour, hr/wk 1.00 (0.99–1.01) 0.859 1.00 (0.99–1.01) 0.990
Hypertension 1.60 (1.30–1.96) <0.001 1.31 (1.03–1.68) 0.028
Diabetes mellitus 1.29 (0.92–1.81) 0.134
Energy intake, 10 g/day 0.98 (0.97–0.99) 0.001 0.98 (0.96–0.99) <0.001
25(OH)D, ng/mL 0.96 (0.95–0.98) <0.001 0.96 (0.95–0.98) <0.001
ln(HOMA-IR) 2.75 (2.23–3.40) <0.001 1.54 (1.21–1.95) <0.001

Adjusted for age, sex, BMI, current smoking, physical activity, educational attainment, type of work, working hours, hypertension, energy intake, 25(OH)D level, and ln(HOMA-IR).

CI, confidence interval; BMI, body mass index; 25(OH)D, 25-hydroxy vitamin D; ln(HOMA-IR), log-transformed homeostasis model assessment-insulin resistance.

Table 3.
Odds Ratios of Having Normal-Weight Obesity in Study Participants
Daytime (reference) Night/Evening OR (95% CI) P value Daytime (reference) Shift work OR (95% CI) P value Night/Evening (reference) Shift work OR (95% CI) P value
Model 1 1 0.78 (0.53–1.13) 0.190 1 1.43 (1.04–1.97) 0.028 1 1.84 (1.14–2.98) 0.012
Model 2 1 0.79 (0.54–1.15) 0.223 1 1.45 (1.05–2.00) 0.023 1 1.83 (1.13–2.96) 0.014
Model 3 1 0.78 (0.52–1.15) 0.207 1 1.43 (1.02–2.01) 0.038 1 1.84 (1.12–3.05) 0.017
Model 4 1 0.81 (0.54–1.22) 0.321 1 1.57 (1.11–2.22) 0.010 1 1.93 (1.16–3.23) 0.012
Model 5 1 0.79 (0.52–1.18) 0.249 1 1.47 (1.04–2.09) 0.031 1 1.87 (1.11–3.14) 0.018

Model 1: Crude model without any adjustment; Model 2: Model 1+age, sex; Model 3: Model 2+body mass index; Model 4: Model 3+type of work, working hours, current smoking, physical activity, and educational attainment; Model 5: Model 4+hypertension, energy intake, 25-hydroxy-vitamin D, and log-transformed homeostasis model assessment-insulin resistance.

OR, odds ratio; CI, confidence interval.

TOOLS
Similar articles