Journal List > Healthc Inform Res > v.28(3) > 1516079517

Kung, Chiang, Perera, Pritchard, and Stewart: Unsupervised Machine Learning to Identify Depressive Subtypes

Abstract

Objectives

This study evaluated an unsupervised machine learning method, latent Dirichlet allocation (LDA), as a method for identifying subtypes of depression within symptom data.

Methods

Data from 18,314 depressed patients were used to create LDA models. The outcomes included future emergency presentations, crisis events, and behavioral problems. One model was chosen for further analysis based upon its potential as a clinically meaningful construct. The associations between patient groups created with the final LDA model and outcomes were tested. These steps were repeated with a commonly-used latent variable model to provide additional context to the LDA results.

Results

Five subtypes were identified using the final LDA model. Prior to the outcome analysis, the subtypes were labeled based upon the symptom distributions they produced: psychotic, severe, mild, agitated, and anergic-apathetic. The patient groups largely aligned with the outcome data. For example, the psychotic and severe subgroups were more likely to have emergency presentations (odds ratio [OR] = 1.29; 95% confidence interval [CI], 1.17–1.43 and OR = 1.16; 95% CI, 1.05–1.29, respectively), whereas these outcomes were less likely in the mild subgroup (OR = 0.86; 95% CI, 0.78–0.94). We found that the LDA subtypes were characterized by clusters of unique symptoms. This contrasted with the latent variable model subtypes, which were largely stratified by severity.

Conclusions

This study suggests that LDA can surface clinically meaningful, qualitative subtypes. Future work could be incorporated into studies concerning the biological bases of depression, thereby contributing to the development of new psychiatric therapeutics.

I. Introduction

Depression affects millions of people [1], worsens overall health outcomes, and is a leading cause of disability worldwide [2]. It is a significant public health concern for which extant interventions are limited in efficacy [3,4]. To improve treatments, recent research has focused on the development of biomarkers to better understand the nature of psychiatric disorders [5]. However, the highly heterogeneous nature of depression has proven to be a consistent barrier for this research [6,7]. To address this issue, one common approach involves empirically analyzing large sets of data to identify clinically actionable depressive subtypes.
To this end, researchers regularly employ latent variable models to refine depression diagnoses and create homogenous subtypes [810], which are beneficial because they can function as clear endpoints for biomarker identification. Ideally, biomarkers are associated with several endpoints such as severity, treatment response, or endophenotypes, implying a need for subtypes defined across multiple behavioral metrics [1113]. Here, we explore an unsupervised machine learning method for this task. Latent Dirichlet allocation (LDA) is a popular method for identifying abstract topics within text corpora [14]. In this application, we instead view abstract topics as depressive subtypes and symptoms as text. LDA is a generative probabilistic model; under an LDA model, we determine whether or not a patient has a symptom by:
  1. Generating a mixture of subtypes to represent the patient;

  2. Creating a distribution of symptoms for each subtype;

  3. Choosing a subtype based upon the mixture of subtypes; and

  4. Choosing a symptom based upon the subtype’s distribution.

To generate additional symptoms, we repeat steps 3 and 4. This process is a less natural model for describing symptom data than a more typical latent variable model, but it is more flexible.
The objective of this study was to evaluate LDA as a method of identifying depressive subtypes. LDA models were created with symptom data from a cohort of depressed patients and analyzed to identify potential subtypes. Patient groups were constructed based upon the subtypes and assessed with respect to outcome data. These steps were repeated with latent class analysis (LCA), a widely used latent variable model, to provide a point of comparison [1517].

II. Methods

1. Study Setting and Population

This study used de-identified Electronic Health Record (EHR) data of 18,314 patients treated at the South London and Maudsley NHS Foundation Trust (SLaM) between January 1, 2007 and November 1, 2018 [18,19]. The study inclusion criteria consisted of a primary diagnosis of depression (i.e., International Classification of Diseases, 10th revision codes of F33 or F32), within the first 3 months of their initial encounter with SLaM. The use of SLaM EHR data for secondary analyses has received IRB approval (Oxford Research Ethics Committee C reference 18/SC/0372).

2. Measures and Outcomes

Fifty psychiatric symptoms were used as binary variables to create models. Symptoms were extracted from unstructured EHRs with TextHunter, a natural language processing system. TextHunter requires users to define a list of regular expressions to identify texts with a particular keyword. After users annotate texts, it trains a support vector machine model to classify the presence of a symptom in a patient, with features generated by rule-based algorithms. Models can be further refined with an active learning module within Text-Hunter. Detailed descriptions, including performance metrics, of each model are available in open-access catalogues [20]. The symptoms are listed in Supplementary Table S1.
All texts in the unstructured EHRs were used as a part of the symptom extraction process. However, the most informative texts (i.e., texts that mention symptoms), fall under two categories: clinical correspondences and case notes. Case notes refer to texts recorded after a clinical encounter. Clinical correspondences can be written by a professional, but they are usually a communication from a specialist to generalist medical staff. No profession-specific filters were applied to the unstructured EHRs during symptom extraction.
The validities of the subtypes were evaluated with respect to several outcomes, available as structured data in EHRs: the occurrence of a mental health crisis within 3 to 15 months after a patient’s initial encounter with SLaM, the occurrence of an emergency room presentation within the same time window, and Health of the Nation Outcome Scales (HoNOS) problems [21]. HoNOS is a structured instrument used routinely as a part of British Mental Health Services. Each scale rates an element related to functional impairment or mental health from 0 (not present) to 4 (severe problem). Patients were considered to have a HoNOS problem on a given scale if they scored between 2 (mild problem) and 4.
Covariates included gender, race (classified into White, Black, Asian, mixed, or other), year of first SLaM contact, and neighborhood deprivation. These data are included in Tables 1 and 2.

3. Analyses

The LDA and LCA models were developed in a similar fashion. The number of classes created by LDA and LCA is a fixed number chosen prior to model creation; the experimental models featured 2 to 8 different subtypes. Two goodness-of-fit metrics were tested to evaluate model quality: perplexity for LDA and the Akaike information criterion (AIC) for LCA. Both proved to be ineffective measures for the data; perplexity values did not favor any model, and AIC values preferred large LCA models that featured over 10 classes, many of which represented less than 5% of the total cohort. Supplementary Table S2 provides more information. At a high level, models were instead chosen based upon patterns found in the symptom distributions and the likelihoods that characterized each set of subtypes, described below.
LCA was implemented with poLCA, a library for R [22]. LDA and K-means clustering were implemented with scikit learn, a library for Python [23]. Clinical outcomes and characteristics were compared using the chi-square test. Regression analyses were also performed to compare crisis events and emergency presentations. Analyses were adjusted for age, gender, racial group, and neighborhood deprivation score.

1) LDA models

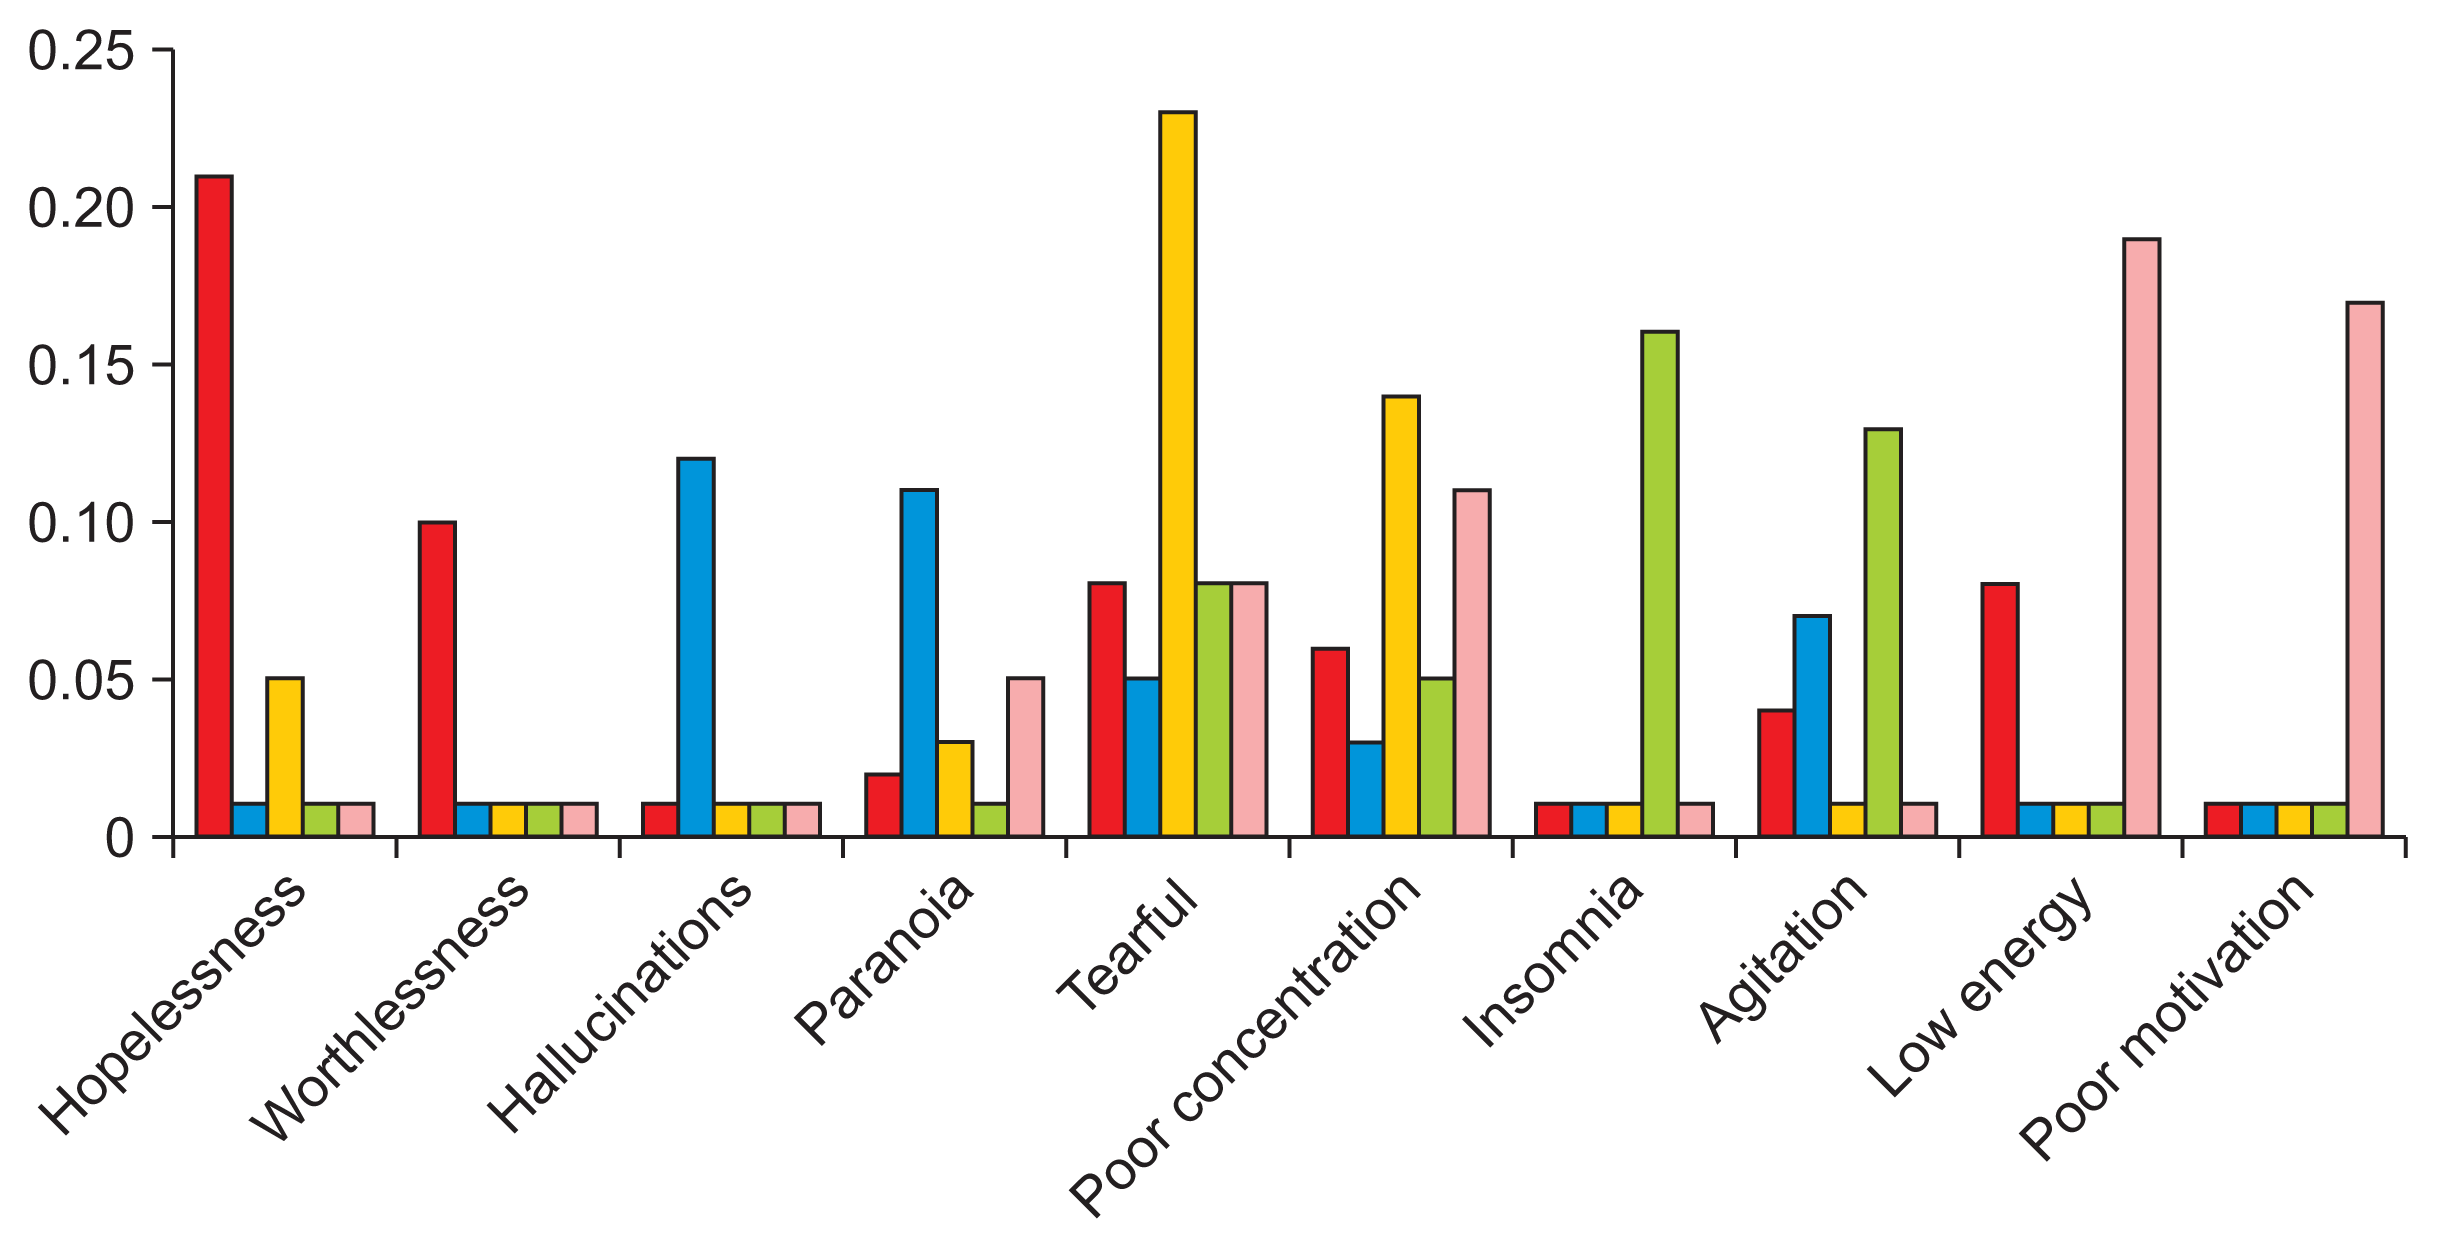
We evaluated LDA models by examining their symptom distributions, which are included in Supplementary Table S3; Figure 1 presents the partial symptom distributions for a 5-class LDA model; Supplementary Figure S1 presents the partial symptom distributions for a 4-class LDA model. Most models featured a class defined by tearfulness, poor concentration, and guilt. Given that these were the most common symptoms in the data, this subtype was viewed as a mild form of depression; the 2- and 3-class LDA models did not have this subtype and as a result, were considered to be insufficiently descriptive. However, each new model featured an additional subtype not present in previous models. Thus, the 6- to 8-class models were excluded since continually adding classes could lead to overfitting.
The 4- and 5-class models featured similar subtypes; however, the added class in the latter gave rise to a subtype characterized by agitation. In previous work, agitation has been considered an important specifier for depression. Thus, the 5-class LDA model was chosen as the final model to allow for the study of a potential agitated subtype.
LDA models decompose patient data into mixtures of subtypes. K-means clustering was used to create patient groups with the mixtures. The K-means method creates a predetermined number of clusters; the number of clusters was chosen to be the number of classes in the final LDA model, so that each cluster could be later described by one subtype. More information on creating patient groups can be found under “Converting patient subtypes into patient groups” in Supplement A.
The following labels were then assigned to the patient groups: “psychotic” to the subtype characterized by hallucination and paranoia; “severe” to the subtype characterized by hopelessness and suicidal ideation; and “mild” to the subtype characterized by tearfulness and poor concentration, two of the most common symptoms in the dataset. The last two were labeled “agitated” and “anergic-apathetic” due to the presence of those symptoms within each respective subtype. These labels were influenced by the average number of symptoms in each group; the psychotic and severe groups had a higher average number of symptoms (8.62 and 7.11, respectively) than the remaining groups (5.99, 5.70, and 4.50, respectively). Thus, they were viewed as comprising a severe set of subtypes, and the mild, agitated, and anergic-apathetic groups as a mild set.

2) Latent class analysis models

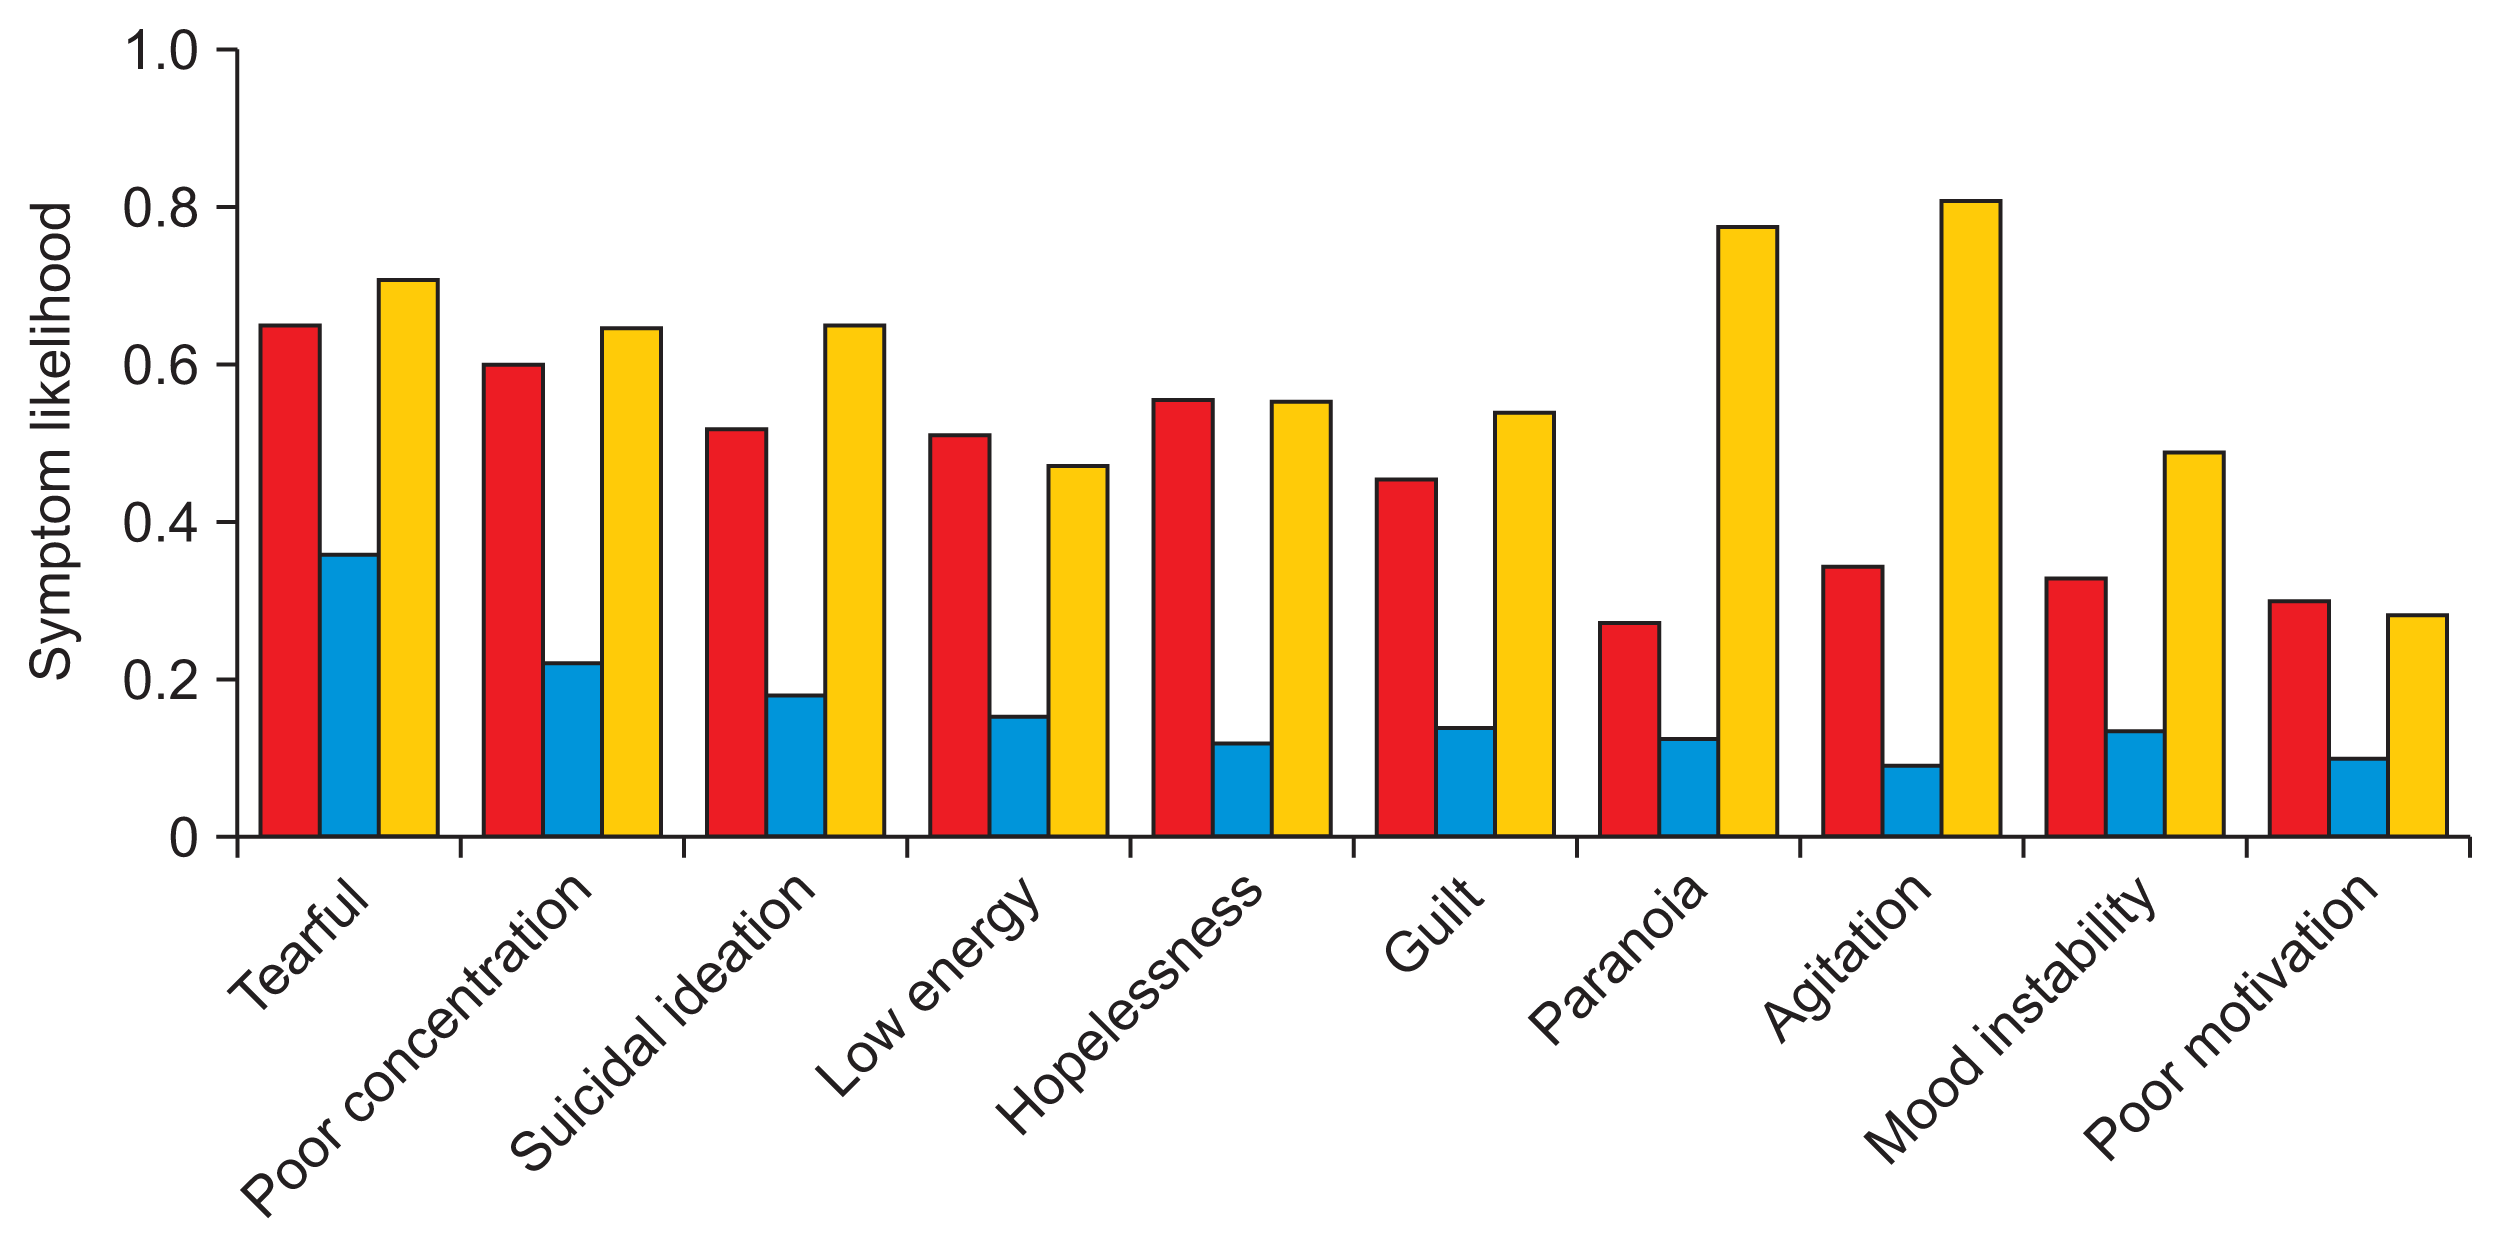
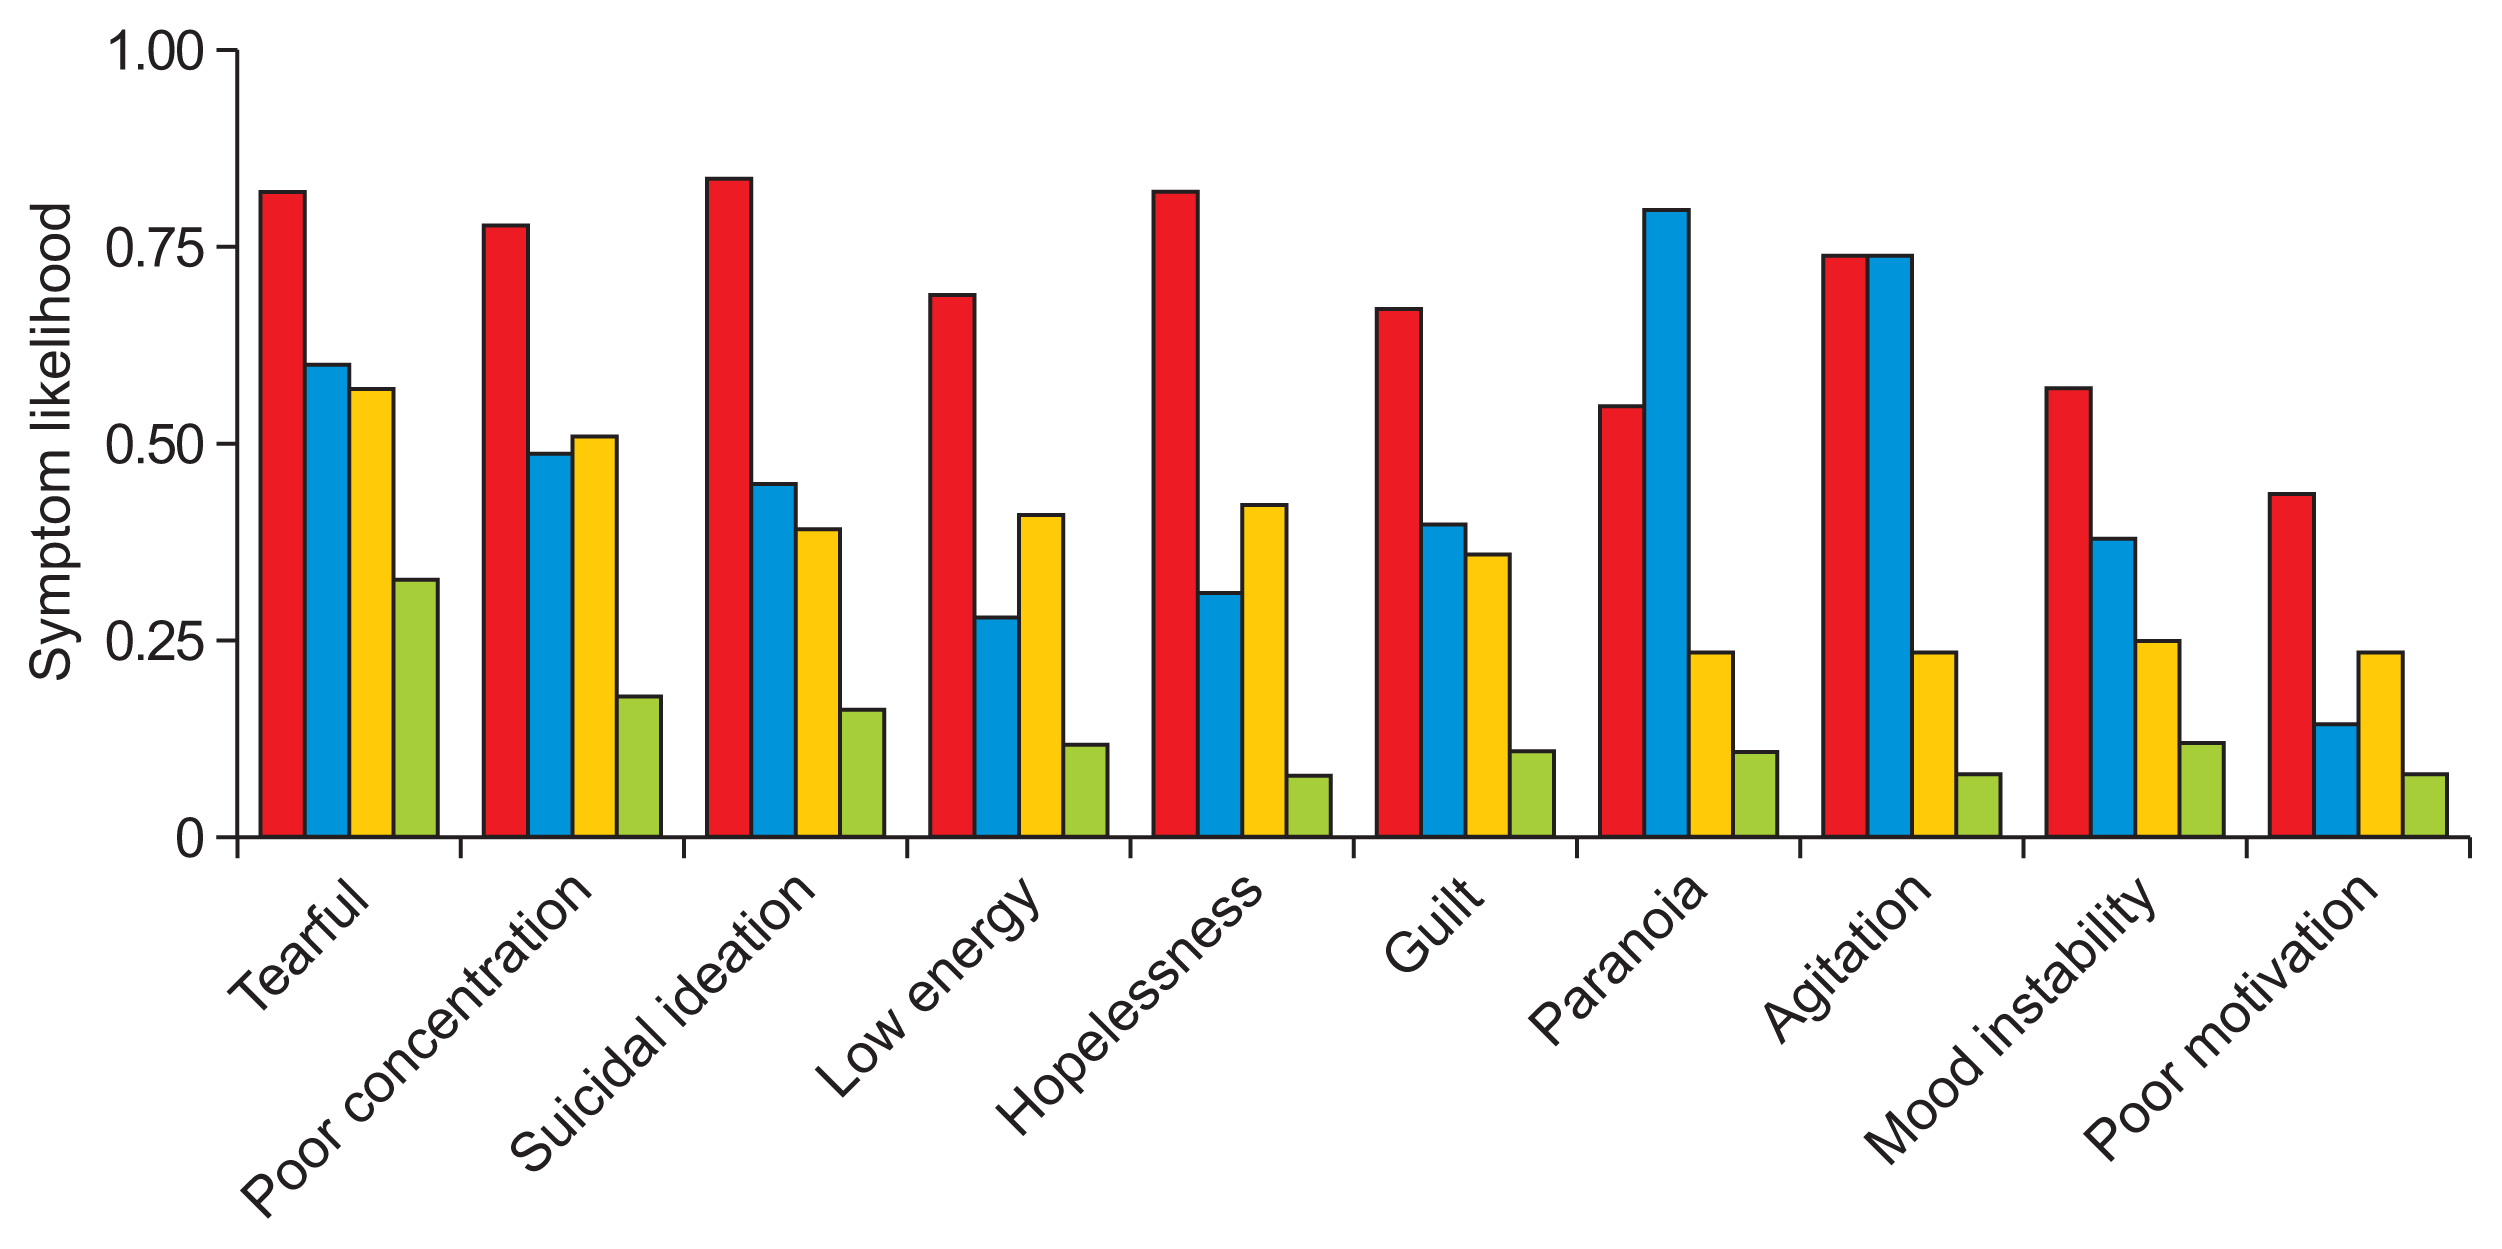
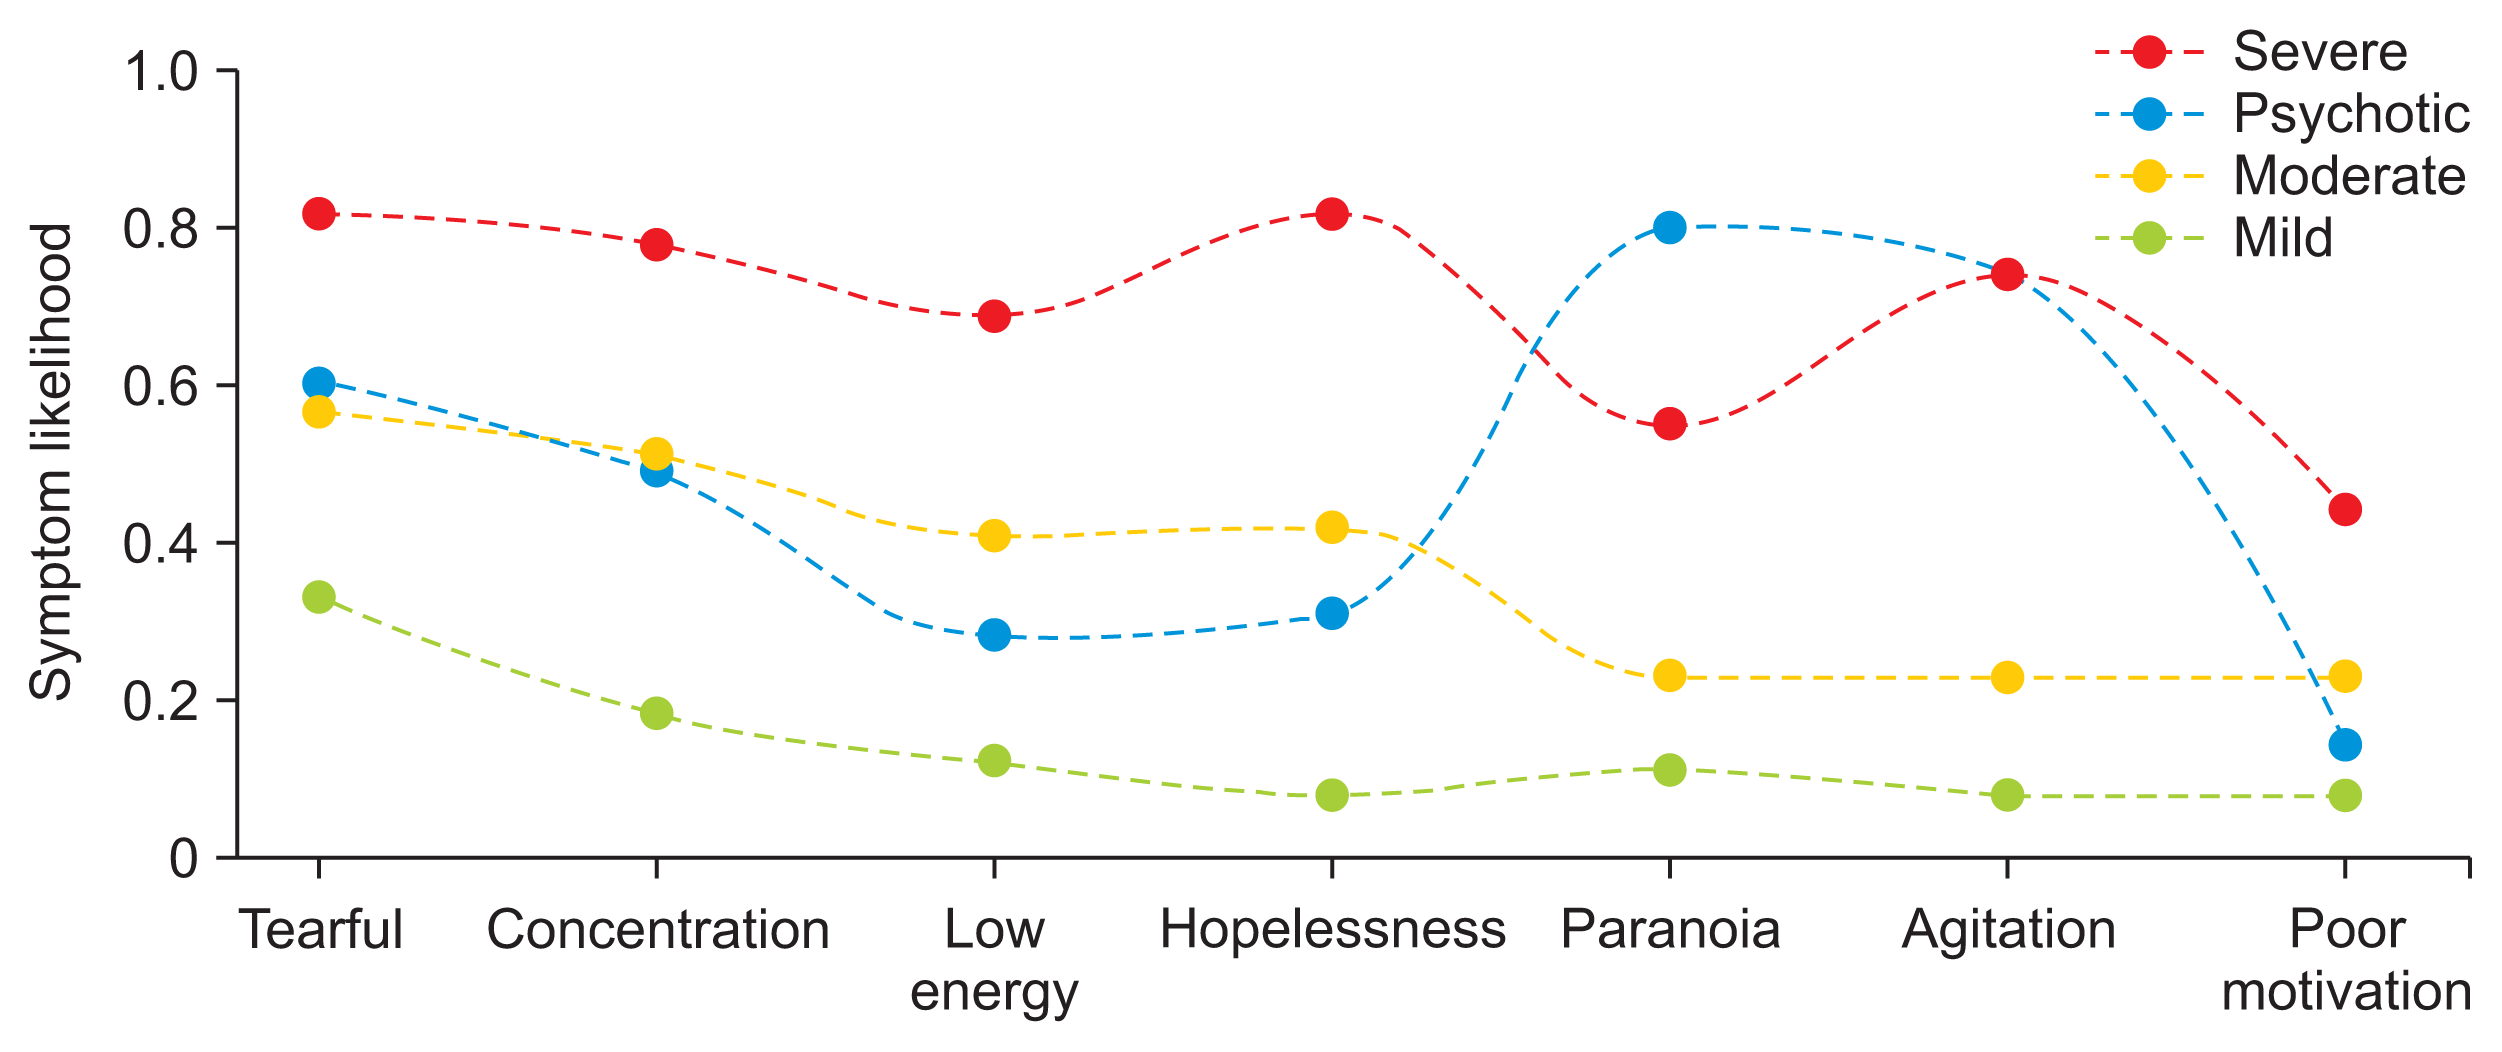
LCA models with more than 4 classes featured an increasing number of groups with 10% or less of the total population, suggesting overfitting. As a result, only the 3-, 4-, and 5-class models were chosen for further consideration. The symptom probabilities for the top 10 most common symptoms for each LCA model are featured in Figures 2, 3, and Supplementary Figure S2, respectively. Each model was stratified based upon a combination of severity and psychosis. For example, Figure 2 suggests that the 3-class model has a mild class with low symptom likelihoods and two severe classes with high symptom likelihoods; between the two severe classes, one is likely to have psychotic symptoms, like paranoia, and one is not.
The 4-class model was chosen as the final LCA model because it was able to capture both severity and psychosis in a parsimonious way. We labeled the subtypes as “psychotic,” “severe,” “moderate,” and “mild.” LCA models decompose patient data into class membership likelihoods. Patients were placed into groups based on the class they were more likely to be in, which is typical for many LCA implementations.

III. Results

1. Clinical Outcomes

Adjusted odds ratios (ORs) are presented in Table 3, unadjusted odds ratios are presented in Supplementary Table S4, and HoNOS data are presented in Tables 4 and 5. Both the LCA and LDA models aligned well with their outcomes. For example, the LDA and LCA psychotic groups were the most likely to have cognition problems, the LDA and LCA severe groups were the most likely to have self-injury problems, and the LDA mild set and the LCA mild group were less likely to have emergency presentations or crisis events.
However, the differences in outcomes between the LDA groups were more variable than LCA groups. With few exceptions, the outcomes for the LCA groups were organized by severity. For example, the LCA mild group was the least likely to have crisis events (OR = 0.27; 95% confidence interval [CI], 0.23–0.31; p < 0.001), the severe group was the most likely (OR = 5.26; 95% CI, 4.58–6.05; p = 0.01), and the moderate group was in between the two (OR = 0.84; 95% CI, 0.74–0.95; p < 0.001). However, the LDA severe group was not significantly more likely to have crisis events (OR = 1.14; 95% CI, 0.98–1.33; p = 0.08), though patients in that group were more likely to have emergency presentations (OR = 1.16; 95% CI, 1.16–1.29; p = 0.01), had a higher average number of symptoms, and were more likely to have self-injury problems.
The differences in outcomes tended to be smaller within the LDA groups than in the LCA groups. For example, although the LDA and LCA mild groups were the least likely to have problems with depressed mood, the range within the LDA groups was only 7.1% compared to 28.2% within the LCA groups (LDA, between 46.3% and 53.4%; LCA, between 43% and 71.2%). The LCA and LDA groups contained similar numbers of patients.

2. Model Comparisons

The two methods categorized mild and psychotic individuals in a similar way. Seventy-seven percent of individuals who were in the LDA mild set (the mild, agitated, and anergic-apathetic groups) were placed into the LCA mild group; 89% of individuals that were in the LCA psychotic group were placed into the LDA psychotic group. The LCA moderate patients were placed into the LDA groups, excluding the psychotic group, almost evenly: 29% were placed into the severe group, 21% in the mild group, 18% in the agitated group, and 24% in the anergic-apathetic group. However, the placement of LCA severe patients into the LDA groups was less intuitive. LCA severe patients were placed into both the LDA severe and agitated groups at relatively high proportions (29% and 33% of the time, respectively).
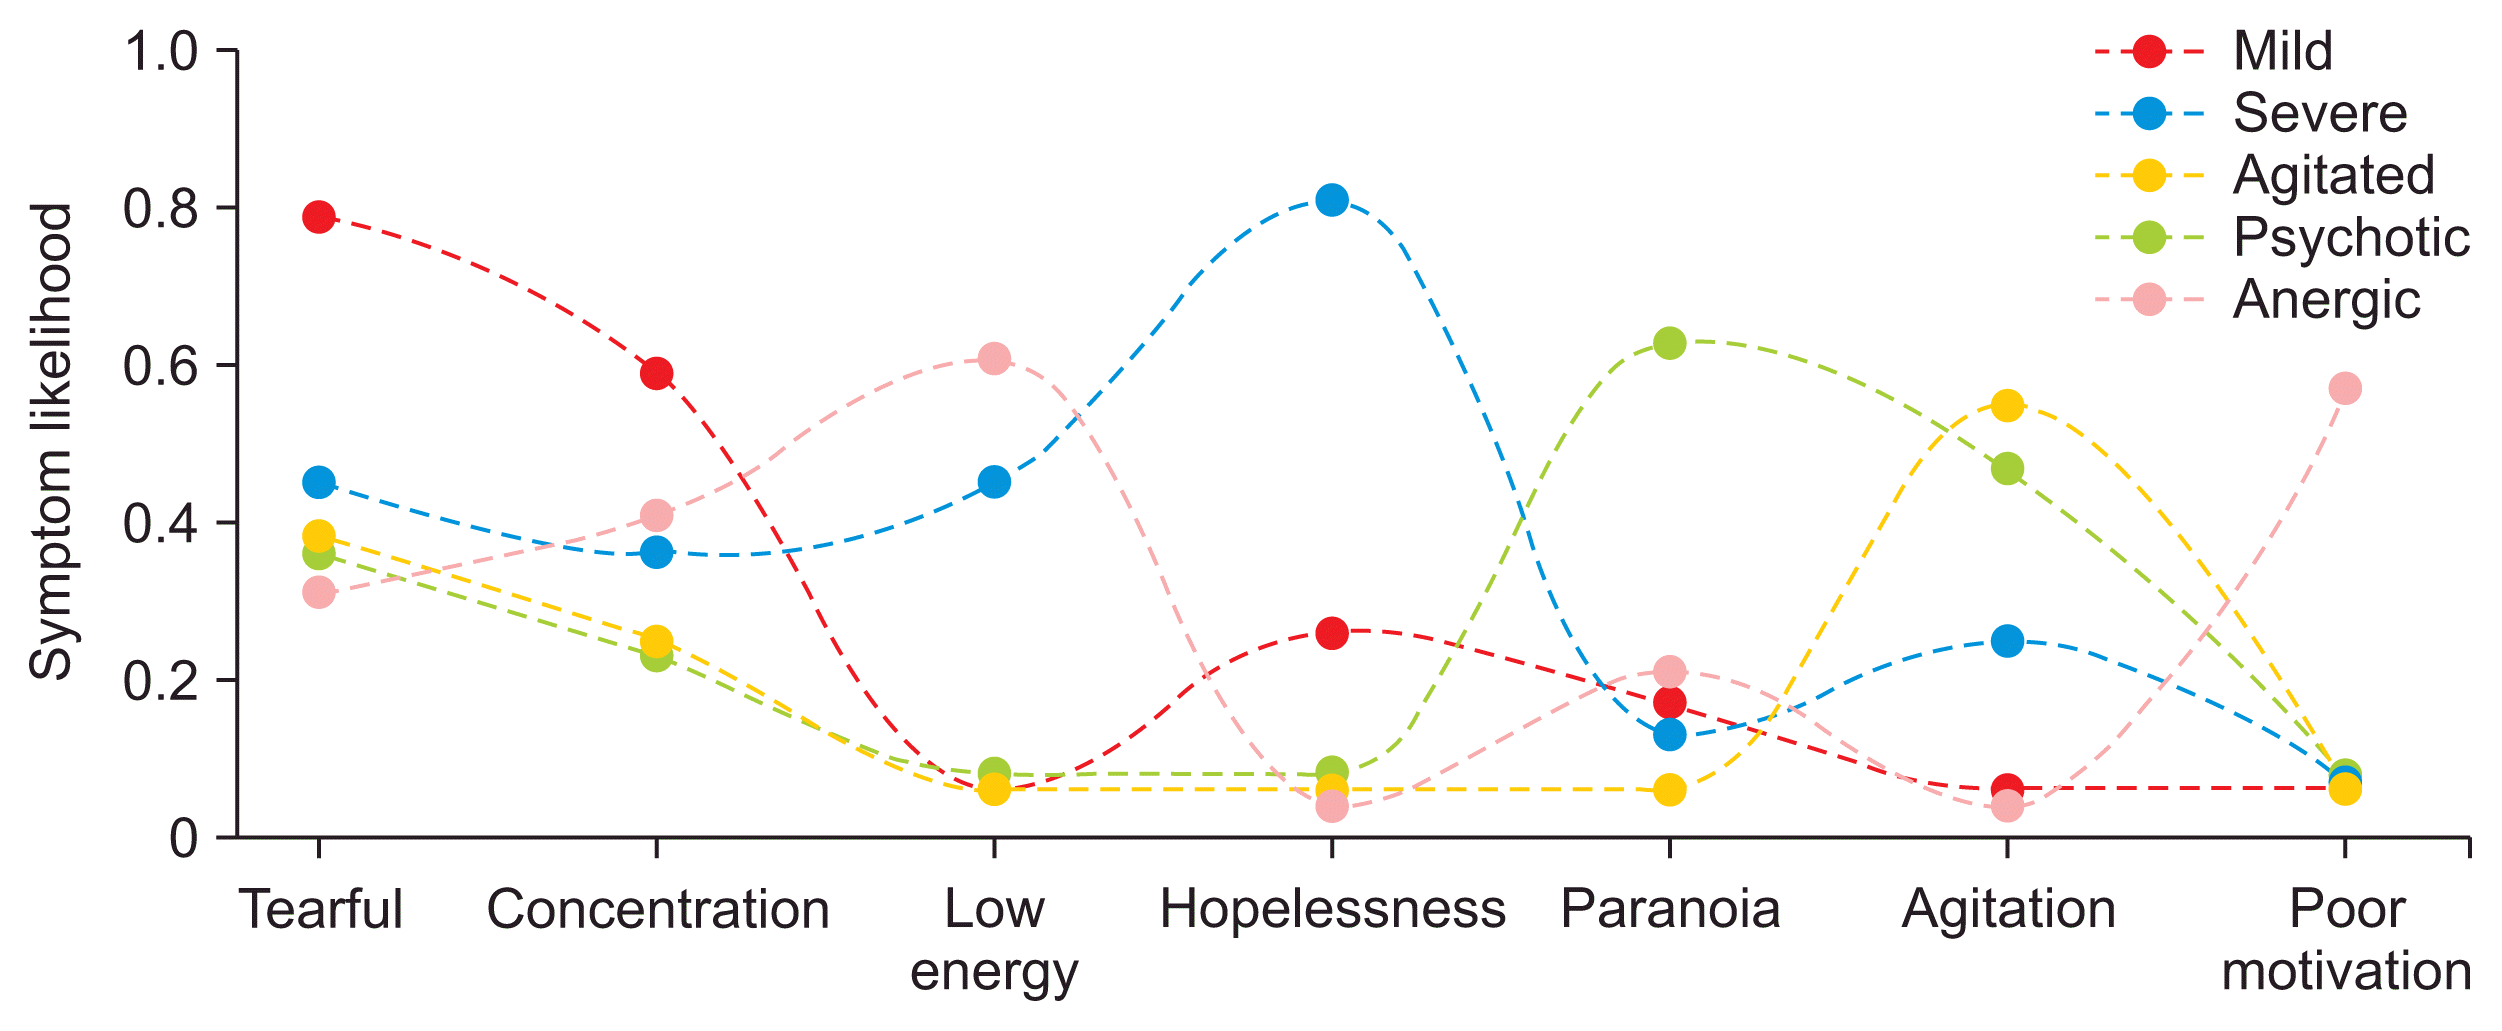
Because LDA produces a distribution of symptoms, it is not possible to make a direct comparison between the symptom likelihoods in the LCA and LDA subtypes. Instead, in Figures 4 and 5, we present LDA symptom likelihoods as the likelihood that a patient would have that symptom if we were to generate the average number of symptoms for the group the patient is in. More information can be found under “Generating symptom likelihoods from LDA models” in Supplement B.
The LDA subtypes could be differentiated by two or three key symptoms—that is, if a symptom was highly likely in one subtype, it was not likely to be present in other subtypes, with some exceptions. For example, as shown in Figure 4, the LDA psychotic and agitated subtypes were both likely to be described as agitated. This contrasts with the LCA subtypes, which largely followed the same pattern as the outcome data, with a clear stratification by the overall likelihoods of symptoms.

IV. Discussion

In this study, LDA and LCA were used to identify two sets of depressive subtypes based upon patients’ symptomatology. For each method, several models were evaluated. The final models created subtypes that were coherent with respect to various outcomes. However, they differed significantly in their relationships to the data. The LDA subtypes were characterized by qualitative descriptions, whereas the LCA subtypes were clearly stratified by severity; the prevalence of different outcomes was ordered precisely from mild to severe, with a few exceptions related to the psychotic subtype.
Empirically, stratification by severity has been a common trend in similar work employing LCA [8,9]. Outside of severity, classes are most clearly characterized by one or two key symptoms. For example, Lamers et al. [16] identified moderate, severe melancholic, and severe atypical sets by analyzing Diagnostic and Statistical Manual of Mental Disorders (DSM) criteria data. The latter two groups were primarily differentiated by weight and appetite changes. There were other statistically significant differences, but they did not distinguish patients to the same extent; instead, issues would be similarly probable, such as less sleep (0.515 vs. 0.388) or fatigue (0.964 vs. 1.000). One potential explanation for this would be the limited set of symptoms considered in the DSM criteria and depressive measures broadly. However, these issues persisted in this study among all LCA models despite the inclusion of a wider range of symptoms.
LDA departed from stratification by severity; the classes were naturally characterized by 2 or 3 unique symptoms according to the model. The differences in outcomes were less clear than those in the LDA model, but this may have been, in part, due to the even numbers of patients across groups. For example, patients in the LCA moderate subtype were spread across the LDA subtypes, potentially making group outcomes more difficult to distinguish. However, for every class, the LDA model was able to prioritize clusters of symptoms—that is, the most important symptoms in each subtype were significantly overrepresented in the corresponding patient group. This is a departure from the results of LCA models. Only a few symptoms, mostly associated with psychosis, were unrelated to severity in the LCA model, whereas there was little overlap in the most important symptoms in the LDA classes. Supplementary Table S3 presents more information on the LDA classes.
The observation that the LDA models characterized patients by qualitative characteristics and the LCA models classified patients by severity is in line with the assumptions made by each method. For example, the fact that the final LDA model produced qualitative descriptions is unsurprising, given that it is a topic model. In latent variable models, symptoms should be independent within classes. Yet, with current depression criteria, if a class is extremely likely to have two or three symptoms, then from a clinical perspective, it is to be expected that other symptoms are present [24,25]. Here, the LCA model likely reconciled these conditions by assigning high likelihoods for every symptom [26]. There is a need to develop new methods for deriving data-driven depressive subtypes; the findings of the present study suggest that to do so, shifting assumptions could be effective.
There are several limitations to this study. First, the data source was a secondary mental health services provider, which may include more varied cases of depression. For example, patients (and symptoms) in the most severe subtypes, such as psychotic patients, may not be present at the primary care level, where depression is often first treated. In the most extreme example, a general practitioner might not record a single symptom related to mental health. Another consideration is whether mental health treatment is a priority for the patient or the provider. Although mood and anxiety disorders are commonly comorbid with other chronic conditions, mental health may not be discussed because the patient would prefer to focus on a separate treatment, such as a chemotherapy session. Thus, the analysis performed here would certainly yield different results in other outpatient or inpatient settings.
Second, the variables used in this study are not directly comparable to prior works. Psychiatry researchers prefer to use validated, structured depression measurement tools [27], which collect data on specific symptoms and their severity tied to a specific timeframe (commonly 2 weeks). In comparison, our symptom data was based upon whether a clinician recorded a symptom; there were no guarantees about severity, timeframe, or symptom choice. Information on common symptoms, such as low mood, lack of interest, anergia, may not even have been available because a clinician chose not to write about it. Nonetheless, the trade-off allows for the discovery of new, novel subtypes because additional data, such as bereavement or mental health history, can always be incorporated if resources are dedicated to their extraction, whereas measurement tools are commonly limited to 20 or fewer symptoms.
The factors that contribute to replicability issues constitute another key limitation. These include the lack of analysis of a separate data set and the variability of latent variable studies. For example, the demographics of a population are important because patients’ ethnicity is known to affect their diagnosis, introducing bias to any data-driven analysis [28]. Furthermore, for latent variable studies, the number of latent variables is subject to the analyst’s discretion. While theoretically motivated guidelines exist, there are always cases where n and n+1 classes are valid options [15].
This study explored LDA as a method of identifying subtypes of depression within a large set of symptom data. Our results suggest that LDA is a promising method, particularly because it surfaces subtypes associated with multiple outcomes that can be distinguished by a unique set of observable symptoms. In other words, patients were characterized by clear descriptive criteria that correspond to actionable clinical insights. This contrasts with previous studies, which have typically produced subtypes characterized by severity; that is, the subtypes tended to center the prevalence of symptoms in general as opposed to observable syndromes. To confirm that our results were not just a function of our data, we tested a commonly-used method as a point of comparison and found that it also produced subtypes stratified by severity. Several broad classes of future work might help refine depressive subtypes such as exploring broader measures, like functional assessments, or extensions of LDA, such as applications to raw text data. By identifying more homogeneous groups of patients with depression, these findings could support the creation of clinical decision support tools or downstream depression research for biomarker development.

Acknowledgments

We thank Dr. Ronald Albucher and Dr. Suzanne Tamang for their feedback throughout the preparation of this manuscript.

Notes

Conflict of Interest

No potential conflict of interest relevant to this article was reported.

References

1. World Health Organization. Depression and other common mental disorders: global health estimates. Geneva, Switzerland: World Health Organization;2017.
2. GBD 2017 Disease and Injury Incidence and Prevalence Collaborators. Global, regional, and national incidence, prevalence, and years lived with disability for 354 diseases and injuries for 195 countries and territories, 1990–2017: a systematic analysis for the global burden of disease study 2017. Lancet. 2018; 392(10159):1789–858. https://doi.org/10.1016/s0140-6736(18)32279-7.
3. Warden D, Rush AJ, Trivedi MH, Fava M, Wisniewski SR. The STAR*D Project results: a comprehensive review of findings. Curr Psychiatry Rep. 2007; 9(6):449–59. https://doi.org/10.1007/s11920-007-0061-3.
crossref
4. Kern DM, Cepeda MS, Defalco F, Etropolski M. Treatment patterns and sequences of pharmacotherapy for patients diagnosed with depression in the United States: 2014 through 2019. BMC Psychiatry. 2020; 20(1):4. https://doi.org/10.1186/s12888-019-2418-7.
crossref
5. Insel T, Cuthbert B, Garvey M, Heinssen R, Pine DS, Quinn K, et al. Research domain criteria (RDoC): toward a new classification framework for research on mental disorders. Am J Psychiatry. 2010; 167(7):748–51. https://doi.org/10.1176/appi.ajp.2010.09091379.
crossref
6. Hasler G, Drevets WC, Manji HK, Charney DS. Discovering endophenotypes for major depression. Neuropsychopharmacology. 2004; 29(10):1765–81. https://doi.org/10.1038/sj.npp.1300506.
crossref
7. Rush AJ. The varied clinical presentations of major depressive disorder. J Clin Psychiatry. 2007; 68(Suppl 8):4–10.
8. van Loo HM, de Jonge P, Romeijn JW, Kessler RC, Schoevers RA. Data-driven subtypes of major depressive disorder: a systematic review. BMC Med. 2012; 10:156. https://doi.org/10.1186/1741-7015-10-156.
crossref
9. Ulbricht CM, Chrysanthopoulou SA, Levin L, Lapane KL. The use of latent class analysis for identifying subtypes of depression: a systematic review. Psychiatry Res. 2018; 266:228–46. https://doi.org/10.1016/j.psychres.2018.03.003.
crossref
10. Marquand AF, Wolfers T, Mennes M, Buitelaar J, Beckmann CF. Beyond lumping and splitting: a review of computational approaches for stratifying psychiatric disorders. Biol Psychiatry Cogn Neurosci Neuroimaging. 2016; 1(5):433–47. https://doi.org/10.1016/j.bpsc.2016.04.002.
crossref
11. Fernandes BS, Williams LM, Steiner J, Leboyer M, Carvalho AF, Berk M. The new field of 'precision psychiatry'. BMC Med. 2017; 15(1):80. https://doi.org/10.1186/s12916-017-0849-x.
crossref
12. Horwitz T, Lam K, Chen Y, Xia Y, Liu C. A decade in psychiatric GWAS research. Mol Psychiatry. 2019; 24(3):378–89. https://doi.org/10.1038/s41380-018-0055-z.
crossref
13. Fried EI, Nesse RM. Depression is not a consistent syndrome: An investigation of unique symptom patterns in the STAR*D study. J Affect Disord. 2015; 172:96–102. https://doi.org/10.1016/j.jad.2014.10.010.
crossref
14. Blei DM, Ng AY, Jordan MI. Latent Dirichlet allocation. J Mach Learn Res. 2003; 3:993–1022.
15. Mori M, Krumholz HM, Allore HG. Using latent class analysis to identify hidden clinical phenotypes. JAMA. 2020; 324(7):700–1. https://doi.org/10.1001/jama.2020.2278.
crossref
16. Lamers F, de Jonge P, Nolen WA, Smit JH, Zitman FG, Beekman AT, et al. Identifying depressive subtypes in a large cohort study: results from the Netherlands Study of Depression and Anxiety (NESDA). J Clin Psychiatry. 2010; 71(12):1582–9. https://doi.org/10.4088/jcp.09m05398blu.
crossref
17. Sullivan PF, Kessler RC, Kendler KS. Latent class analysis of lifetime depressive symptoms in the national comorbidity survey. Am J Psychiatry. 1998; 155(10):1398–406. https://doi.org/10.1176/ajp.155.10.1398.
crossref
18. Perera G, Broadbent M, Callard F, Chang CK, Downs J, Dutta R, et al. Cohort profile of the South London and Maudsley NHS foundation trust Biomedical Research Centre (SLaM BRC) case register: current status and recent enhancement of an Electronic Mental Health Record-derived data resource. BMJ Open. 2016; 6(3):e008721. https://doi.org/10.1136/bmjopen-2015-008721.
crossref
19. Fernandes AC, Cloete D, Broadbent MT, Hayes RD, Chang CK, Jackson RG, et al. Development and evaluation of a de-identification procedure for a case register sourced from mental health electronic records. BMC Med Inform Decis Mak. 2013; 13:71. https://doi.org/10.1186/1472-6947-13-71.
crossref
20. CRIS NLP Service. Library of production-ready applications [Internet]. London, UK: NIHR Maudsley Biomedical Research Centre;2020. [cited at 2022 Jul 25]. Available from: https://maudsleybrc.nihr.ac.uk/media/313772/applications-library-v12.pdf.
21. Delaffon V, Anwar Z, Noushad F, Ahmed AS, Brugha TS. Use of Health of the Nation Outcome Scales in psychiatry. Adv Psychiatr Treat. 2012; 18(3):173–9. https://doi.org/10.1192/apt.bp.110.008029.
crossref
22. Linzer DA, Lewis JB. poLCA: an R package for polytomous variable latent class analysis. J Stat Softw. 2011; 42(10):1–29. https://doi.org/10.18637/jss.v042.i10.
crossref
23. Pedregosa F, Varoquaux G, Gramfort A, Michel V, Thirion B, Grisel O, et al. Scikit-learn: machine learning in Python. J Mach Learn Res. 2011; 12:2825–2830.
24. Tolentino JC, Schmidt SL. DSM-5 criteria and depression severity: implications for clinical practice. Front Psychiatry. 2018; 9:450. https://doi.org/10.3389/fpsyt.2018.00450.
crossref
25. Lowe B, Spitzer RL, Grafe K, Kroenke K, Quenter A, Zipfel S, et al. Comparative validity of three screening questionnaires for DSM-IV depressive disorders and physicians' diagnoses. J Affect Disord. 2004; 78(2):131–40. https://doi.org/10.1016/s0165-0327(02)00237-9.
crossref
26. van Loo HM, Wanders RB, Wardenaar KJ, Fried EI. Problems with latent class analysis to detect data-driven subtypes of depression. Mol Psychiatry. 2018; 23(3):495–6. https://doi.org/10.1038/mp.2016.202.
crossref
27. Kroenke K, Spitzer RL, Williams JB. The PHQ-9: validity of a brief depression severity measure. J Gen Intern Med. 2001; 16(9):606–13. https://doi.org/10.1046/j.1525-1497.2001.016009606.x.
crossref
28. Liu CH, Stevens C, Wong SH, Yasui M, Chen JA. The prevalence and predictors of mental health diagnoses and suicide among U.S. college students: implications for addressing disparities in service use. Depress Anxiety. 2019; 36(1):8–17. https://doi.org/10.1002/da.22830.
crossref

Figure 1
Five-topic latent Dirichlet allocation (LDA) symptom distribution. Column colors represent individual subtypes. Symptoms were included here if they were one of the two most common symptoms for a subtype. The red column corresponds to the “Severe” group, blue to “Psychotic”, yellow to “Mild,” green to “Agitated,” and pink to “Anergic-apathetic.”
hir-2022-28-3-256f1.gif
Figure 2
Three-class latent class analysis (LCA) symptom likelihoods. Column colors represent individual subtypes. The top 10 most common symptoms in the dataset were included here. The red and yellow columns can be viewed as severe subtypes, where the latter is distinguished by psychotic features. The blue, overall, forms a mild subtype.
hir-2022-28-3-256f2.gif
Figure 3
Four-class LCA symptom likelihoods. Column colors represent individual subtypes. The top 10 most common symptoms in the dataset were included here. The red column corresponds to the “Severe” group, blue to “Psychotic,” yellow to “Moderate,” and green to “Mild.”
hir-2022-28-3-256f3.gif
Figure 4
Symptom likelihoods for the latent Dirichlet allocation (LDA) patient groups. Symptoms were included here if they were one of the top 10 most common symptoms, and were one of the top two symptoms in an LDA subtype.
hir-2022-28-3-256f4.gif
Figure 5
Symptom likelihoods for the latent class analysis (LCA) patient groups. Symptoms were included here if they were one of the top ten most common symptoms, and were one of the top two symptoms in an latent Dirichlet allocation (LDA) subtype.
hir-2022-28-3-256f5.gif
Table 1
Demographic information of the latent Dirichlet analysis groups
Full sample Mild groups Psychotic Severe Mild Agitated Anergic-apathetic
Total sample 18,314 12,115 3,059 3,140 4,844 4,291 2,980

Sex
 Female 11,377 (62.1) 7,825 (64.6) 1,703 (55.7) 1,849 (58.9) 3,441 (71.0) 2,500 (58.3) 1,884 (63.2)
 Male 6,926 (37.8) 4,283 (35.4) 1,353 (44.2) 1,290 (41.1) 1,401 (28.9) 1,789 (41.7) 1,093 (36.7)

Race
 Asian 915 (5.0) 573 (4.7) 191 (6.2) 151 (4.8) 227 (4.7) 218 (5.1) 128 (4.3)
 Black 2,728 (14.9) 1,709 (14.1) 571 (18.7) 448 (14.3) 670 (13.8) 603 (14.1) 436 (14.6)
 Mixed 400 (2.2) 274 (2.3) 64 (2.1) 62 (2.0) 111 (2.3) 95 (2.2) 68 (2.3)
 Other 1,833 (10) 1,236 (10.2) 292 (9.5) 305 (9.7) 506 (10.4) 449 (10.5) 281 (9.4)
 White 10,458 (57.1) 6,956 (57.4) 1,653 (54.0) 1,849 (58.9) 2,787 (57.5) 2,449 (57.1) 1,720 (57.7)
 Ethnicity missing 1,980 (10.8) 1,367 (11.3) 288 (9.4) 325 (10.4) 543 (11.2) 477 (11.1) 347 (11.6)

Age (yr)
 <18 2,352 (12.8) 1,750 (14.4) 257 (8.4) 345 (11.0) 772 (15.9) 664 (15.5) 314 (10.5)
 18–34 5,951 (32.5) 3,954 (32.6) 965 (31.5) 1,032 (32.9) 1,580 (32.6) 1,289 (30.0) 1,085 (36.4)
 35–49 4,513 (24.6) 2,923 (24.1) 757 (24.7) 833 (26.5) 1,175 (24.3) 1,033 (24.1) 715 (24)
 50–64 2,561 (14) 1,576 (13) 505 (16.5) 480 (15.3) 620 (12.8) 590 (13.7) 366 (12.3)
 ≥65 2,934 (16) 1,910 (15.8) 575 (18.8) 449 (14.3) 696 (14.4) 714 (16.6) 500 (16.8)

Deprivation score 25.1 ± 10.2 25.1 ± 10.3 25.4 ± 10.1 24.8 ± 10.2 25.0 ± 10.0 25.2 ± 10.4 25.2 ± 10.2

Values are presented as number (%) or mean ± standard deviation.

Table 2
Demographic information of the latent class analysis groups
Full sample (n = 18,314) Psychotic (n = 987) Severe (n = 1,596) Moderate (n = 6,063) Mild (n = 9,668)
Sex
 Female 11,377 (62.1) 544 (55.1) 896 (56.1) 3,729 (61.5) 6,208 (64.2)
 Male 6,926 (37.8) 443 (44.9) 700 (43.9) 2,332 (38.5) 3,451 (35.7)

Race
 Asian 915 (5) 83 (8.4) 92 (5.8) 298 (4.9) 442 (4.6)
 Black 2,728 (14.9) 244 (24.7) 241 (15.1) 867 (14.3) 1,376 (14.2)
 Mixed 400 (2.2) 12 (1.2) 35 (2.2) 119 (2) 234 (2.4)
 Other 1,833 (10) 76 (7.7) 137 (8.6) 589 (9.7) 1,031 (10.7)
 White 10,458 (57.1) 496 (50.3) 987 (61.8) 3,605 (59.5) 5,370 (55.5)
 Ethnicity missing 1,980 (10.8) 76 (7.7) 104 (6.5) 585 (9.6) 1,215 (12.6)

Age (yr)
 <18 2,352 (12.8) 58 (5.9) 225 (14.1) 751 (12.4) 1,318 (13.6)
 18–34 5,951 (32.5) 316 (32) 542 (34) 2,044 (33.7) 3,049 (31.5)
 35–49 4,513 (24.6) 252 (25.5) 401 (25.1) 1,505 (24.8) 2,355 (24.4)
 50–64 2,561 (14) 191 (19.4) 249 (15.6) 796 (13.1) 1,325 (13.7)
 ≥65 2,934 (16) 170 (17.2) 179 (11.2) 966 (15.9) 1,619 (16.7)

Deprivation score 25.1 ± 10.2 25.8 ± 10.2 25.7 ± 10.1 24.9 ± 10.2 25.1 ± 10.1

Values are presented as number (%) or mean ± standard deviation.

Table 3
Odds ratios (ORs) for crisis events and emergency presentations
Psychotic Severe Mild Agitated Anergic
LDA Emergency presentations OR (95% CI) 1.29 (1.17–1.43) 1.16 (1.05–1.29) 0.86 (0.78–0.94) 0.83 (0.75–0.92) 1.01 (0.91–1.13)
p-value <0.001* 0.01* <0.001* <0.001* 0.83
Crisis events OR (95% CI) 2.45 (2.15–2.80) 1.14 (0.98–1.33) 0.49 (0.41–0.57) 0.96 (0.86–1.13) 0.64 (0.54–0.78)
p-value <0.001* 0.08 <0.001* 0.82 <0.001*

Psychotic Severe Moderate Mild

LCA Emergency presentations OR (95% CI) 4.16 (3.50–4.95) 5.26 (4.58–6.05) 0.84 (0.74–0.95) 0.27 (0.23–0.31) -
p-value <0.001* <0.001* <0.001* <0.001*
Crisis events OR (95% CI) 1.32 (1.12–1.56) 1.62 (1.43–1.84) 1.12 (1.03–1.22) 0.71 (0.65–0.77) -
p-value <0.001* <0.001* <0.001* <0.001*

Adjusted for age, gender, ethnicity, and index of multiple deprivation score.

LDA: latent Dirichlet allocation, LCA: latent class analysis, CI: confidence interval.

* p < 0.05.

Table 4
HoNOS problems in the LDA patient groups
Scale Total (n = 18,314) Psychotic (n = 3,059) Severe (n = 3,140) Mild (n = 4,844) Agitated (n = 4,291) Anergic (n = 2,980) p-valuea
Agitation 1,397 (7.6) 442 (14.4) 180 (5.7) 282 (5.8) 358 (8.3) 135 (4.5) <0.001
Self-injury 2,624 (14.3) 490 (16.0) 612 (19.5) 561 (11.6) 623 (14.5) 338 (11.3) <0.001
Drug misuse 1,403 (7.7) 290 (9.5) 261 (8.3) 327 (6.8) 329 (7.7) 196 (6.6) 0.01
Cognition 1,328 (7.3) 364 (11.9) 193 (6.1) 286 (5.9) 289 (6.7) 196 (6.6) <0.001
Physical illness 3,846 (21.0) 693 (22.7) 696 (22.2) 954 (19.7) 890 (20.7) 613 (20.6) 0.06
Hallucinations 1,178 (6.4) 699 (22.9) 119 (3.8) 94 (1.9) 179 (4.2) 87 (2.9) <0.001
Depressed 9,063 (49.5) 1,634 (53.4) 1,616 (51.5) 2,243 (46.3) 2,033 (47.4) 1,537 (51.6) <0.001
Relationship 3,685 (20.1) 709 (23.2) 691 (22.0) 925 (19.1) 822 (19.2) 538 (18.1) <0.001
Daily living 3,130 (17.1) 635 (20.8) 553 (17.6) 689 (14.2) 726 (16.9) 527 (17.7) <0.001
Living conditions 1,714 (9.4) 391 (12.8) 355 (11.3) 363 (7.5) 347 (8.1) 258 (8.7) <0.001
Occupational 3,304 (18) 676 (22.1) 619 (19.7) 728 (15.0) 750 (17.5) 531 (17.8) <0.001
HoNOS missing 10,704 (58.4) 2,027 (66.3) 1,798 (57.3) 2,680 (55.3) 244 (57) 1,751 (58.8) <0.001

Values are presented as number (%).

HoNOS: Health of the Nation Outcome Scales, LDA: latent Dirichlet allocation.

a Chi-squared test with 4 degrees-of-freedom.

Table 5
HoNOS problems in the LCA patient groups
Scale Total (n = 18,314) Psychotic (n = 987) Severe (n = 1,596) Moderate (n = 6,063) Mild (n = 9,668) p-valuea
Agitation 1,397 (7.6) 242 (24.5) 245 (15.4) 426 (7) 484 (5) <0.0001
Self-injury 2,624 (14.3) 195 (19.8) 619 (38.8) 1,043 (17.2) 767 (7.9) <0.0001
Drug misuse 1,403 (7.7) 95 (9.6) 266 (16.7) 490 (8.1) 552 (5.7) <0.0001
Cognition 1,328 (7.3) 197 (20) 126 (7.9) 413 (6.8) 592 (6.1) <0.0001
Physical illness 3,846 (21.0) 210 (21.3) 333 (20.9) 1,279 (21.1) 2,024 (20.9) <0.0001
Hallucinations 1,178 (6.4) 401 (40.6) 216 (13.5) 251 (4.1) 310 (3.2) <0.0001
Depressed 9,063 (49.5) 599 (60.7) 1,137 (71.2) 3,170 (52.3) 4,157 (43) <0.0001
Relationship 3,685 (20.1) 274 (27.8) 519 (32.5) 1,268 (20.9) 1,624 (16.8) <0.0001
Daily living 3,130 (17.1) 257 (26) 330 (20.7) 1,072 (17.7) 1,471 (15.2) <0.0001
Living conditions 1,714 (9.4) 153 (15.5) 236 (14.8) 598 (9.9) 727 (7.5) <0.0001
Occupational 3,304 (18) 255 (25.8) 446 (27.9) 1,118 (18.4) 1,485 (15.4) <0.0001
HoNOS missing 10,704 (58.4) 233 (23.6) 369 (23.1) 2,530 (41.7) 4,490 (46.4) <0.0001

Values are presented as number (%).

HoNOS: Health of the Nation Outcome Scales, LCA: latent class analysis.

a Chi-squared test with 4 degrees-of-freedom.

TOOLS
Similar articles