Journal List > Korean J Anesthesiol > v.75(5) > 1516079502

Choi, Jung, Kim, Kim, and Lee: The state of anesthesia in South Korea: a national survey of the status of anesthetic service activity in 2014–2016

Abstract

Background

Because the quality of anesthesia affects the surgical outcome, the aim of this study was to investigate the current status of anesthetic services performed by anesthesiologists and non-anesthesiologists in South Korea from 2014 to 2016 and to compare the results with data from 2011 to 2013.

Methods

The claimed anesthesia services at medical institutions with employed anesthesiologists and the claims for an invitation fee for an anesthesiologist at medical institutions without employed anesthesiologists were regarded as anesthetic services performed by an anesthesiologist. From 2014 to 2016, the employment of anesthesiologists according to the type of medical institution, the status of anesthetic services according to the presence or absence of employed anesthesiologists, and status of anesthetic services at medical institutions without employed anesthesiologists were analyzed.

Results

The proportion of medical institutions that employed anesthesiologists slightly increased from 27.8% in 2014 to 28.8% in 2016. General anesthesia was more concentrated at higher medical institutions, and most anesthesias were performed by an anesthesiologist. The proportion of spinal anesthesia, epidural anesthesia, and brachial plexus performed by non-anesthesiologists was 11%, 15%, and 16.5%, respectively. Intravenous anesthesia performed by non-anesthesiologists was 58% and has increased compared to the past.

Conclusions

The employment of anesthesiologists has increased with time, and general anesthesiology was mostly performed by anesthesiologists. However, since the proportion of anesthetic services performed by non-anesthesiologists in regional anesthesia and intravenous anesthesia was maintained high, it is necessary to find ways to expand the safety of anesthetic services.

Introduction

South Korea’s health insurance system has been considered to be an unprecedented social insurance program worldwide, as it has achieved health insurance coverage for the entire population in a short period of time [1]. In addition, to reduce the burden on the people while guaranteeing the benefits to many people, the national insurance system is aiming to establish a low-guarantee, low-cost system. Nevertheless, the quality of national healthcare systems and medical technology in South Korea are very high, and the medical staff tends to accept advanced medical technologies and apply them to patient care relatively quickly [2]. In addition, because it is easy to search for medical knowledge through the Internet, the demand for high-quality medical services is increasing.
Since anesthesia has a significant impact on patient outcomes, it is very important to ensure high-quality anesthesia management during the perioperative period. However, anesthesiologists usually anesthetize patients in the operating room as a support procedure, and they do not usually meet patients at outpatient clinics before anesthesia. In addition, although patients undergoing surgery pay a lot of attention to the surgeon, they often do not have much interest in their anesthesiologists. Moreover, it is difficult to determine who performed anesthesia in the operating room without closely checking the medical records. Furthermore, the number of anesthetic procedures at medical institutions in South Korea is increasing every year, as it is legally acceptable for other medical specialists or general doctors to perform anesthetic procedures.
To ensure the provision of high-quality anesthetic services to patients, the Korean anesthesiologists and Korean Society of Anesthesiologists (KSA) make efforts to establish support and quality-check systems. The KSA has attempted to improve the quality of anesthetic procedures by investigating the current status of anesthetic services and identifying and solving problems. The KSA first investigated the status of anesthetic services performed by anesthesiologists and non-anesthesiologists in South Korea from 2011 to 2013 [3]. And as a second effort, the state of anesthetic service performed by anesthesiologists and non-anesthesiologists was investigated from 2014 to 2016 in this study.
In order to establish a system for improving the safety and quality of anesthetic services and to generate basic data for future research, the aim of this study was to identify the current status of anesthetic services performed by anesthesiologists and non-anesthesiologists in South Korea using the insurance claims data of the National Health Insurance (NHI) from 2014 to 2016. In addition, we analyzed changes in the status of anesthetic services between our findings from 2014 to 2016 and the previous investigation from 2011 to 2013.

Materials and Methods

This study was based on NHI claims data recorded from medical institutions nationwide from January 1, 2014, to December 31, 2016, extracted through the NHI Review and Assessment Service. These data are released by the NHI Data Sharing Service of South Korea for public research. Informed consent was obtained from all the participants or their legal guardians in advance. The study protocol was approved by the Institutional Review Board of Korea University Ansan Hospital (IRB no. 2020AS0156, Approval on May 25, 2020) and conducted at Korea University Ansan Hospital (Gyeonggi-do, Korea). The following data were collected from the claims: anesthesia service-related claims for all age groups, such as anesthesia procedure fees, anesthesia fees, and invitation fees for anesthesiologists but not government grants and veterans’ subsidies. In addition, the medical treatment history, patient’s disease diagnosis history, and prescription details were reviewed, and the current status of the medical institution was recorded.
The medical institutions were classified according to Korean medical law, and the following definitions were used: clinics having less than 30 beds, hospitals having 30 to 100 beds, general hospitals with more than 100 beds, and tertiary referral hospitals designated by the government as specialized hospitals for treating serious diseases. Clinics and hospitals with less than 100 beds were further classified as primary medical institutions and general hospitals with less than 100 beds as secondary medical institutions. Dental hospitals were classified separately. An anesthetic procedure was classified as an anesthetic service performed by an anesthesiologist when it was performed at a medical institution with an employed anesthesiologist or when the anesthesia procedure fees were claimed together with the invitation fee of an anesthesiologist at medical institutions without an employed anesthesiologist. As for the type of anesthesia, all anesthetic procedures, except for local anesthetic infiltration, were classified as general, regional, and intravenous anesthesia. General anesthesia was subdivided into endotracheal intubation and mask ventilation. Regional anesthesia was subdivided into spinal, epidural, and brachial plexus block. Intravenous anesthesia was defined as anesthesia that anesthetizes the patient using intravenous anesthetics while maintaining spontaneous breathing, as specified by the NHI.
Based on the data collected from 2014 to 2016, the employment status of anesthesiologists according to the type of medical institution, the status of anesthetic services according to the presence or absence of an employed anesthesiologist, and the status of anesthetic services at a medical institution without an employed anesthesiologist were analyzed. The data were expressed as numbers (percentages). In order to compare our data with the data from 2011 to 2013, we used the data that the KSA investigated [3], and the data were compared with a χ2 (chi-squared) test (SPSS ver. 22, IBM Corp., USA). P < 0.05 was considered statistically significant.

Results

Employment status of anesthesiologists by type of medical institution and overall status of anesthetic service performed by anesthesiologist or non-anesthesiologist

The proportion of medical institutions with employed anesthesiologists slightly increased in all medical institutions (Table 1). Approximately 63% of the hospitals employed their own anesthesiologists, but 92% of clinics did not. The rate of dental hospitals with employed anesthesiologists showed an increasing trend.
The total number of anesthesia cases was about 2 million in 2014–2016 (Tables 27). The average proportions of general, regional, and intravenous anesthesia for three years were approximately 53.4%, 37.8%, and 8.8%, respectively (Fig. 1). During 2014–2016, the annual proportion of total anesthesia performed at primary and dental hospitals without employed anesthesiologists was about 14% (Table 2). During 2014–2016, the annual proportion of total anesthetic procedures performed by non-anesthesiologist clinicians at primary hospitals and dental hospitals without employed anesthesiologists was about 10% (Table 2).
The proportion of hospitals with employed anesthesiologists had increased from 50% in the 2011–2013 analysis to 63% in 2014 (P < 0.001). The proportion of anesthetic procedures performed by non-anesthesiologists decreased slightly from 13–17% in 2011–2013 to 10.0% in 2016 (P < 0.001). In addition, the proportion of anesthetic procedures performed by non-anesthesiologists at medical institutions without employed anesthesiologists showed a decreasing trend from 76–78% in 2011–2013 to 71% in 2016 (P < 0.001).

The status of general anesthesia with endotracheal intubation by an anesthesiologist or non-anesthesiologist

During 2014–2016, approximately one million cases of general anesthesia with endotracheal intubation were performed annually at all medical institutions, and 1% of them were performed by non-anesthesiologists (Table 3). The annual proportions of anesthesia performed in primary and dental hospitals were 20.7% in 2014, 20.2% in 2015, and 18.9% in 2016. During 2014–2016, the annual proportion of anesthesia performed at medical institutions without employed anesthesiologists was about 3% (Tables 2 and 3). Among them, over 30% were performed by non-anesthesiologists (Table 2).
In 2014–2016, most of the anesthesia was performed more prominently in higher ranking medical institutions than clinics (P < 0.001). The rate of anesthesia performed at medical institutions without employed anesthesiologists was 5–9% in 2011–2013 and only 3% in 2014–2016 (P < 0.001). In addition, the proportion of anesthesia performed by non-anesthesiologists in medical institutions without employed anesthesiologists also decreased to approximately 30% in 2014–2016 from 57–63% in 2011–2013 (P < 0.001).

The status of general anesthesia with mask ventilation by an anesthesiologist or non-anesthesiologist

A total of 110,000–130,000 procedures of general anesthesia with mask ventilation were performed annually; among them, 4.3–4.9% were performed by a non-anesthesiologist (Table 4). The annual proportions of anesthesia performed in primary and dental hospitals were 57.6% in 2014, 56.8% in 2015, and 59.6% in 2016. During 2014–2016, the annual proportion of anesthesia performed at medical institutions without employed anesthesiologists was about 7.8% (Tables 2 and 4), and among them, 62.9%, 60.9%, and 55.7%, in 2014, 2015, and 2016, respectively, were performed by non-anesthesiologists (Table 2).
The overall proportion of anesthesia performed by non-anesthesiologists decreased from 9–14% in 2011–2013 to 4% in 2014–2016 (P < 0.001). The proportion of anesthesia performed at primary medical institutions decreased from 60.8% in 2012 to 56.8% 2015, but increased from 56.8% in 2015 to 59.6% in 2016 (P < 0.001). The rates of anesthesia performed at medical institutions without employed anesthesiologists were 12–18% in 2011–2013 and only 7% in 2014–2016 (P < 0.001). In addition, the proportion of anesthesia performed by non-anesthesiologists at medical institutions without employed anesthesiologists decreased to approximately 55–62% in 2014–2016 from 75–80% in 2011–2013 (P<0.001).

The status of regional anesthesia by an anesthesiologist or non-anesthesiologist

Spinal anesthesia

Annually, 380,000–450,000 spinal anesthesia procedures were performed in 2014–2016, and approximately 11% were performed by a non-anesthesiologist (Table 5). During 2014–2016, the annual proportion of anesthesia performed at primary medical institutions and dental hospitals was about 60%. During 2014–2016, the annual proportion of anesthesia performed at medical institutions without employed anesthesiologists was about 17%. Among them, about 66% was performed by non-anesthesiologists (Table 2).
The overall proportion of anesthesia performed by non-anesthesiologists decreased from 16–22% in 2011–2013 to 11% in 2014–2016 (P < 0.001). The proportion of anesthesia performed in primary medical institutions was 60.1% in 2014, 61.6% in 2015, and 61.2% in 2016 and rather increased in 2015 and 2016 from the average 60.1% in 2011–2013 (P = 1.00 in 2014, and P < 0.001 in 2015 and 2016). The proportion of anesthesia performed by anesthesiologists at medical institutions without employed anesthesiologists and the proportion of anesthesia performed by anesthesiologists at these hospitals decreased from 20–30% to 17% in 2014–2016 and from 74% to 65% in 2011–2013, respectively (P < 0.001).

Epidural anesthesia

Annually, 176,000–186,000 epidural anesthesias were performed, and approximately 15% of them were performed by non-anesthesiologists (Table 6). During 2014–2016, the annual proportion of anesthesia performed at primary medical institutions was about 88%. During 2014–2016, the annual proportion of anesthesia performed at medical institutions without employed anesthesiologists was about 31%. Among them, about 50% was performed by a non-anesthesiologist (Table 2).
The overall proportions of anesthesia performed by non-anesthesiologists decreased from 29% in 2011–2013 to 15% in 2014–2016 (P < 0.001). The proportion of anesthesia performed at primary medical institutions increased from 86% in 2011–2013 to 88% in 2014–2016 (P < 0.001). The proportion of anesthesia performed at medical institutions without employed anesthesiologists increased from 37–46% in 2011–2013 to 30% in 2014–2016 (P < 0.001). In addition, the proportion of anesthesia performed by non-anesthesiologists at these hospitals also decreased to approximately 50% in 2014–2016 from approximately 70% in 2011–2013 (P < 0.001).

Brachial plexus block

Annually, 150,000–170,000 brachial plexus blocks were performed, and approximately 16.5% of them were performed by non-anesthesiologists (Table 7). The annual proportion of anesthesia performed at primary medical institutions and dental hospitals was about 75%. During 2014–2016, the annual proportions of anesthesia performed at medical institutions without an employed anesthesiologist was about 26%. Among them, 68.8% in 2014, 63.5% in 2015, and 60.2% in 2016 were performed by non-anesthesiologists (Table 2).
The annual number of cases increased from 100,000–150,000 in 2011–2013 to 150,000–170,000 in 2014–2016, and the overall proportions of anesthesia performed by non-anesthesiologists decreased from 26% in 2011–2013 to 16.5% in 2014–2016 (P < 0.001). The proportion of anesthesia performed at primary medical institutions increased from an average of 72.7% in 2011–2013 to an average of 74.4% in 2014–2016 (P < 0.001). The proportion of anesthesia performed at medical institutions without employed anesthesiologists decreased from 35% in 2011–2013 to 25% in 2014–2016 (P < 0.001). In addition, the proportion of anesthesia performed by non-anesthesiologists at these hospitals also decreased to approximately 65% in 2014–2016 from approximately 75% in 2011–2013 (P < 0.001).

The status of intravenous anesthesia by anesthesiologist or non-anesthesiologist

The annual number of anesthesia decreased from 200,000 to 150,000 from 2014 to 2016; however, the proportions of anesthesia performed by non-anesthesiologists increased from 45% to 58% (Table 8). In addition, the proportion of anesthesia performed at primary institutions and dental hospitals increased from 76.6% in 2014 and 78.9% in 2015 to 85.8% in 2016. Moreover, the proportions of anesthesia performed at medical institutions without employed anesthesiologists increased from 45.2% in 2014 and 48.7% in 2015 to 58.3% in 2016, and most of them were performed by non-anesthesiologists (Table 2).
The overall proportions of anesthesia performed by non-anesthesiologists decreased from 54% in 2011 to 45.1% in 2014, but increased from 45.1% in 2014 to 58.1% in 2016, and in particular, in 2016, it increased significantly compared to 2011 (P < 0.001) The proportion of anesthesia performed at primary medical institutions increased from an average of 76.0% in 2011–2013 to an average of 80.7% in 2014–2016 (P < 0.001). The proportion of anesthesia performed at medical institutions without employed anesthesiologists decreased from 54% in 2011 to 45.2% in 2014, but increased from 45.2% in 2014 to 58.3% in 2016 (P < 0.001). In addition, the proportion of anesthesia performed by non-anesthesiologists at these hospitals also decreased to approximately 99.5% in 2014–2016 from 100% in 2011–2013 (P < 0.001).

Discussion

The practice of general anesthesia was more prominent at higher medical institutions than at institutions at the clinic level and below, and most anesthesias were performed by anesthesiologists. Even at medical institutions without employed anesthesiologists, the proportion of anesthesia performed by non-anesthesiologists in 2014–2016 was less than that in 2011–2013 by 50%. In the case of regional anesthesia, the proportion of anesthesia performed by non-anesthesiologists decreased, but the proportion of anesthesia performed in primary medical institutions increased. Fortunately, both the proportion of anesthesia performed at medical institutions without employed anesthesiologists and the proportion of anesthesia performed by non-anesthesiologists there decreased. The problem is that although the annual number of intravenous anesthesia has been reduced, the overall proportions of anesthesia performed by non-anesthesiologists decreased from 2011 to 2014 but increased from 2014 to 2016. The proportions of anesthesia performed in primary medical institutions increased, and the proportion of anesthesia performed at medical institutions without employed anesthesiologists decreased from 2011 to 2014 but increased from 2014 to 2016. Moreover, although the proportions of intravenous anesthesia performed by non-anesthesiologists at medical institutions without employed anesthesiologists statistically decreased compared to the past, most of them are still performed by non-anesthesiologists.
Endotracheal intubation is a procedure that requires special expertise in anesthesiology. If it fails, serious complications can arise, such as hypoxia and respiratory arrest; therefore, it is mostly performed by specialists. According to our study, the proportion of general anesthesia performed by anesthesiologists at upper-level medical institutions increased from 2014 to 2016. This change occurred when both medical staff and patients recognized the importance of general anesthesia being performed by anesthesiologists. In addition, general anesthesia with mask ventilation has a lower failure rate and is easier to perform than endotracheal intubation; non-anesthesiologist can be trained to carry out this procedure in a short period of time [4]. Therefore, the proportions of general anesthesia with mask ventilation performed by non-anesthesiologists at primary medical institutions and medical institutions without employed anesthesiologists were higher than the proportions of general anesthesia with endotracheal intubation.
However, at medical institutions without employed anesthesiologists, regular education and continued training will be needed in the future to prevent medical accidents and reduce the risk of complications. Paramedics such as emergency medical technicians usually have many opportunities to intubate, but studies have shown that emergency medical technicians usually attempt intubation 1.3 times and have a success rate of 80.6%. One study showed that the higher the intubation experience, the higher the success rate of intubation [5]. In a study involving interns, the success rate of mask ventilation was 85%, while the success rate of endotracheal intubation was 78%; the success rates increased to 94% and 90%, respectively, after some training [4]. In addition, the recently popular video laryngoscope can increase the intubation success rate of interns who have experienced lesser than 10 cases; therefore, in order to minimize the risk of failed intubation, we recommend the use of appropriate assistive devices and continued training of personnel [6,7].
The overall proportion of regional anesthesia performed by non-anesthesiologists decreased. The proportion of regional anesthesia performed by anesthesiologists at medical institutions without employed anesthesiologists and the proportion of anesthesia performed by anesthesiologists at these hospitals decreased. However, the proportion of anesthesia performed at primary medical institutions rather increased. The overall proportion of regional anesthesia performed by non-anesthesiologists and the proportion performed by non-anesthesiologists at medical institutions without employed anesthesiologists were higher than those of general anesthesia. A large percentage of spinal anesthesia is performed for orthopedic and general surgery. Since most of the surgeries are short, an anesthesiologist invited to medical institutions without employed anesthesiologists performs several spinal anesthesias during a single visit. In hospitals with branch offices, a small number of employed anesthesiologists are dispatched to other offices to perform procedures. In these cases, even though the procedure was performed by an anesthesiologist, the number of claims for the invitation fee of an anesthesiologist was less than the number of claims for anesthetic procedures, so the proportion of anesthesia performed by non-anesthesiologists may be overestimated. Epidural catheters inserted by anesthesiologists for labor analgesia can be used for cesarean section. In this case, an invitation fee of an anesthesiologist for cesarean section may not be additionally claimed and it may have been considered as performed by non-anesthesiologists in our study. In addition, spinal and epidural anesthesia for cesarean sections have been categorized in the Diagnosis-Related Group (DRG) since July 2013. As a result, anesthesia fee cannot be claimed separately, so it is possible that the proportion of anesthetic procedures performed by non-anesthesiologists was overestimated relatively as it was excluded from the analysis or classified as performed by non-anesthesiologists.
Brachial plexus block is being performed more frequently than in the past, but the proportion performed in medical institutions without employed anesthesiologists decreased slightly. However, the proportion performed by non-anesthesiologists was still higher than that of other types of anesthesia. The reason is thought to be that as the number of brachial plexus blocks guided by ultrasound increased, the proportion performed by non-anesthesiologists increased. Some studies on brachial plexus block reveal that it was performed by orthopedic surgeons [8,9], and globally, there is an increasing trend of regional anesthesia performed by non-anesthesiologists, nurse practitioners, or physician assistants [10]. In addition, the spread of ultrasound and the diversification of the practitioner [11,12] will lead to an increase in brachial plexus blocks for ambulatory surgery in primary medical institutions without employed anesthesiologists.
However, in addition to puncturing a needle in the target structure, regional anesthesia involves many other aspects, for example, interpreting readings from monitoring devices to check for adverse effects/complications, converting to general anesthesia if required, identifying signs/symptoms of local anesthetic systemic toxicity, and administering inotropes [10]. Very few studies have compared the rates of complications between anesthesiologists and non-anesthesiologists in regional anesthesia. In one study, for non-anesthesiologists to have a success rate of 90% or higher, experience of at least 45 cases of spinal anesthesia and 60 cases of epidural anesthesia was required [13]. However, experience of 27 cases of endotracheal intubation and 112 cases of spinal anesthesia was required for a high success rate of over 88%, suggesting that spinal anesthesia requires more training than the former [14]. Therefore, when regional anesthesia is performed by a non-anesthesiologist, caution must be needed and sufficient education and guidelines by anesthesiologists should be provided.
In this study, intravenous anesthesia was the most common anesthetic service performed by non-anesthesiologists, and more than half of the anesthesia was performed at primary medical institutions. In addition, when intravenous anesthesia was performed at medical institutions without employed anesthesiologists, most anesthesias were performed by non-anesthesiologists. There have been many studies on the risks of intravenous anesthesia by a non-anesthesiologist. In studies of the American Society of Anesthesiologists physical status (ASA-PS) class I and II patients, the incidence of complications was similar between intravenous anesthesia performed by an anesthesiologist and that performed by a non-anesthesiologist, and most of them were found to be safe [1517]. However, according to a meta-analysis [18], the risk of cardiopulmonary events was significantly higher for anesthesia performed by a non-anesthesiologist. Also, among the anesthesia-related medical disputes that occurred in Korea between 2009 and 2014 [19], the proportion of patients under the age of 60 was 82.9%, and the ASA-PS class I and II was 90.5%. Among them, about 33% of all medical accidents were due to intravenous anesthesia, and 92.3% of them were performed by a non-anesthesiologist, so the risk of anesthesia performed by a non-anesthesiologist in young and healthy patients cannot be overlooked. In the case of patients with ASA class 3 and 4, there is a study reporting that anesthesia by an anesthesiologist is desirable [20], and previous studies have mentioned that intravenous anesthesia should be performed by an anesthesiologist for patients in high-risk groups [21,22]. The reason is that, first, intravenous anesthesia is mostly performed at primary medical institutions, and the patient must cooperate with the treatment by providing information on smoking cessation, abstinence, drugs, and underlying diseases; however, these aspects are difficult to confirm in advance before surgery. In addition, because each patient has a different response to anesthetic drugs, emergency airway management may be required if the patient is deeply sedated, even if the correct dose is administered to the patient according to his/her weight. In order to respond competently to emergency situations, education on airway management such as knowledge of sedation drugs and airway intubation is required. However, in a study of Korean endoscopists, 27.3% of the respondents were not appropriately trained in sedation procedures and did not follow a specific sedation protocol [23].
Severe incidents may occur if accurate procedures are not performed by anesthesiologists. According to a study that analyzed the status of medical incidents that occurred at clinic-level hospitals in South Korea from 2010 to 2012, anesthesia was the cause of medical malpractice in approximately 0.3% of cases [24]. However, according to previous studies, when complications occurred, the period required for resolution was 28.1 weeks, which is quite a long time [2426]. Moreover, in a study that analyzed 105 cases of anesthesia-related medical disputes in South Korea from 2009 to 2014, 35 of 39 cases of intravenous anesthesia were cases of propofol use. Among intravenous anesthesia disputes, 30 disputes were related to fatal severity, and six disputes were related to permanent and severe sequelae [19]. Just as the hiring of non-physician providers such as nurse anesthetists and anesthesiology assistants in the United States has led to cost savings [27], the surgeons or non-anesthesiologists performing anesthetic services may have a cost-saving effect in South Korea. However, depending on the clinician who performs the anesthetic procedure, the patient’s postoperative outcome or length may be affected [28]. Anesthesia plays a crucial role in medical procedures, and it has a major influence on postoperative complications and surgical outcomes. Therefore, efforts to prevent side effects are required. In order to increase the employment and performance rate of anesthesiologists, efforts should be made to improve the safety of anesthetic procedures, such as introducing a real-name anesthesia system and expanding the evaluation of anesthesia adequacy to hospitals and clinic-level medical institutions. Also, enhanced anesthesia training and education for non-anesthesiologists and regular anesthesia-related patient safety identification should be implemented.
Our study has several limitations. First, some surgeries were categorized under the DRG, and this non-insured group was excluded from our status analysis. Since July 2013, South Korea implemented a DRG system for seven surgeries that are widely performed in all hospitals. In the fee-for-service system, anesthesia is charged separately, and it is possible to determine whether anesthesia was performed by an anesthesiologist. However, because anesthesia is not charged separately in the DRG system, it is not possible to determine whether anesthesia is performed by an anesthesiologist in the DRG surgeries. According to our analysis, the annual number of surgeries categorized as DRG increased rapidly from 766,223 in 2011 and 805,364 in 2012 to 964,012 in 2013 and from 1,098,517 in 2014 and 1,110,401 in 2015 to 1,153,465 in 2016. Considering that a large number of surgeries were classified as DRG surgeries, omitting them from the analysis may have led to biased results. In addition, in the case of non-insured surgeries, for which the patients pay the full costs, the Health Insurance Review and Assessment Service does not claim medical care benefits, so they were excluded from this analysis, and this may have limited the accuracy of our analysis. Second, under the Korean medical law, anesthetic procedures can be performed by a non-anesthesiologist. Therefore, it is difficult to say that all anesthetic procedures were performed by an anesthesiologist even at hospitals with employed anesthesiologists, so the numbers of anesthesia performed by anesthesiologists could have been overestimated, resulting in a fundamental bias.
In South Korea, given the pursuit of advanced medical care and increased public awareness of the needs of specialists, most general anesthesia requiring airway management is performed by anesthesiologists. The numbers of regional anesthesia and intravenous anesthesia performed by anesthesiologists are gradually increasing, but the rates of anesthesia performed by non-anesthesiologists are still high. In the event of a medical incident or complications caused by anesthesia, if an appropriate response is not provided, the consequences could be fatal. To promote anesthesia services that prioritize patient safety, it is necessary to improve public awareness of the importance of specialists, regularly investigate patient safety related to anesthesia, and implement legal and medical fee systems. Finally, it is important to establish a healthcare system that can provide safe and satisfactory anesthesia to patients.

Notes

Funding

None.

Conflicts of Interest

No potential conflict of interest relevant to this article was reported.

Author Contributions

Eun-Su Choi (Conceptualization; Data curation; Formal analysis; Writing – original draft)

Hee-Won Jung (Formal analysis)

Woon Young Kim (Formal analysis; Writing – review & editing)

Jae Hwan Kim (Conceptualization; Writing – review & editing)

Yoon-Sook Lee (Conceptualization; Data curation; Formal analysis; Writing – review & editing)

References

1. Shin YS. 30 years of Korean Health Insurance- its success, failure, and future directions. J Korean Med Assoc. 2007; 50:568–71.
2. Kim H, Yeo J, Kang S, Jung Y, Lee S. Review of the Korean health care system performance during 2000~2010 and policy implications based on OECD Health data. Sejong: Korea Institute for Health and Social Affairs;2012. Report No.: 2012-66.
3. Kim Y, Kim JM, Lee SG, Lee KY, Hong KH, Lee KH, et al. The state of anesthetic services in Korea: a national survey of the status of anesthesia provider in the 2011-2013 period. J Korean Med Sci. 2016; 31:131–8.
4. Komatsu R, Kasuya Y, Yogo H, Sessler DI, Mascha E, Yang D, et al. Learning curves for bag-and-mask ventilation and orotracheal intubation: an application of the cumulative sum method. Anesthesiology. 2010; 112:1525–31.
5. Garza AG, Gratton MC, Coontz D, Noble E, Ma OJ. Effect of paramedic experience on orotracheal intubation success rates. J Emerg Med. 2003; 25:251–6.
6. Rai MR, Dering A, Verghese C. The Glidescope system: a clinical assessment of performance. Anaesthesia. 2005; 60:60–4.
7. Savoldelli GL, Schiffer E, Abegg C, Baeriswyl V, Clergue F, Waeber JL. Learning curves of the Glidescope, the McGrath and the Airtraq laryngoscopes: a manikin study. Eur J Anaesthesiol. 2009; 26:554–8.
8. Kim CU, Lee CH, Yoon JY, Rhee SK. Ultrasound-guided axillary brachial plexus block, performed by orthopedic surgeons. J Korean Orthop Assoc. 2018; 53:513–21.
9. Strub B, Sonderegger J, Von Campe A, Grünert J, Osterwalder JJ. What benefits does ultrasound-guided axillary block for brachial plexus anaesthesia offer over the conventional blind approach in hand surgery? J Hand Surg Eur Vol. 2011; 36:778–86.
10. Pawa A, El-Boghdadly K. Regional anesthesia by nonanesthesiologists. Curr Opin Anaesthesiol. 2018; 31:586–92.
11. Herring AA. Bringing ultrasound-guided regional anesthesia to emergency medicine. AEM Educ Train. 2017; 1:165–8.
12. Chen XX, Trivedi V, AlSaflan AA, Todd SC, Tricco AC, McCartney CJ, et al. Ultrasound-guided regional anesthesia simulation training: a systematic review. Reg Anesth Pain Med. 2017; 42:741–50.
13. Kopacz DJ, Neal JM, Pollock JE. The regional anesthesia “learning curve”. What is the minimum number of epidural and spinal blocks to reach consistency? Reg Anesth. 1996; 21:182–90.
14. Charuluxananan S, Kyokong O, Somboonviboon W, Pothimamaka S. Learning manual skills in spinal anesthesia and orotracheal intubation: is there any recommended number of cases for anesthesia residency training program? J Med Assoc Thai. 2001; 84 Suppl 1:S251–5.
15. Alburquerque M, Smarrelli A, Montesinos JC, Carreño SO, Fernandez AZ, García AV, et al. Outcomes of colonoscopy with non-anesthesiologist-administered propofol (NAAP): an equivalence trial. Endosc Int Open. 2021; 9:E1070–6.
16. Cabadas Avión R, Baluja A, Ojea Cendón M, Leal Ruiloba MS, Vázquez López S, Rey Martínez M, et al. Effectiveness and safety of gastrointestinal endoscopy during a specific sedation training program for non-anesthesiologists. Rev Esp Enferm Dig. 2019; 111:199–208.
17. Ferreira AO, Torres J, Barjas E, Nunes J, Glória L, Ferreira R, et al. Non-anesthesiologist administration of propofol sedation for colonoscopy is safe in low risk patients: results of a noninferiority randomized controlled trial. Endoscopy. 2016; 48:747–53.
18. Daza JF, Tan CM, Fielding RJ, Brown A, Farrokhyar F, Yang I. Propofol administration by endoscopists versus anesthesiologists in gastrointestinal endoscopy: a systematic review and meta-analysis of patient safety outcomes. Can J Surg. 2018; 61:226–36.
19. Roh WS, Kim DK, Jeon YH, Kim SH, Lee SC, Ko YK, et al. Analysis of anesthesia-related medical disputes in the 2009-2014 period using the Korean Society of Anesthesiologists database. J Korean Med Sci. 2015; 30:207–13.
20. Khan HA, Umar M, Tul-Bushra H, Nisar G, Bilal M, Umar S. Safety of non-anaesthesiologist-administered propofol sedation in ERCP. Arab J Gastroenterol. 2014; 15:32–5.
21. Rex DK, Deenadayalu VP, Eid E, Imperiale TF, Walker JA, Sandhu K, et al. Endoscopist-directed administration of propofol: a worldwide safety experience. Gastroenterology. 2009; 137:1229–37.
22. Perel A. Non-anaesthesiologists should not be allowed to administer propofol for procedural sedation: a Consensus Statement of 21 European National Societies of Anaesthesia. Eur J Anaesthesiol. 2011; 28:580–4.
23. Lim JH. Sedation during endoscopy, can we take it easy? Korean J Helicobacter Up Gastrointest Res. 2017; 17:163–5.
24. Kim KK, Choi JW, Lee ES. The state of medical malpractice caused by private practice physicians (2010-2012): analysis through incident reports at Korean Medical Association Medical Indemnities Mutuals. J Korean Med Assoc. 2015; 58:336–48.
25. Im BH. Analysis of medical disputes precedent. J Korea Contents Assoc. 2010; 10:294–303.
26. Yang SH, Cho HS, Lee SH, Shon MS. Factors affecting the settlement amount of medical malpractice claims. J Korean Acad Fam Med. 1998; 19:604–20.
27. Venning P, Durie A, Roland M, Roberts C, Leese B. Randomised controlled trial comparing cost effectiveness of general practitioners and nurse practitioners in primary care. BMJ. 2000; 320:1048–53.
28. Lewis SR, Nicholson A, Smith AF, Alderson P. Physician anaesthetists versus non-physician providers of anaesthesia for surgical patients. Cochrane Database Syst Rev. 2014; (7):CD010357.
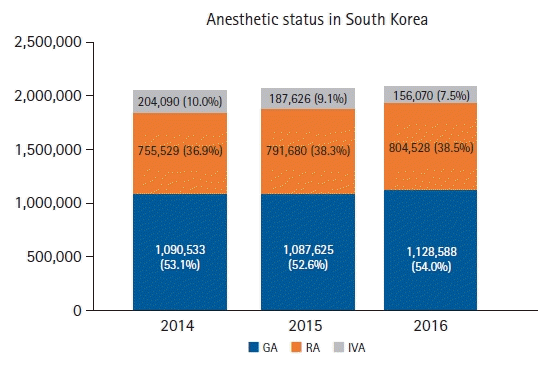
Fig. 1.
The proportion of anesthesia classification in South Korea (data from NHI, 2014–2016). GA: general anesthesia, RA: regional anesthesia, IVA: intravenous anesthesia.
kja-22286f1.tif
Table 1.
The Number of Institutions with Directly Employed Anesthesiologists (Sorted by Class of Institutions and Included All Kind of Anesthetic Procedure)
Class of institutions 2014
2015
2016
NEA (%) EA (%) Total NEA (%) EA (%) Total NEA (%) EA (%) Total
Tertiary referral hospital 43 (100.0) 43 43 (100.0) 43 43 (100.0) 43
General hospital 288 (100.0) 288 294 (100.0) 294 300 (100.0) 300
Hospital 363 (36.6) 630 (63.4) 993 337 (37.0) 641 (63.0) 1018 389 (37.7) 642 (62.3) 1031
Clinic 2780 (92.1) 237 (7.9) 3017 2695 (92.4) 221 (7.6) 2916 2657 (91.9) 234 (8.1) 2891
Dental hospital 4 (26.7) 11 (73.3) 15 3 (16.7) 15 (83.3) 18 3 (18.8) 13 (81.3) 16
Total 3147 (72.2) 1209 (27.8) 4356 3075 (71.7) 1214 (28.3) 4289 3049 (71.2) 1232 (28.8) 4281

NEA: non-employed anesthesiologist, EA: employed anesthesiologist.

Table 2.
The Number of Anesthesia Performed in Primary Institutions without Employed Anesthesiologists
Type of anesthesia 2014 2015 2016
NA (%) AA (%) NA (%) AA (%) NA (%) AA (%)
Endotracheal 11,080 (37.0) 18,901 (63.0) 9,722 (32.7) 20,001 (67.3) 8,615 (31.5) 18,768 (68.5)
Mask 5,817 (62.9) 3,424 (37.1) 5,940 (60.9) 3,807 (39.1) 5,607 (55.7) 4,468 (44.3)
Spinal 48,784 (66.7) 24,369 (33.3) 52,809 (67.4) 25,514 (32.6) 50,784 (64.5) 27,939 (35.5)
Epidural 27,476 (50.6) 26,819 (49.4) 28,583 (49.3) 29,397 (50.7) 27,958 (45.1) 30,397 (54.9)
Brachial block 27,972 (68.8) 12,700 (31.2) 26,067 (63.5) 14,993 (36.5) 26,332 (60.2) 17,389 (39.8)
Intravenous 91,999 (99.8) 203 (0.2) 91,230 (99.8) 204 (0.2) 90,623 (99.5) 452 (0.5)
Total 213,128 86,416 214,351 93,916 209,919 99,413

NA: number of anesthesia performed by non-anesthesiologists, AA: number of anesthesia performed by anesthesiologists.

Table 3.
The Number of General Anesthesia with Endotracheal Intubation Performed by Anesthesiologists (Sorted by Class of Institutions)
Class of institutions 2014 2015 2016
NA (%) AA (%) NA (%) AA (%) NA (%) AA (%)
Tertiary referral hospital 431,088 (100.0) 439,579 (100.0) 479,677 (100.0)
General hospital 340,451 (100.0) 328,538 (100.0) 346,181 (100.0)
Hospital 5,742 (3.4) 164,285 (96.6) 4,497 (2.8) 158,724 (97.2) 4,155 (2.6) 150,337 (92.8)
Clinic 4,947 (18.2) 22,163 (81.8) 4,902 (18.5) 21,657 (81.5) 4,095 (16.5) 9,469 (38.2)
Dental hospital 391 (9.7) 3,643 (85.6) 323 (7.8) 3,838 (92.2) 365 (7.1) 4,748 (92.9)
Total 11,080 (1.1) 961,630 (98.9) 9,722 (1.0) 952,336 (99.0) 8,615 (0.8) 988,702 (97.3)

NA: number of anesthesia performed by non-anesthesiologists, AA: number of anesthesia performed by anesthesiologists.

Table 4.
The Number of General Anesthesia with Mask Ventilation Performed by Anesthesiologists (Sorted by Class of Institutions)
Class of institutions 2014 2015 2016
NA (%) AA (%) NA (%) AA (%) NA (%) AA (%)
Tertiary referral hospital 17,235 (100.0) 20,586 (100.0) 19,851 (100.0)
General hospital 32,698 (100.0) 33,657 (100.0) 33,170 (100.0)
Hospital 4,357 (7.2) 55,787 (92.8) 4,240 (6.6) 59,809 (93.4) 4,139 (5.8) 67,114 (94.2)
Clinic 1,460 (20.0) 5,834 (80.0) 1,700 (24.3) 5,294 (75.7) 1,468 (21.2) 5,446 (78.8)
Dental hospital 452 (100.0) 281 (100.0) 83 (100.0)
Total 5,817 (4.9) 112,006 (95.1) 5,940 (4.7) 119,627 (95.3) 5,607 (4.3) 125,664 (95.7)

NA: number of anesthesia performed by non-anesthesiologists, AA: number of anesthesia performed by anesthesiologists.

Table 5.
The Number of Spinal Anesthesia Performed by Anesthesiologists (Sorted by Class of Institutions)
Class of institutions 2014 2015 2016
NA (%) AA (%) NA (%) AA (%) NA (%) AA (%)
Tertiary referral hospital 42,907 (100.0) 39,163 (100.0) 39,460 (100.0)
General hospital 125,892 (100.0) 130,278 (100.0) 136,292 (100.0)
Hospital 16,405 (7.9) 190,355 (92.1) 17,183 (7.9) 200,925 (92.1) 17,267 (7.6) 208,864 (92.4)
Clinic 32,379 (64.1) 18,096 (35.9) 35,626 (65.3) 18,891 (34.7) 33,517 (64.9) 18,094 (35.1)
Dental hospital 1 (100.0)
Total 48,784 (11.5) 377,250 (88.5) 52,810 (11.9) 389,257 (88.1) 50,784 (11.2) 402,710 (88.8)

NA: number of anesthesia performed by non-anesthesiologists, AA: number of anesthesia performed by anesthesiologists.

Table 6.
The Number of Epidural Anesthesia Performed by Anesthesiologists (Sorted by Class of Institutions)
Class of institutions 2014 2015 2016
NA (%) AA (%) NA (%) AA (%) NA (%) AA (%)
Tertiary referral hospital 5,292 (100.0) 4,977 (100.0) 4,825 (100.0)
General hospital 16,892 (100.0) 16,719 (100.0) 15,835 (100.0)
Hospital 14,515 (14.2) 87,858 (85.8) 14,400 (13.3) 93,622 (86.7) 11,121 (10.6) 93,712 (89.4)
Clinic 12,961 (24.9) 39,192 (75.1) 14,183 (25.2) 42,099 (74.8) 13,837 (26.3) 38,748 (73.7)
Dental hospital
Total 27,476 (15.5) 149,234 (84.5) 28,583 (15.4) 157,417 (84.6) 24,958 (14.0) 153,120 (86.0)

NA: number of anesthesia performed by non-anesthesiologists, AA: number of anesthesia performed by anesthesiologists.

Table 7.
The Number of Brachial Plexus Block Performed by Anesthesiologists (Sorted by Class of Institutions)
Class of institutions 2014 2015 2016
NA (%) AA (%) NA (%) AA (%) NA (%) AA (%)
Tertiary referral hospital 4,369 (100.0) 4,251 (100.0) 4,358 (100.0)
General hospital 34,338 (100.0) 36,246 (100.0) 39,849 (100.0)
Hospital 15,014 (15.9) 79,237 (84.1) 14,478 (14.0) 89,033 (86.0) 15,772 (14.4) 93,673 (85.6)
Clinic 12,958 (65.4) 6,869 (34.6) 11,589 (59.1) 8,016 (40.9) 10,560 (54.7) 8,743 (45.3)
Dental hospital 1 (100.0)
Total 27,972 (18.3) 124,813 (81.7) 26,067 (15.9) 137,546 (84.1) 26,332 (15.2) 146,624 (84.8)

NA: number of anesthesia performed by non-anesthesiologists, AA: number of anesthesia performed by anesthesiologists.

Table 8.
The Number of Intravenous Anesthesia Performed by Anesthesiologists (Sorted by Class of Institutions)
Class of institutions 2014 2015 2016
NA (%) AA (%) NA (%) AA (%) NA (%) AA (%)
Tertiary referral hospital 19,560 (100.0) 15,472 (100.0) 8,532 (100.0)
General hospital 28,173 (100.0) 24,150 (100.0) 13,572 (100.0)
Hospital 17,938 (26.3) 50,152 (73.7) 17,885 (29.3) 43,135 (70.7) 17,952 (35.5) 32,571 (64.5)
Clinic 74,061 (84.0) 14,086 (16.0) 73,345 (84.4) 13,531 (15.6) 72,671 (87.1) 10,772 (12.9)
Dental hospital 120 (100.0) 108 (100.0) 15 (100.0)
Total 91,999 (45.1) 112,091 (54.9) 91,230 (48.6) 96,396 (51.4) 90,623 (58.1) 65,447 (41.9)

NA: number of anesthesia performed by non-anesthesiologists, AA: number of anesthesia performed by anesthesiologists.

TOOLS
Similar articles