Abstract
Background
Methods
Results
Conclusions
Notes
Ethical statements
This study was approved by the National Health Insurance Service (NHIS) and the Institutional Review Board of Kangbuk Samsung Hospital (No. KBSMC 2021-04-049). The data are converted by deleting individuals’ names and IDs and encrypted, so there is no risk of exposing individuals’ personal information. Therefore, informed consent was not required.
Author contributions
Conceptualization: JHC, JHY, KDH, EJR, WYL; Data curation: JHC, HMK, SEP, JHY, KDH; Formal Analysis: JHC, JHY, KDH; Funding acquisition: WYL; Investigation: JHC, HMK, SEP; Methodology: KDH, EJR, WYL; Project administration: KDH, EJR, WYL; Resources: KDH, EJR, WYL; Software: JHY, KDH; Supervision: EJR, WYL; Validation: HMK, SEP, JHY, KDH; Visualization: JHC; Writing–original draft: JHC, HMK, SEP, JHY; Writing–review&editing: KDH, EJR, WYL.
All authors read and approved the final manuscript.
REFERENCES
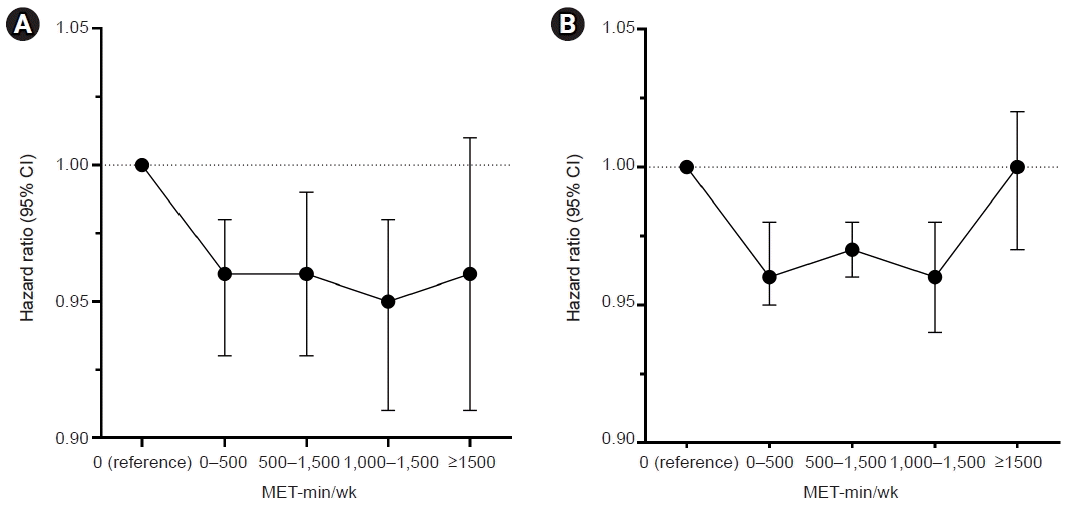
Fig. 2.

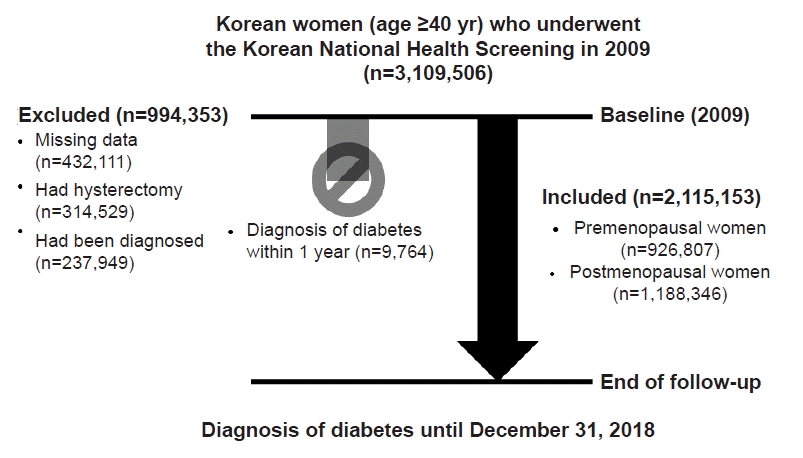
Table 1.
| Menopausal status | Premenopausal (n=926,807) | Postmenopausal (n=1,188,346) | P-value |
|---|---|---|---|
| Age (yr) | 45.1±4.2 | 61.2±8.3 | <0.001 |
| Body mass index (kg/m2) | 23.2±3.0 | 24.0±3.1 | <0.001 |
| Waist circumference (cm) | 75.0±7.9 | 79.5±8.4 | <0.001 |
| Low incomea) | 238,166 (25.7) | 271,208 (22.8) | <0.001 |
| Smoking | <0.001 | ||
| Non | 880,964 (95.0) | 1,145,050 (96.4) | |
| Ex | 14,811 (1.6) | 12,277 (1.0) | |
| Current | 31,032 (3.4) | 31,019 (2.6) | |
| Drinking | <0.001 | ||
| Non | 664,591 (71.7) | 1,036,187 (87.2) | |
| Mild | 251,766 (27.2) | 146,045 (12.3) | |
| Heavyb) | 10,450 (1.1) | 6,114 (0.5) | |
| Hypertension | 125,196 (13.5) | 508,287 (42.8) | <0.001 |
| Hyperlipidemia | 97,171 (10.5) | 373,185 (31.4) | <0.001 |
| Systolic blood pressure (mmHg) | 117.1±14.2 | 125.1±16.1 | <0.001 |
| Diastolic blood pressure (mmHg) | 73.1±9.9 | 76.8±10.2 | <0.001 |
| Total cholesterol (mg/dL) | 191.9±38.7 | 209.0±43.5 | <0.001 |
| LDL cholesterol (mg/dL) | 114.5±69.9 | 128.2±69.2 | <0.001 |
| HDL cholesterol (mg/dL) | 60.5±34.9 | 58.2±35.8 | <0.001 |
| Triglyceride (mg/dL) | 87.7 (87.6–87.8) | 113.4 (113.3–113.5) | <0.001 |
| Fasting plasma glucose (mg/dL) | 91.5±10.4 | 93.8±11.1 | <0.001 |
| Regular exercisec) | 159,833 (17.3) | 217,911 (18.3) | <0.001 |
| MET-min/wk | 472.8±492.1 | 472.4±536.9 | 0.556 |
| Diagnosed with diabetes | 38,096 (4.1) | 120,605 (10.2) | <0.001 |
| Median time to diagnosis (yr) | 8.29 | 8.38 | <0.001 |
Table 2.
| Amount of exercise | Mean MET-min/wk | No. of participants | No. of events | IR (per 1,000 person-years) |
HR (95% Cl) |
|||
|---|---|---|---|---|---|---|---|---|
| Model 1a) | Model 2b) | Model 3c) | Model 4d) | |||||
| Premenopausal | ||||||||
| 0 | 0 | 234,913 | 10,984 | 5.73 | 1 (Reference) | 1 (Reference) | 1 (Reference) | 1 (Reference) |
| 1–499 | 265.9±122.9 | 317,931 | 12,150 | 4.67 | 0.82 (0.80–0.84) | 0.88 (0.86–0.90) | 0.89 (0.87–0.91) | 0.96 (0.93–0.98) |
| 500–999 | 685.7±134.8 | 241,067 | 9,524 | 4.82 | 0.84 (0.82–0.87) | 0.89 (0.86–0.91) | 0.90 (0.88–0.92) | 0.96 (0.93–0.99) |
| 1,000–1,499 | 1202.6±152.8 | 92,281 | 3,745 | 4.95 | 0.86 (0.83–0.90) | 0.89 (0.86–0.92) | 0.90 (0.87–0.94) | 0.95 (0.91–0.98) |
| ≥1,500 | 1905.1±297.9 | 40,615 | 1,693 | 5.08 | 0.89 (0.84–0.93) | 0.88 (0.84–0.93) | 0.89 (0.85–0.94) | 0.96 (0.91–1.01) |
| Postmenopausal | ||||||||
| 0 | 0 | 375,861 | 40,806 | 13.87 | 1 (Reference) | 1 (Reference) | 1 (Reference) | 1 (Reference) |
| 1–499 | 272.4±120.2 | 336,125 | 32,931 | 12.4 | 0.89 (0.88–0.91) | 0.93 (0.92–0.95) | 0.94 (0.93–0.95) | 0.96 (0.95–0.98) |
| 500–999 | 676.5±130.3 | 295,705 | 29,331 | 12.53 | 0.90 (0.89–0.92) | 0.95 (0.94–0.96) | 0.95 (0.94–0.97) | 0.97 (0.96–0.98) |
| 1,000–1,499 | 1211.4±159.0 | 115,191 | 11,003 | 12.01 | 0.87 (0.85–0.88) | 0.93 (0.92–0.95) | 0.94 (0.92–0.96) | 0.96 (0.94–0.98) |
| ≥1,500 | 1988.5±321.6 | 65,464 | 6,534 | 12.57 | 0.91 (0.88–0.93) | 0.97 (0.94–0.99) | 0.97 (0.95–1.0) | 1.0 (0.97–1.02) |
Table 3.
| Amount of exercise | Mean MET-min/wk | No. of participants | No. of events | IR (per 1000 person-years) |
HR (95% Cl) |
|||
|---|---|---|---|---|---|---|---|---|
| Model 1a) | Model 2b) | Model 3c) | Model 4d) | |||||
| Premenopausal | ||||||||
| T1 | 21.0±40.3 | 301,300 | 13,488 | 5.48 | 1 (Reference) | 1 (Reference) | 1 (Reference) | 1 (Reference) |
| T2 | 357.9±127.4 | 315,858 | 12,030 | 4.65 | 0.85 (0.83–0.87) | 0.90 (0.88–0.92) | 0.91 (0.89–0.93) | 0.96 (0.93–0.98) |
| T3 | 1029.6±429.6 | 309,649 | 12,578 | 4.96 | 0.90 (0.88–0.93) | 0.92 (0.90–0.94) | 0.93 (0.91–0.95) | 0.97 (0.94–0.99) |
| Postmenopausal | ||||||||
| T1 | 0 | 375,861 | 40,806 | 13.87 | 1 (Reference) | 1 (Reference) | 1 (Reference) | 1 (Reference) |
| T2 | 317.0±149.0 | 403,242 | 39,455 | 12.38 | 0.89 (0.88–0.90) | 0.93 (0.92–0.95) | 0.94 (0.93–0.95) | 0.96 (0.95–0.98) |
| T3 | 1059.3±492.0 | 409,243 | 40,344 | 12.43 | 0.89 (0.88–0.91) | 0.95 (0.94–0.96) | 0.96 (0.94–0.97) | 0.97 (0.96–0.99) |
Table 4.
| No. of day/wk by intensity | No. of participants | No. of events | IR (per 1,000 person-years) |
HR (95% Cl) |
|||
|---|---|---|---|---|---|---|---|
| Model 1a) | Model 2b) | Model 3c) | Model 4d) | ||||
| Premenopausal | |||||||
| Vigorous | |||||||
| 0 | 628,022 | 26,353 | 5.13 | 1 (Reference) | 1 (Reference) | 1 (Reference) | 1 (Reference) |
| 1–3 | 225,267 | 8,783 | 4.75 | 0.93 (0.90–0.95) | 0.93 (0.91–0.96) | 0.95 (0.92–0.97) | 0.97 (0.95–1.0) |
| 4–5 | 50,718 | 1,899 | 4.56 | 0.89 (0.85–0.93) | 0.87 (0.84–0.92) | 0.89 (0.85–0.93) | 0.92 (0.88–0.97) |
| ≥6 | 22,800 | 1,061 | 5.68 | 1.10 (1.04–1.17) | 1.01 (0.95–1.08) | 1.02 (0.96–1.08) | 1.03 (0.97–1.10) |
| Moderate | |||||||
| 0 | 550,754 | 23,409 | 5.2 | 1 (Reference) | 1 (Reference) | 1 (Reference) | 1 (Reference) |
| 1–3 | 276,509 | 10,603 | 4.68 | 0.90 (0.88–0.92) | 0.94 (0.92–0.96) | 0.95 (0.93–0.97) | 0.98 (0.96–1.01) |
| 4–5 | 65,907 | 2,570 | 4.75 | 0.91 (0.88–0.95) | 0.92 (0.88–0.95) | 0.93 (0.89–0.96) | 0.97 (0.93–1.01) |
| ≥6 | 33,637 | 1,514 | 5.49 | 1.06 (1.0–1.11) | 1.01 (0.96–1.06) | 1.01 (0.96–1.07) | 1.01 (0.96–1.07) |
| Walking | |||||||
| 0 | 290,065 | 13,142 | 5.54 | 1 (Reference) | 1 (Reference) | 1 (Reference) | 1 (Reference) |
| 1–3 | 346,032 | 13,272 | 4.69 | 0.85 (0.83–0.87) | 0.91 (0.87–0.93) | 0.92 (0.90–0.94) | 0.97 (0.94–0.99) |
| 4–5 | 145,140 | 5,537 | 4.65 | 0.84 (0.81–0.87) | 0.88 (0.86–0.91) | 0.89 (0.87–0.92) | 0.94 (0.91–0.97) |
| ≥6 | 145,570 | 6,145 | 5.16 | 0.93 (0.90–0.98) | 0.95 (0.92–0.98) | 0.96 (0.93–0.99) | 1.00 (0.97–1.03) |
| Postmenopausal | |||||||
| Vigorous | |||||||
| 0 | 863,205 | 90,078 | 13.28 | 1 (Reference) | 1 (Reference) | 1 (Reference) | 1 (Reference) |
| 1–3 | 221,338 | 20,422 | 11.57 | 0.87 (0.86–0.88) | 0.94 (0.92–0.95) | 0.95 (0.93–0.96) | 0.96 (0.95–0.98) |
| 4–5 | 55,525 | 5,044 | 11.38 | 0.86 (0.83–0.88) | 0.93 (0.91–0.96) | 0.94 (0.91–0.97) | 0.96 (0.93–0.99) |
| ≥6 | 48,278 | 5,061 | 13.23 | 1.00 (0.97–1.02) | 1.02 (1.0–1.05) | 1.03 (1.0–1.06) | 1.03 (1.0–1.06) |
| Moderate | |||||||
| 0 | 781,988 | 81,758 | 13.31 | 1 (Reference) | 1 (Reference) | 1 (Reference) | 1 (Reference) |
| 1–3 | 262,120 | 24,677 | 11.84 | 0.89 (0.88–0.90) | 0.94 (0.93–0.96) | 0.95 (0.94–0.97) | 0.97 (0.96–0.99) |
| 4–5 | 76,432 | 6,948 | 11.41 | 0.86 (0.84–0.88) | 0.92 (0.90–0.94) | 0.92 (0.90–0.95) | 0.95 (0.92–0.97) |
| ≥6 | 67,806 | 7,222 | 13.47 | 1.01 (0.99–1.04) | 1.03 (1.01–1.06) | 1.04 (1.01–1.06) | 1.05 (1.03–1.08) |
| Walking | |||||||
| 0 | 444,550 | 47,333 | 13.57 | 1 (Reference) | 1 (Reference) | 1 (Reference) | 1 (Reference) |
| 1–3 | 345,070 | 33,371 | 12.22 | 0.90 (0.89–0.91) | 0.94 (0.93–0.96) | 0.95 (0.94–0.96) | 0.97 (0.95–0.98) |
| 4–5 | 162,310 | 15,231 | 11.82 | 0.87 (0.86–0.89) | 0.92 (0.91–0.94) | 0.93 (0.91–0.95) | 0.94 (0.92–0.95) |
| ≥6 | 236,416 | 24,670 | 13.23 | 0.98 (0.96–0.99) | 0.99 (0.98–1.01) | 0.99 (0.98–1.01) | 1.00 (0.99–1.02) |


 PDF
PDF Citation
 Print
Print


 XML Download