

 PDF
PDF Citation
 Print
Print


INTRODUCTION
Breast cancer is the most common cancer and is the leading cause of cancer death among women [1]. According to Korean National Cancer Registration data, the incidence rate of breast cancer is increasing annually [2]. Breast cancer is a heterogeneous disease in terms of histology, therapeutic response, and patient outcomes [3]. Triple-negative breast cancer (TNBC) is a highly heterogeneous and clinically aggressive breast cancer that accounts for 15%–20% of all breast cancers and has the highest death rate of all breast cancer subtypes [456]. Because of its heterogeneity, various combined therapeutic modalities are implemented. Clinicopathological factors such as TNM stage, histological grade, estrogen receptor (ER), progesterone receptor (PR) expression, and human epidermal growth factor receptor 2 (HER-2) gene amplification are considered prognostic factors which provide the key for therapeutic strategies. Therefore, it is essential to define specific tumor markers to reflect the prognosis.
FRAT1 (frequently rearranged in advanced T-cell lymphomas 1), a member of the Frat family, is located on human chromosome 10q24.1, encoding a 29-kDa protein comprising 279 amino acids [7]. FRAT1 has been considered to be a positive activator of the Wnt/beta-catenin (β-catenin) signaling pathway, which is a family of proteins that are involved in many vital cellular functions such as regeneration and organogenesis [8910]. FRAT1 has been reported to be overexpressed in several tumors, such as non-small-cell lung cancer (NSCLC) [8], gliomas [11], ovarian cancers [12], esophageal squamous cell carcinomas [13], and colon cancer [14]. This data suggests that FRAT1 is associated with an aggressive phenotype. The relevance of the expression status of FRAT1 in breast cancer has not been determined, and its role in biological behavior is also unknown.
In the present study, we investigated the prognostic validity of FRAT1 expression and analyzed correlations with clinicopathological parameters and overall survival (OS) in breast cancer patients. These results may have a great contribution to the prediction of prognosis.
METHODS
Patients and clinicopathologic data
This study includes not only the breast cancer dataset from The Cancer Genome Atlas (TCGA) database (http://dna00.bio.kyutech.ac.jp/PrognoScan/index.html) [15], but we also collected 226 cases of invasive breast cancer at Konkuk University Medical Center between January 2009 and December 2011. Clinicopathological data such as age, tumor size, nodal stage, histologic grade, ER status, PR status, HER-2 amplification status, and CK5/6 expressions were obtained from the patients’ medical records and pathological reports. All patients were of the female gender, and their treatment was either modified radical mastectomy or breast-conserving surgery, and tumors were completely removed by surgery with pathological evaluation. After the completion of the surgery, adjuvant treatment with radiotherapy, chemotherapy, and hormone therapy was administered based on international guidelines. All the patients were staged according to the TNM stage, which was based on the criteria of American Joint Committee on Cancer, 8th edition. The patients were classified into 4 molecular subtypes, as follows: luminal A: ER-positive (ER+) and/or PR-positive (PR+), HER-2-negative (HER-2-) and low Ki67 level (<14.0%); luminal B: ER+ and/or PR+, Ki67 ≥14.0%, HER-2- or HER-2-positive (HER-2+); HER-2: ER-negative (ER-) and PR-negative (PR-), HER-2+; and TNBC: ER-, PR-, and HER-2-. We also analyzed the survival times of patients. The median follow-up time was 24 months.
The study was approved by the Institutional Review Board of Konkuk University Medical Center (No. KUH1210054).
The expression of FRAT1 was determined using TIMER 2.0
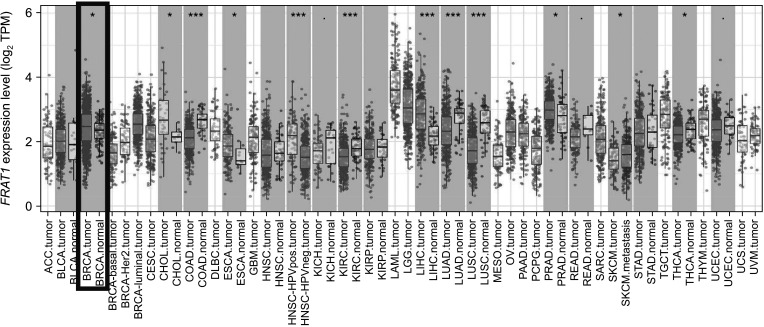
TIMER (Tumor Immune Estimation Resource) 2.0 (http://timer.cistrome.org) is a comprehensive resource for systematical analysis of immune infiltrates across diverse cancer types [16]. In this study, TIMER 2.0 was used to analyze the expression of FRAT1 in breast cancer tissues and normal tissues across all TCGA datasets.
UALCAN analysis
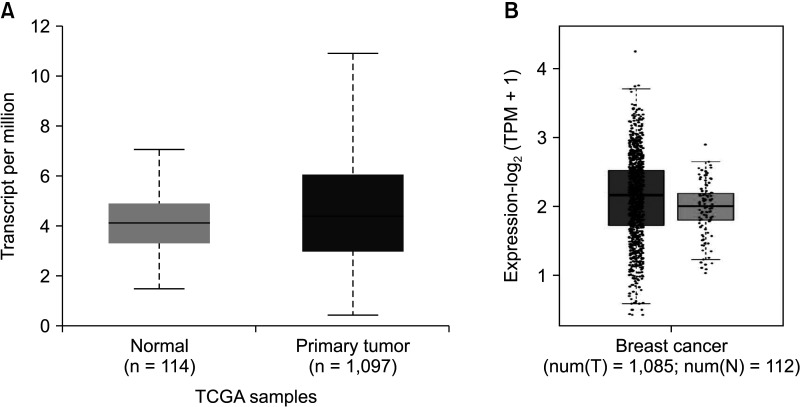
UALCAN (http://ualcan.path.uab.edu) is a website for the online analysis and mining of cancer data based mainly on the analysis of relevant cancer data in the TCGA database [17]. In this study, we used it to assess FRAT1 expression in breast cancer tissues and normal breast tissues.
GEPIA 2 web analysis
GEPIA (Gene Expression Profiling Interactive Analysis) 2 (http://gepia2.cancer-pku.cn/#index) is a web server for analyzing the RNA sequencing expression data of tumors and normal samples from the TCGA and GTEx (Genotype-Tissue Expression) projects, using a standard processing pipeline [18]. The GEPIA box-plot tool was used for tumor/normal differential expression analysis for FRAT1 in breast cancers.
Immunohistochemical assessment of FRAT1
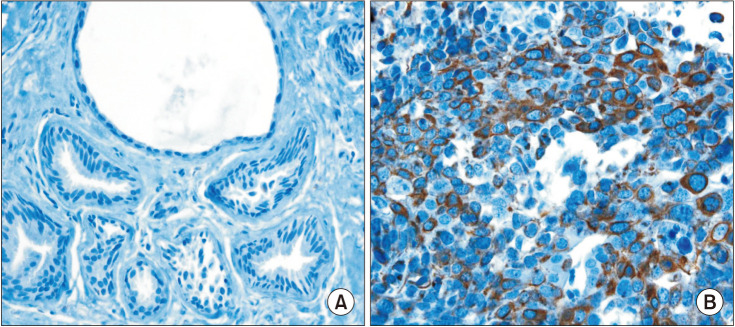
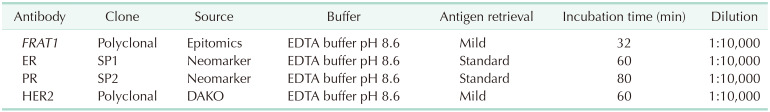
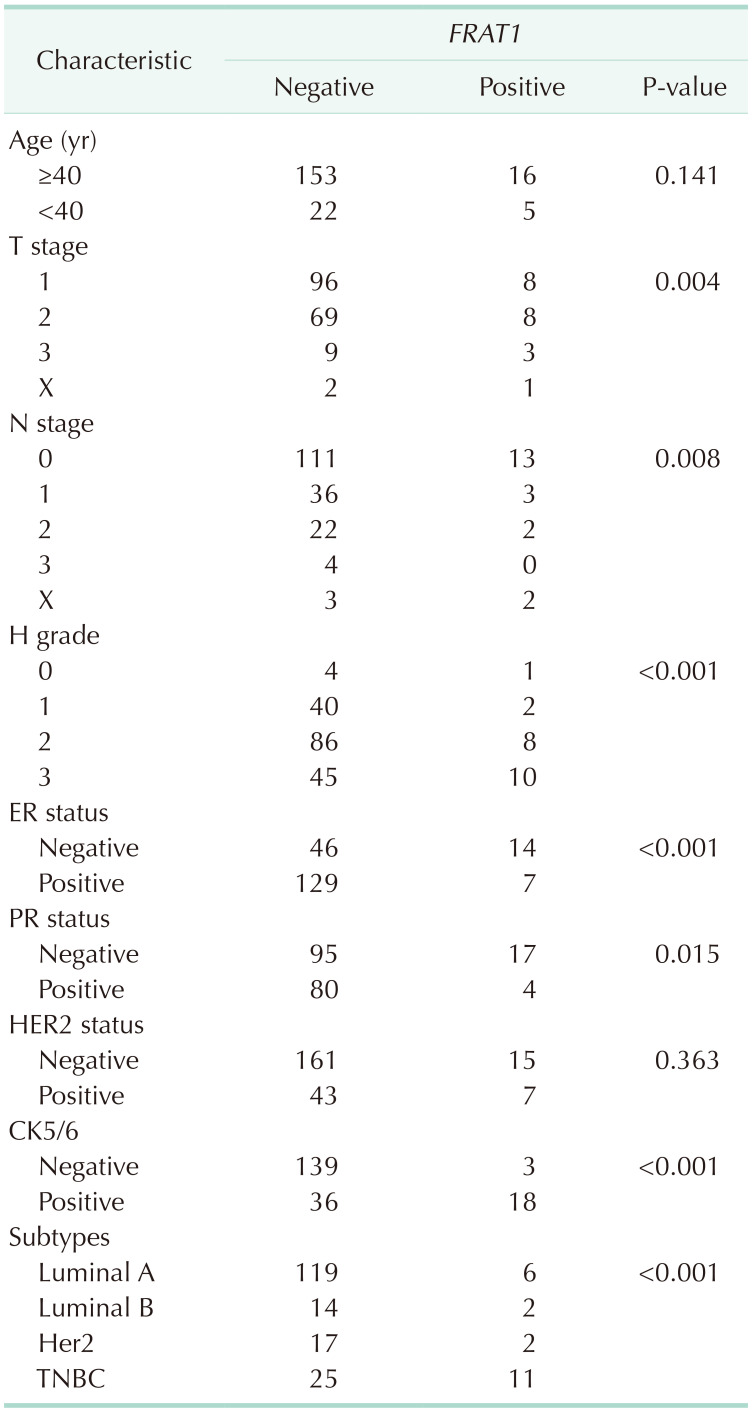
Four-micrometer sections were made from the formalin-fixed, paraffin-embedded blocks, which were then deparaffinized in xylene and rehydrated in a graded series of alcohol solutions. For antigen retrieval, paraffin tissue sections were cooked with 10-mM sodium citrate buffer, pH 6.0, at a sub-boiling temperature for 15 minutes and cooled for 20 minutes at room temperature. The sections were washed twice with Tris-buffered saline for 10 minutes. The antibody incubations were carried out at room temperature for 1 hour. FRAT1 was detected with standard avidin-biotin-peroxidase techniques using diaminobenzidine as the chromogen. Afterward, the slides were briefly counterstained with hematoxylin, dehydrated, and mounted. The immunostained samples were evaluated by 2 pathologists. The expression of FRAT1 was graded in terms of the percentage of cytoplasmic membrane staining in each block as well as the intensity of staining. However, there is no common cutoff value for the patterns of staining. In this study, the grade was designated according to the following criteria: negative, staining in less than 1% and positive, staining in more than 1% of tumor cells (Table 1).
Immunohistochemical assessment of hormone receptors and HER-2
ER and PR statuses were determined by immunohistochemistry (IHC) using the American Society of Clinical Oncology/College of American Pathologists (ASCO/CAP) guidelines. Tumors with >1% positively stained tumor cells were classified as positive for ER and PR. HER-2 status was also determined by IHC. HER-2 positive tumors were defined as 3+ and HER-2 negative tumors were defined as 0 or 1+, using the ASCO/CAP guidelines as the criteria for immunohistochemical staining. We performed silver in situ hybridization (SISH) to determine an accurate HER-2 status in tumors with equivocal immunoreactivity (2+).
Overexpression of FRAT1 survival analysis
We used PrognoScan (http://dna00.bio.kyutech.ac.jp/PrognoScan/index.html) to analyze the overexpressed FRAT1 and OS in breast cancer. The Kaplan-Meier plotter, and R2: Kaplan-Meier scanner with the log-rank test was used to examine the data. The cohorts from GSE (GSE9893) and TCGA were divided into 2 groups according to FRAT1 expression (high, >67%; low, ≤33%). All statistical tests were 2-sided.
Breast Cancer Gene-Expression Miner ver. 4.8 analysis
The Breast Cancer Gene-Expression Miner ver. 4.8 (bc-GenExMiner 4.8, http://bcgenex.ico.unicancer.fr/BC-GEM/GEM-Accueil.php?js=1) is developed as a web-based tool including a MySQL relational database [19]. It was used to analyze the relationship between FRAT1 expression and clinicopathological parameters in breast cancer patients.
Statistical analysis
R software ver. 3.6.3 (R Foundation for Statistical Computing, Vienna, Austria) was used to perform the statistical analysis. Differences between groups were compared using the Wilcoxon rank-sum test or Student t-test, as appropriate. The chi-square test was used to analyze the possible correlations between FRAT1 expression and clinicopathologic factors. OS was defined as the time from surgery until the time of death. OS was estimated using the PrognoScan, Kaplan-Meier plotter, and Kaplan-Meier scanner. A P-value of <0.05 was considered statistically significant. IBM SPSS Statistics ver. 20.0 (IBM Corp, Armonk, NY, USA) was used for statistical analyses.
RESULTS
The differential expression of FRAT1 in human breast cancer
TIMER 2.0 was used to analyze the messenger RNA (mRNA) levels of FRAT1 in tumor tissues and normal tissues. The results showed that FRAT1 was overexpressed in breast cancer as compared to its expression levels in normal tissues, P < 0.05 (Fig. 1). To further evaluate the differential expression of FRAT1, we compared its expression level in the TCGA dataset using UALCAN. As shown in Fig. 2A, the expression of FRAT1 in breast cancer tissues is significantly higher than in normal tissue, P < 0.001 (Fig. 2A). In addition, it was discovered that the expression of FRAT1 mRNA in breast cancer tissues was significantly higher than that in normal tissues using GEPIA2 web analysis (P < 0.01) (Fig. 2B).
Clinicopathologic characteristics
The median age was 56 years (range, 27–79 years). Among them, 66 patients underwent modified radical mastectomy, and 130 underwent breast-conserving surgery. The distribution of tumor and node stage was as follows: T1 in 104, T2 in 77, T3 in 12, N0 in 124, N1 in 39, N2 in 24, and N3 in 4 cases.
Correlation between FRAT1 expression and clinicopathological variables
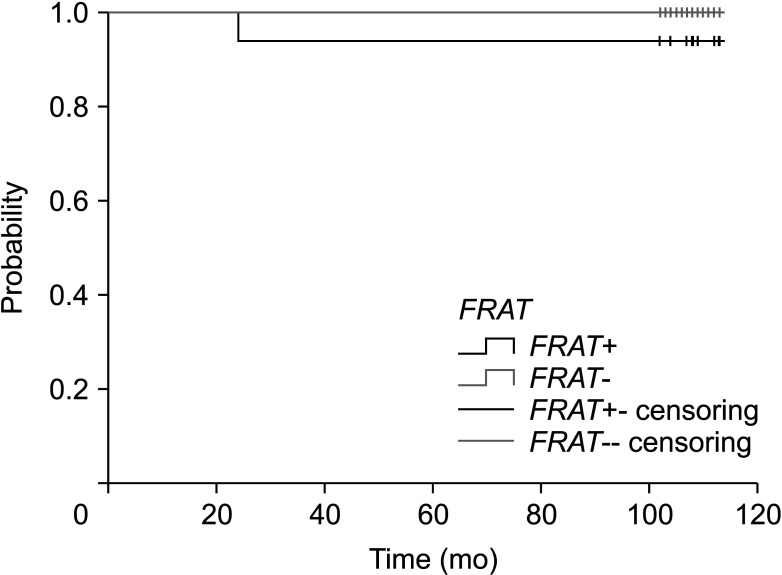
The expression of FRAT1 in breast cancer tissue was correlated with the patients’ clinicopathologic features. The clinicopathological characteristics of the patients according to FRAT1 positivity and negativity are shown in Table 2. In this study, FRAT1 was positively and markedly correlated with an increase in the TNM stages. FRAT1 positivity was correlated with tumor size (P = 0.004) and nodal status (P = 0.008). The FRAT1 positivity group had an association with a high histologic grade (P < 0.001) compared to the normal group. The expression of FRAT1 was shown to be increased with histological grade. Interestingly, CK5/6 is the most useful and important marker for the identification of the basal subgroup of TNBC [20]. Eighteen out of 21 cases with positive staining of CK5/6 showed FRAT1 expression, which is statistically significant (P < 0.001). Furthermore, the FRAT1 positivity group also had an association with ER negativity (P < 0.001) and PR negativity (P < 0.001). Although there was no statistically significant result, FRAT1 positivity was observed more in HER-2 negativity (P = 0.363). There was a significant difference in the subtype and the FRAT1 positivity group had more TNBC (11 out of 21). There was no significant correlation between FRAT1 expression and age and HER-2 status. Kaplan-Meier survival analysis demonstrated that the group with FRAT1 expression showed significantly worse OS than the one without FRAT1 expression (Fig. 4).
Clinicopathological relationship of FRAT1 the messenger RNA expression in breast cancer
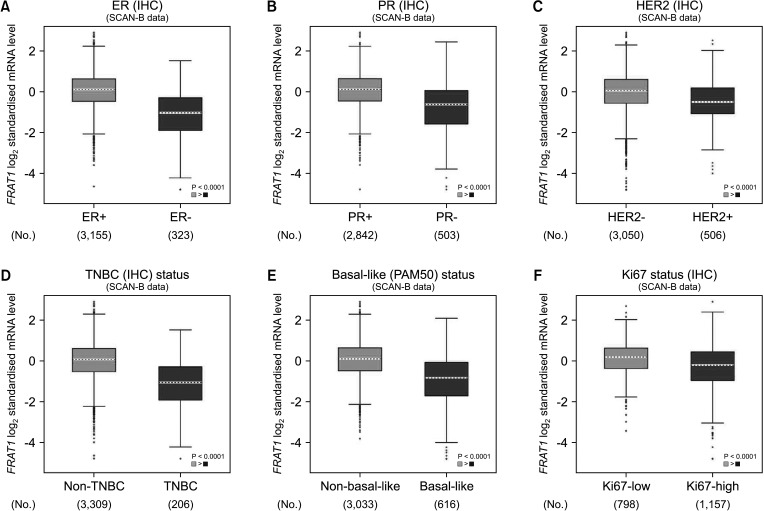
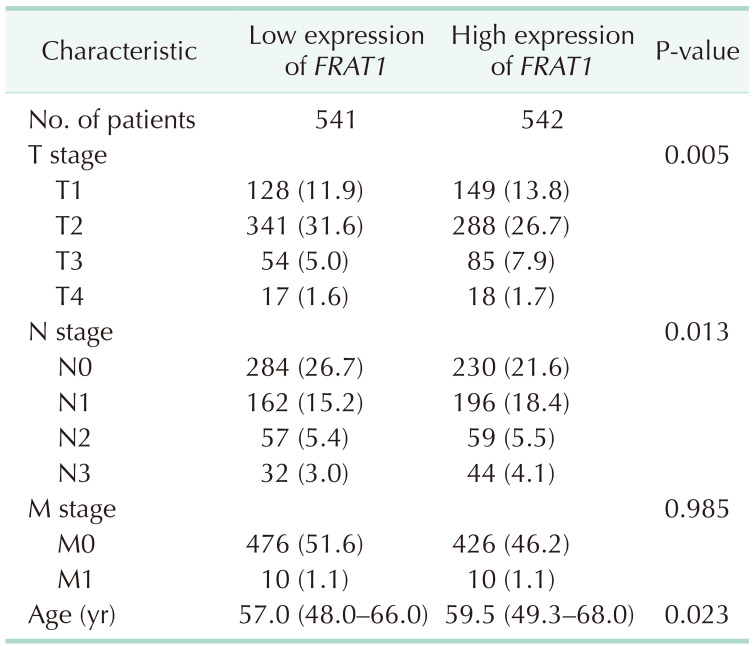
In the TCGA database, differential expression of FRAT1 in breast cancer was correlated with T stage, lymph node stage, and age (Table 3). In Fig. 5, we used bc-GenExMiner 4.8 to compare the transcription levels of FRAT1 among groups of patients according to different clinicopathological characteristics. The results showed that the overexpression of FRAT1 was significantly related to ER (IHC) status, PR (IHC) status, Her-2 (IHC) status, TNBC (IHC) status, basal-like (PAM 50) status, and Ki67 (IHC) status, P < 0.001 (Fig. 5).
Overexpression of FRAT1 survival analysis
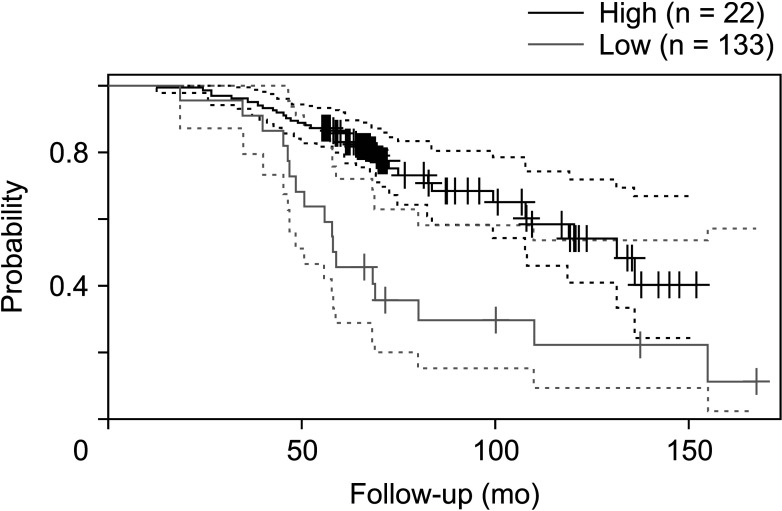
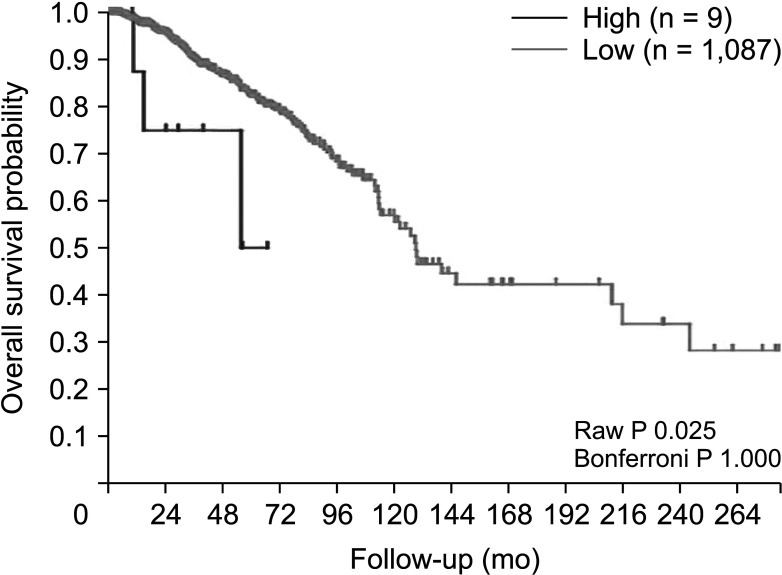
Next, the prognostic value of FRAT1 mRNA expression in human breast cancer was further evaluated, using these online databases, including PrognoScan, and R2: Kaplan-Meier scanner. As shown in Fig. 6 (PrognoScan), we found that overexpression of FRAT1 was associated with poorer OS (P = 0.010) (Fig. 6). The result of R2: Kaplan-Meier scanner showed that overexpression of FRAT1 was associated with a poor prognosis for patients with breast cancer (P = 0.025) (Fig. 7). The results revealed that overexpression of FRAT1 was significantly associated with poor prognosis. All these findings indicate that FRAT1 may serve as a poor predictor of the prognosis of patients with breast cancer.
DISCUSSION
TNBC is a heterogeneous and deadly disease in women with limited therapy choices, necessitating the development of novel targeted therapies [21]. The FRAT1 mapped to human chromosome 10q24.1, which is a human homolog of mouse proto-oncogene FRAT1 [7]. Proto-oncogene FRAT1 was first identified as a T-cell lymphoma proto-oncogene that encodes a 29KD protein. FRAT1 regulates Wnt/β-catenin signaling through inhibiting the acidification of GSK3 on β-catenin and translocation into the nucleus, where it binds to the TCF/LEF signal transduction pathway [1322]. Dysregulation of Wnt/β-catenin signaling has been thought to play an important role in different kinds of cancers. Extensive studies have shown that the Wnt signal transduction pathway is associated with different kinds of human cancers, such as colon cancer, acute leukemia, lung cancer, and glioma [1223]. FRAT1 has been identified as a component of the Wnt signaling pathway in previous research [2425]. FRAT1 is a positive regulator of the Wnt/β-catenin pathway [12]. Overexpression of FRAT1 leads to β-catenin stabilization through dissociation of GSK-3β from Axin and inhibition of β-catenin phosphorylation [2526]. High FRAT1 expression is associated with increased malignancy and a higher clinical stage [27]. FRAT1 was associated with invasion, metastasis, and malignant phenotypes. In this study, we observed FRAT1 overexpression in breast cancer. FRAT1 positivity was correlated with tumor size, nodal status, histologic grade, and CK5/6. Furthermore, the FRAT1 positivity group also had an association with ER negativity and PR negativity. There was a significant difference in the subtype and the FRAT1 positivity group had more TNBC. TNBC is one of the subtypes of malignant breast cancer with the worst prognosis [28]. Most patients have been diagnosed at an advanced stage or experience a recurrence within a short period of time. Thus, a special approach to treatment and strategy are needed. Importantly, FRAT1 positivity is correlated with poor OS in breast cancer patients. Furthermore, we assessed the expression pattern of FRAT1 in human breast cancer by bioinformatics validation. Then, the prognostic significance of FRAT1 expression in breast cancer was also analyzed. Higher expression of FRAT1 indicated poorer OS in breast cancer in different kinds of online databases. Furthermore, previous studies on different types of malignancies have reported the role of high expression of FRAT1 protein but not in breast cancer. Interestingly, previous studies demonstrated that Wnt7a protein expression was significantly correlated with ER expression, and loss of Wnt7a expression was associated with poor disease-free survival in breast cancer patients [29]. Wnt7a is a member of the Wnt family, which is regulated by FRAT1. The exact function that FRAT1 plays in the pathway in controlling carcinogenesis is unknown. Therefore, further research will be needed. In conclusion, FRAT1 protein is abnormally expressed in breast cancer. FRAT1 might be involved in the malignancy progression of breast cancer. High expression of FRAT1 is correlated with clinical and pathological stages and poorer OS. Therefore, positive FRAT1 expression is a biomarker for cancer severity and a predictive marker of poor prognosis in breast cancer.
 XML Download