

 PDF
PDF Citation
 Print
Print


INTRODUCTION
METHODS
Benchtop model
Laser fiber collection and the laser setting
Inspection of the shortened laser fiber and the cavitation bubbles
Statistical analysis
RESULTS
Fig. 1
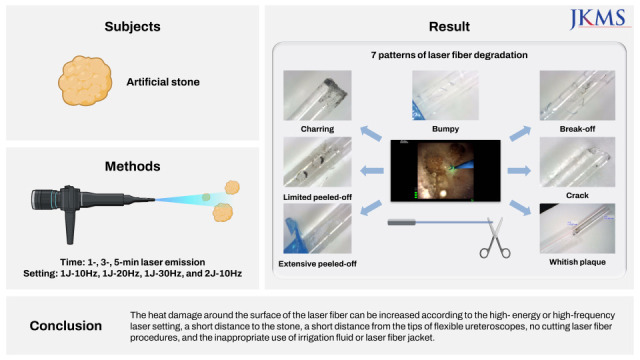
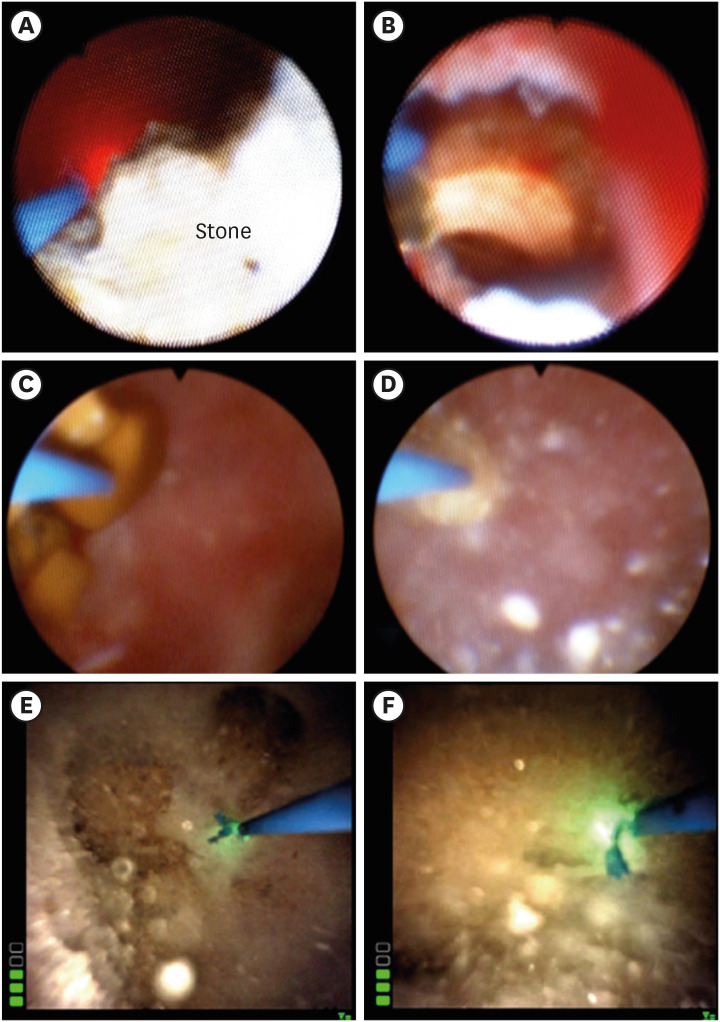
Patterns of laser fiber degradation. Types of laser fiber damages. (A) Charring, (B) Limited peeled off, (C) Extensive peeled off, (D) Bumpy, (E) Bumpy, (F) Crack, (G) Break off.
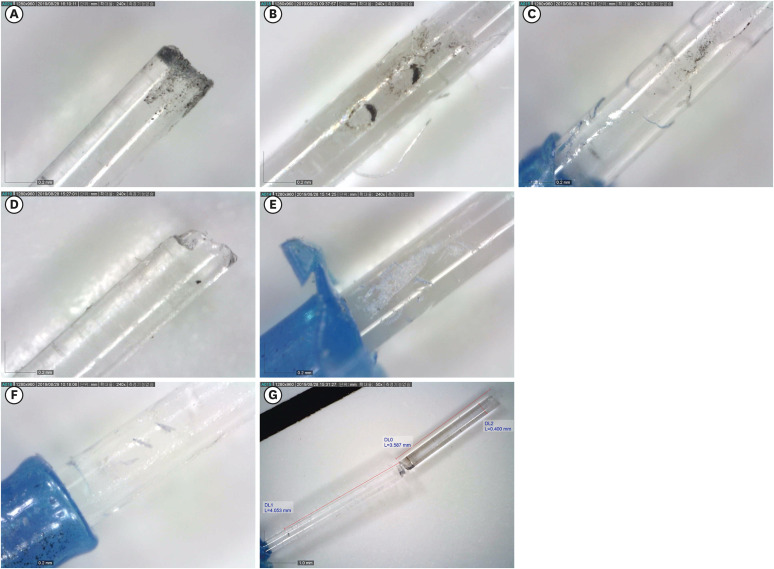
Table 1
Damage pattern distribution according to the time of the laser emission and the laser setting
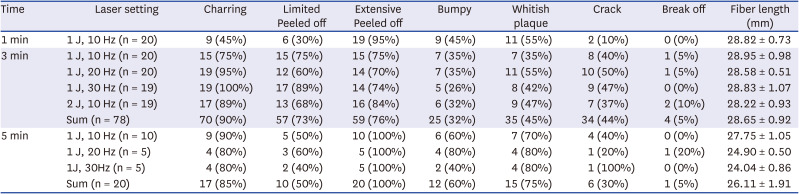
Table 2
Damage pattern distribution according to the caliber

The occurrence rates of 7 types of fiber degradation
Table 3
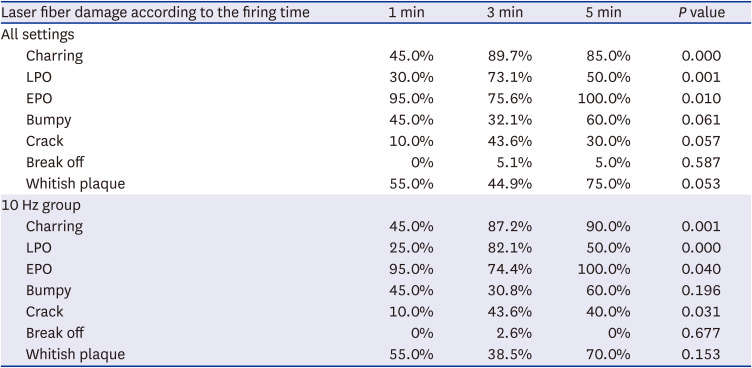
The occurrence rates of 7 types of fiber degradation
The damaged lengths and the cavitation
DISCUSSION
Heat damage of the cavitation bubbles and backward movement at a 1 mm distance from the stone
Coincidence of multiple damages at the fiber surface
Lessons from the analysis of laser fiber damage
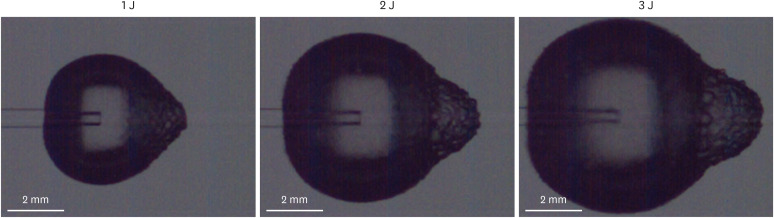
1) Minimum distance of 5 mm: The ideal mean distance from the laser fiber tip to the endoscopy should be at least 5 mm considering the damaged lengths of the remnant laser fibers in group 3minGr (Fig. 4A). It seems to be related to the area of the heated bubbles in Fig. 2.
2) Advancement of the laser fiber first, later cutting: If the 'double-firing phenomenon' is identified, the laser fiber must have cracked with a risk of a break-off. Therefore, the laser fiber should be moved forward longer than 5 mm inside the calyx, or the tip of the laser fiber should be cut. However, cutting the laser fiber is a time-consuming task for surgeons. Therefore, the authors think that forward movement of the laser fiber is more recommendable than the fiber-cutting procedure.
3) Frequent cutting in specific conditions: The laser fiber cannot be advanced longer than 3mm from the tip of the flexible ureteroscope to reach the stone when the laser fiber almost escapes from the stone because of the acute deflection angle. The problems may occur in a lower pole stone with a narrow infundibulopelvic angle (Fig. 4A), stones in a diverticular space (Fig. 4B), or stones in the duplicated kidneys. At this time, surgeons have to cut the laser fiber frequently to prevent the damage of the laser fiber. The laser fiber should be cut at around 3-min continuous laser emission for stone fragmentation, and the length to cut should be 5 mm regardless of the laser setting. In the previous study, the authors recommended 1 or 2 mm proximal level from the black burned part of the blue colored-laser fiber jacket.3
4) > 5 mm distance with damaged fibers: Another essential thing is that we have to advance the laser fiber into the target until we can see the intact proximal part of the laser fiber even the length is already > 5 mm (Fig. 4C-F).
5) Laser setting: No statistically significant differences were identified across the laser setting of 1 J-20 Hz, 1 J-30 Hz, and 2 J-10 Hz at three min of laser emission (P = 0.090). However, 1 J-20 Hz (Fig. 4C and D) showed longer remnant laser fibers than 1J-30Hz or 2J-10Hz at the laser emission of 5minGr (Fig. 4E and F).
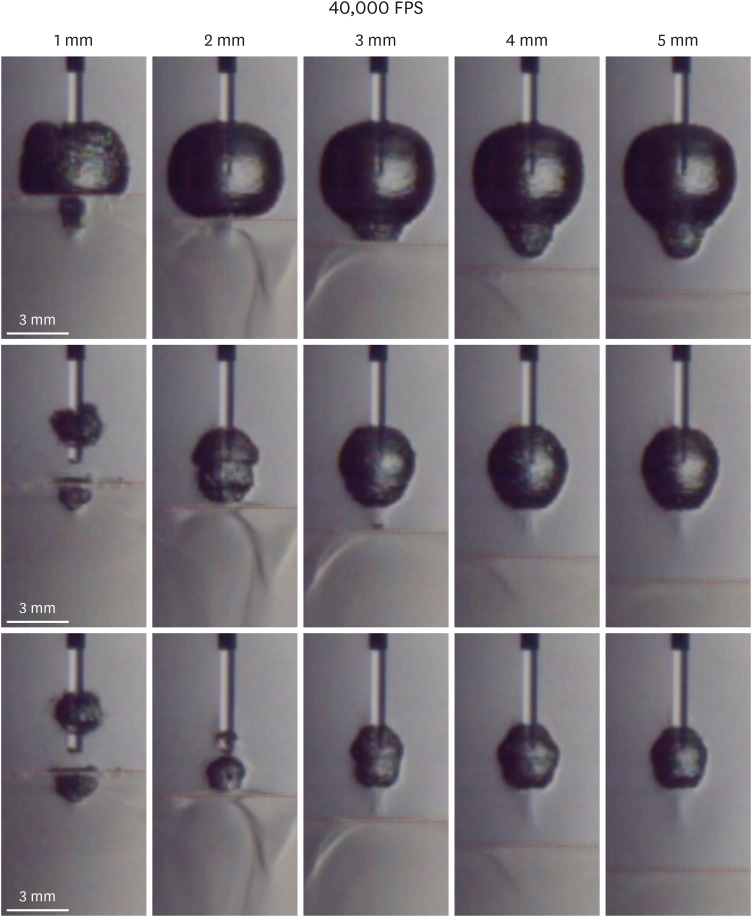
6) Safety distance > 1 mm from the stone: Contact mode or < 1 mm distance of the laser fiber from the stone can induce backward movement of the cavitation bubbles, and the risk of damage may increase. It would be helpful for surgeons to keep in mind that the safety distance is > 1 mm from the stone during the pop-dusting technique. The finding in a previous study2 was partially correct because the bubbles generated by the laser could rebound on the ureterorenoscope camera even when the laser fiber reached a quarter-point of the endoscopic view from the lateral side of the monitor if the fiber is located at the 1 mm distance from the stone. However, it should be noted that at a distance of > 1 mm, the light transmittance starts to drop significantly to 30%, which eventually prolongs the procedure time, which may reduce the stone removal efficiency.
7) The blue-colored fiber jacket should not be stripped off before the stone surgery, although the protective effect of the fiber jacket from peeled-off, whitish plaque, crack, and the break-off has not yet been tested. The presenting authors found that almost all cases of break-off in this study maintained the alignment of the laser fiber inside the blue jacket, and the 'double-firing' signal or black-colored burned part can be important warning signs in preventing the endoscopic damage resulting from the break-off (Fig. 4D, E, and F).
8) The energy from the light cable can deliver additional heat to the water before the endoscopy. Therefore, cool water irrigation with high velocity might be helpful to cool down the water and forward movement of the cavitation bubbles. Warm irrigation fluid should not be used.
Fig. 4
Laser tip during flexible ureteroscopic surgery. The laser fiber cannot be advanced > 3 mm from the tip of the flexible ureteroscope to reach the stone when the laser fiber almost escapes from the stones because of the acute deflection angle in a lower pole (A) or in a diverticular space (B). Change in the lengths of the intact part of the laser fibers are shown before and after pop-dusting techniques for 5 minutes. The laser setting of 1 J-20 Hz (C, D) showed longer remnant laser fibers than 1 J-30 Hz (E, F).

 XML Download