

 PDF
PDF Citation
 Print
Print


INTRODUCTION
The incidence of diabetes mellitus (DM) is increasing worldwide, and it is well known that the blood glucose control rate in diabetes is quite low.123 Among patients with diabetes in the Republic of Korea, the rate of reaching a target HbA1c value of < 6.5% has been determined to be < 30%; moreover, even if a standard of < 7.0% is applied, the rate of reaching the target value is only approximately half.3 This is critically important as poor glycemic control is associated with an increased incidence of complications, and only strict blood glucose control can prevent the occurrence of potentially severe complications.45 For this reason, strict blood glucose control and the prevention of complications are the most basic elements in diabetes management.
The fact that thorough blood glucose control can prevent complications of diabetes has been proven through largescale studies, including the Diabetes Control and Complication Trial and United Kingdom Prospective Study.45 Findings to date demonstrate that the period of exposure to hyperglycemia should be kept to a minimum, as the minimization of exposure to high, uncontrolled glucose levels is associated with a strong reduction in the incidence of diabetes complications. In other words, it is necessary to actively lower patients’ blood glucose levels as quickly as possible following the diagnosis of diabetes and to keep blood glucose at a low state thereafter. In the long term, failure to control blood glucose levels is rare after actively lowering blood glucose levels in the early stage.6
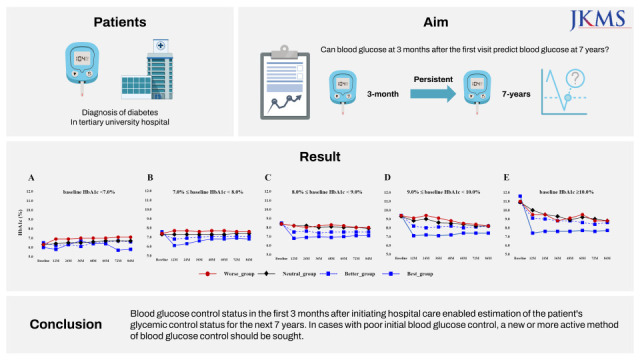
In the Republic of Korea, when a patient is diagnosed with diabetes at a local clinic for the first time or when their blood glucose levels are not well controlled, patients are referred to a tertiary university hospital.7 Early blood glucose control is a critically important component of that first visit. Additionally, tighter active blood glucose management is attempted in tertiary university hospitals than in local clinics.8 Nevertheless, the glycemic control rate in tertiary university hospitals in the Republic of Korea is still low.9 Therefore, this study targeted patients who visited a tertiary university hospital following a diagnosis of diabetes, including for the purpose of blood glucose control. Herein, we investigated the degree to which changes in blood glucose levels during the first 3 months after the initial hospital visit were associated with changes in blood glucose levels over the next 7 years. In addition, we evaluated differences in the occurrence of cardiovascular complications according to blood glucose control status.
METHODS
This study was conducted in patients aged ≥ 18 years who first visited Seoul St. Mary's Hospital following a diabetes diagnosis or who received a diabetes diagnosis at said hospital between January 1, 2009 and June 31, 2013. Type 1 diabetes and gestational diabetes were excluded from the differential diagnosis at this visit. During follow-up, cases categorized as pre-gestational DM were excluded from the final analysis.
Patients included in the study were followed up for 7 years, and cases without sufficient (i.e., 7 year) follow-up were excluded from this study. Changes in HbA1c levels after patients’ first visit to Seoul St. Mary’s Hospital were first evaluated during the initial 3 months of follow-up. After that, blood glucose control status was checked at regular intervals over the course of 7 years. In addition, the incidence rates for stroke and acute coronary syndrome (ACS) during the study period were confirmed on follow-up.
Study population and data extraction
Personal information, such as patients’ date of birth, sex, height, weight, systolic blood pressure, and diastolic blood pressure, was extracted from the medical record database. Blood test data for HbA1c and blood urea nitrogen at the patient’s first visit were extracted as well. The use of insulin injection was checked on routine follow-up, as was the development of hypertension and comorbidities such as ACS and stroke.
In this study, ACS status was defined as patients with an additional diagnosis of ACS according to an International Classification of Diseases, 10th revision (ICD-10) code of I20 to I25 following coronary angiography, percutaneous coronary artery intervention, peripheral angiography, percutaneous transluminal angioplasty, stenting, coronary artery bypass grafting, endovascular repair of an aortic aneurysm, or thoracic endovascular repair of the aorta at the hospital. ICD-10 codes I60-I64 were used for the operational definition of stroke.1011
Study design
After visiting Seoul St. Mary's Hospital, patients were divided into four groups according to the amount of change in HbA1c evident during the first 3 months of follow-up, as follows: Best_group, HbA1c levels decreased by ≥ 1.6%; Better_group, HbA1c levels decreased by 0.5–1.5%; Neutral_group, HbA1c levels were maintained at -0.4%-0.4%; and Worse_group, HbA1c levels increased by ≥ 0.5%. Changes in HbA1c were confirmed for each group for a period of 7 years.
HbA1c levels measured between 6 and 18 months were represented by an average of 12 months (12M) of follow-up (24M, 18–30 months; 36M, 30–42 months; 48M, 42–54 months; 60M, 54–66 months; and 72M, 66–78 months). When HbA1c was measured more than once during each follow-up timeframe, an HbA1c value close to the middle of each section was selected.
Privacy protection
When extracting data required for this research from patients’ electronic medical records (EMR), personally identifiable information (such as the patient’s name) was not included. The data obtained for the study were purified by an endocrinologist through a standardized process of data quality management suitable for research, yielding pseudonymized data that allows for maintaining security.12
Statistical analyses
Values were presented as numbers and percentages for categorical variables and as means and standard deviations for continuous variables; P values were calculated using analysis of variance tests or t-tests for continuous variables and using χ2 tests or Fisher’s exact tests for categorical variables. All statistical analyses were performed using SAS statistical software (version 9.4; SAS Institute Inc., Cary, NC, USA), and P values of < 0.05 were considered the threshold for statistical significance.
RESULTS
Overall, 9,776 patients were included in this study, all of whom were followed up for 7 years (i.e., patients who were not followed for 7 years were excluded from the analysis). At baseline, the mean age of the enrolled participants was 60.1 ± 11.7 years; 94.9% (9,280/9,776) of the enrolled patients were aged > 40 years, and 54.5% (5,329/9,776) were aged > 60 years (Table 1). The mean body mass index was 24.5 ± 3.6 kg/m2, and the mean HbA1c level was 7.4 ± 1.6%. The rate of insulin use after the first hospital visit was 25.9% (2,533/9,776 patients).
Table 1
Baseline characteristics according to HbA1c changes during the first 3 months after a first tertiary university hospital visit
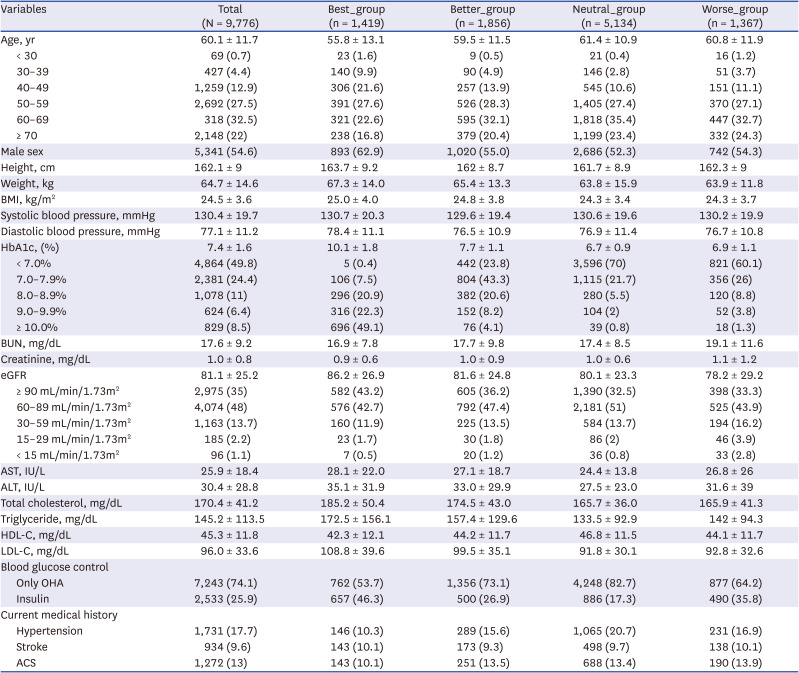
Values are presented as numbers (percentages) for categorical variables and as means ± standard deviation for continuous variables.
A P value was calculated using t-tests for continuous variables and chi-square tests or Fisher’s exact tests for categorical variables.
BMI = body mass index, HbA1c = hemoglobin A1c, BUN = blood urea nitrogen, eGFR = estimated glomerular filtration rate, AST = aspartate aminotransferase, ALT = alanine aminotransaminase, HDL-C = high density lipoprotein cholesterol, LDL-C = low density lipoprotein cholesterol, OHA = oral hypoglycemic agent, ACS = acute coronary syndrome.
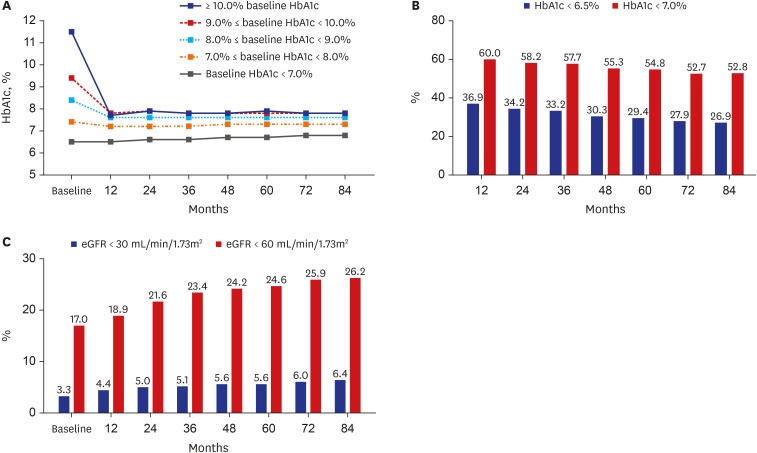
Changes in HbA1c over the course of 7 years were confirmed in comparison to baseline HbA1c levels at the first hospital visit. Regardless of patients’ baseline HbA1c levels, HbA1c was found to decrease most strongly at 12 months and then normally continued to increase or was maintained thereafter (Fig. 1A). Except for patients in the group comprising those with a baseline HbA1c of < 7.0%, HbA1c was found to decrease to 7.2–7.7% at 12 months and then continued to a level not exceeding 8.0% thereafter. However, the rate of reaching a target of < 6.5% HbA1c (which ranged from 36.9% within 12 months to 26.9% within 84 months, P < 0.01) or < 7.0% HbA1c (which ranged from 60.0% within 12 months to 52.8% within 84 months, P < 0.01) continued to decrease over time (Fig. 1B). The rate at which the estimated glomerular filtration rate decreased to < 30 mL/min/1.73m2 (ranging from 3.3% at 12 months to 6.4% at 84 months, P < 0.01) or <60 mL/min/1.73m2 (ranging from 17.0% at 12 months to 26.2% at 84 months, P < 0.01) increased with time (all trends, P < 0.01) (Fig. 1C).
Fig. 1
Changes during 84 months of follow-up in patients with diabetes undergoing treatment at a tertiary university hospital. (A) HbA1c changes according to baseline HbA1c values. (B) Target achievement rates in regard to HbA1c levels. (C) Respective rates of achieving estimated glomerular filtration rates of < 30 mL/min/1.73m2 and < 60 mL/min/1.73m2.
HbA1c = hemoglobin A1c.
Those in the Neutral_group, which showed a change in HbA1c in the −0.4% to +0.4% range during the first 3 months after the first hospital visit, accounted for the largest proportion of the study population (52.5%, 5,134/9,776 patients) (Table 1). Those in the Best_group accounted for 14.5% of the population (1,419/9,776 patients), while those categorized into the Better_group accounted for 19.0% (1,856/9,776 patients). After visiting the hospital, those in the Worse_group (i.e., the patients whose HbA1c levels worsened after the first visit) accounted for 14.1% of the study population (1,376/9,776 patients).
In the case of the Best_group, which showed the greatest hypoglycemic effects during the first 3 months of follow-up, baseline HbA1c levels were the highest of the four groups at 10.1 ± 1.8%. The baseline HbA1c levels in the Neutral_group and Worse_group were 6.7 ± 0.9% and 6.9 ± 1.1%, respectively, and the baseline HbA1c levels showed significant differences between the four groups (all P < 0.001). The rate of insulin use during the first 3 months was the highest in the Best_group (46.3%, 657/1,419 patients), followed by that in the Worse_group (35.8%, 490/1,367 patients), Better_group (26.9%, 500/1,856 patients), and Neutral_group (17.3%, 886/5,134 patients), with significant differences found between each group (all P < 0.001).
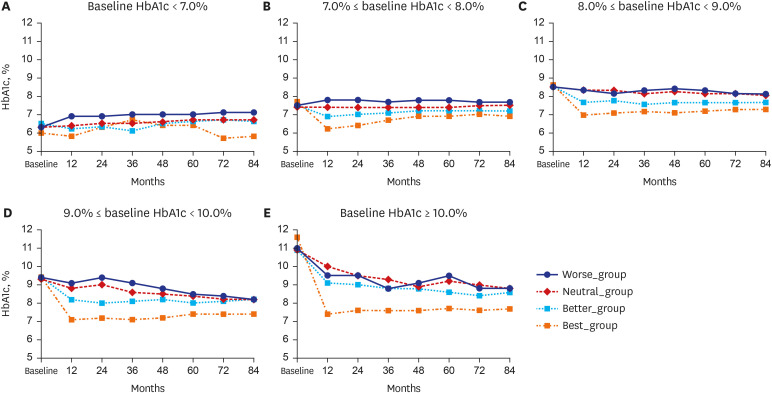
As shown in Fig. 2, patients were subdivided according to their baseline HbA1c levels at their first visit to the tertiary university hospital, following which changes in HbA1c levels over the course of 7 years were evaluated within each subgroup. When the baseline HbA1c level was 7.0–8.0%, the subsequent HbA1c level was the lowest in the Best_group (6.1 ± 0.7% at 12 months), though it continued to increase thereafter. However, in the Worse_group, HbA1c was increased even at 12 months but was then maintained at this slightly higher level for 84 months thereafter. In all groups, HbA1c levels showed significant differences at all time points (P < 0.001). This pattern was also found for other ranges of baseline HbA1c. When the baseline HbA1c level was 9.0–10.0%, the HbA1c level in the Best_group statistically significantly decreased to 7.1 ± 1.2% at 12 months and then increased thereafter. In the Worse_group, both high and low levels of HbA1c were repeatedly detected over time, although HbA1c showed a tendency to decrease overall. However, at each time point, HbA1c levels in the Worse_group were significantly higher than those in the Best_group (all P < 0.001). When HbA1c levels were 8.0–9.0%, 9.0–10.0%, or ≥ 10.0%, the HbA1c levels in the Best_group showed significantly lower results than in the Better_group, Neutral_group, or Worse_group at all time points (all P < 0.001). However, HbA1c levels in the Neutral_group and Worse_group did not show any statistically significant differences over time.
Fig. 2
Changes in HbA1c levels during 84 months of follow-up according to glycemic control status within the first 3 months after visiting a tertiary care hospital: (A) Baseline HbA1c < 7.0%, (B) 7.0% ≤ baseline HbA1c < 8.0%, (C) 8.0% ≤ baseline HbA1c < 9.0%, (D) 9.0% ≤ baseline HbA1c < 10.0%, and (E) ≥ 10.0% baseline HbA1c.
HbA1c = hemoglobin A1c.
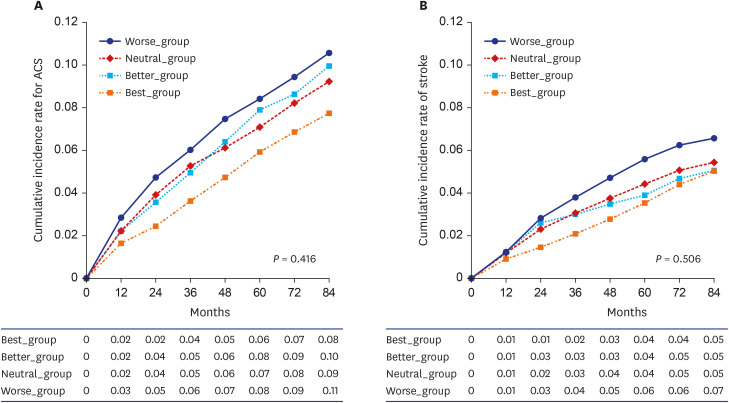
Changes in the cumulative incidence of ACS and stroke over the course of 7 years were evaluated in this study as well (Fig. 3). The cumulative incidence rates for ACS and stroke, which did not show significant trends over time (P = 0.416 and P = 0.506, respectively), were the lowest in the Best_group, whereas the Worse_group showed the highest cumulative incidence rate. However, there were no statistically significant differences between groups. Regarding ACS, the cumulative incidence rate in the Best_group did not show a significant difference in comparison with the Better_group (P = 0.614), Neutral_group (P = 0.222), or Worse_group (P = 0.134). In regard to stroke, the cumulative incidence rate for the Best_group did not show a significant difference in comparison with that of the Better_group (P = 0.404), Neutral_group (P = 0.616), or Worse_group (P = 0.608).
DISCUSSION
The most salient characteristic of this study was the long-term follow-up of patients with diabetes using real world data on patients with diabetes visiting a representative tertiary university hospital in the Republic of Korea. We found that glycemic control within 3 months of the first hospital visit predicted glycemic control over 7 years.
In the Republic of Korea, in the case of DM, transfer to a tertiary university hospital is possible only after receiving a medical treatment request from a local clinic. Although approximately 60% of patients with DM are managed at the local clinic level, the rate of reaching blood glucose goals and implementation rates of complication tests are lower at local clinics than at tertiary university hospitals.8 Active blood sugar management, such as through insulin use, also appears to be more passive in a clinic setting.8 Therefore, most patients transferred to a tertiary university hospital have poor blood sugar control. In addition, some people are diagnosed with diabetes for the first time at a tertiary university hospital through a health checkup. In any case, when first starting blood sugar control at a university hospital, the first 3 months have a large impact on the future disease trajectory. In this study, we found that the efficacy of blood glucose management for 3 months after the first visit to a tertiary university hospital was remarkably consistent with blood glucose control over the next 7 years. In addition, this study showed a deep correlation between glycemic control and the prevention of complications. Moreover, the target achievement rate of an HbA1c value of < 6.5% over the course of 7 years was 26–36%, and the target achievement rate for an HbA1c value of < 7.0% was 52–60%. These rates are quite high when compared with those reported in some other studies,313 though not statistically significantly different from those of previous studies conducted in the Republic of Korea.3
It is well known that early control of DM is important for long-term blood glucose control.6 For example, the CREDIT study (an international multicenter observational study) showed that early insulin treatment improved risk factors for cardiovascular disease and likewise showed favorable results in regard to future blood glucose management.14 This shows that trying to control blood glucose levels as quickly as possible can meaningfully and favorably influence long-term blood glucose management and can prevent the occurrence of DM complications. Of course, due to the characteristics of tertiary university hospitals and characteristics of real-world evidence investigations, the patients in our study were almost certainly not all presenting immediately after an initial diagnosis of DM. Instead, patients may have been newly diagnosed with DM after a first visit to a tertiary university hospital but may have also been diagnosed with diabetes at a local clinic, treated therein, and then subsequently referred to a tertiary university hospital because their glucose levels were not well controlled. The difficulty in distinguishing such patients may be the biggest limitation of this study.
Nevertheless, it is emphasized once again that it is critically important to control blood glucose during the first 3 months after a first medical visit to a tertiary care hospital. In particular, in this study, changes in HbA1c values for 3 months after visiting the tertiary university hospital showed a strong correlation with the amount of change in HbA1c levels over the next 7 years, although many patients were likely referred after failed treatment in clinics. This means that physicians need to break out of this adverse correlation by finding new treatment options for patients with poor glycemic control during the first 3 months under their care.
In this study, although the Best_group showed a higher baseline HbA1c level than the Worse_group, the cumulative incidence of ACS and stroke tended to be lower. Early blood glucose control in DM has an important effect on the development of cardiovascular complications in addition to exerting effects on long-term blood glucose control. If hyperglycemia is not properly managed in the early stages of diabetes, the risks of complications increase even if the patient’s blood glucose is well managed later. For example, ADVANCE is a classic and representative study reporting on the long-term complication benefits of intensive glycemic control in the early stages of diabetes.15 In the ADVANCE study, which compared intensive glycemic control with standard therapy over the course of 5 years, a statistically significant reduction in the incidence of cardiovascular complications was found in the intensive care group. In addition, the combined frequency of microvascular and macrovascular complications was 10% lower in the intensive care group than in the standard therapy group. In the ADVANCE-ON study, which was followed for an additional 5 years, the relative risk of end-stage renal disease was also reduced by an impressive ≥ 46% in the intensive care group.16 Hence, long-term preventive effects in regard to DM complications were impacted for up to 10 years following effective early glycemic control of DM. Moreover, in the EURO HEART study, the risk of stroke or heart attack increased by approximately 10% if the use of the drug was delayed by even 12 months.17 This emphasizes the importance of early blood glucose control in regard to effects on long-term blood glucose control and in the prevention of diabetes complications. After DM complications have already occurred, it is difficult to prevent or to slow their progression even if blood glucose is returned to normal. Therefore, it is necessary to continuously manage blood glucose from the beginning, before complications occur.
The reason that active and aggressive intensive glycemic control in the early stage of diabetes helps to prevent long-term complications can be explained in terms of legacy effects.61819 In other words, our body remembers the high blood glucose state in the early stages of diabetes, such that even if the blood glucose is lowered later, complications progress to the same level as in hyperglycemia. However, achieving strong blood glucose control in the early stages of diabetes can delay or reverse the development and progression of atherosclerosis, ultimately reducing the risk of vascular complications such as kidney or cardiovascular disease. Therefore, to realize DM-related legacy effects in a clinical real-world study, it is necessary to present and evaluate various methods for inducing a strong lowering of blood glucose in a short period of time during initial treatment. More specifically, various programs (i.e., diet and exercise programs) should be implemented, taking advantage of the characteristics of tertiary university hospitals.20
Moreover, in addition to achieving strong glycemic control effects at the beginning of treatment, it is necessary to reproduce these legacy effects in clinical practice such that long-term reductions in cardiovascular complications can be obtained. In this study, it was important to select a patient group providing information relevant to ending adverse legacy effects, and it is important to judge long-term impacts according to the pattern of glycemic control occurring after the first visit to a tertiary university hospital.
In our investigation, it was difficult to prove a causal relationship due to the nature of a retrospective cohort study.2122 In other words, good blood glucose control in the first 3 months may be due to a clinical effect achieved through active treatment by an experienced physician. However, treatment effects may reflect patient characteristics (e.g., some patients are not interested in glycemic control or are not compliant for various reasons). This means that cause and effect may be reversed in such evaluations. Hence, it is possible to interpret our findings as showing that good blood glucose control in the first 3 months leads to good blood glucose control for the next 7 years. Conversely, our results may suggest that patients who have not controlled their blood glucose levels for 7 years may also not have managed to control their blood glucose well at the beginning of the treatment period. However, either way, this study showed a strong correlation between glycemic control in the first 3 months of treatment and glycemic control over the course of 7 years. That is, regardless of the direction of causality, if a patient visits a tertiary university hospital and provides data on their blood glucose control status for the first 3 months of treatment, the patient's status for the next 7 years can also be reliably estimated. This does not imply a causal relationship, but rather implies that future trends can be estimated based on correlation findings.
In this study, we found that the higher the baseline HbA1c, the greater the blood glucose lowering effect in the first 3 months. In other words, the higher the baseline HbA1c level, the more likely the patient was to end up in the group demonstrating an improvement in blood glucose levels. The high baseline HbA1c levels of those categorized into the Best_group in this study may be controversial. However, there was no concern in regard to drawing our study conclusions in the present investigation because the sub-analysis was performed by subdividing according to baseline HbA1c values. Although the baseline HbA1c levels in the Worse_group were statistically significantly higher on average than those in the Neutral_group, nevertheless, in this group with high baseline HbA1c level, glycemic control was much better maintained for 7 years and the incidence of complications was also considerably less. These findings indicate that early glycemic control from the time of the first visit to a tertiary university hospital is critically important. Results can be predicted only according to correlation findings and not necessarily due to a causal relationship.
This study presents with some limitations inherent to the nature of any retrospective cohort study,21 as well as limitations specific to the EMR available for data abstraction. First, it was not possible to distinguish between patients diagnosed with DM for the first time and those who were transferred while receiving treatment at a local clinic, an unevaluated variable that is highly related to DM duration. In general, we could not properly confirm DM duration due to missing data in the EMR. This is the biggest limitation of our study, as this information would certainly have had a great influence on evaluating the occurrence of complications. In addition, various confounding factors that could affect glycemic control or DM complications over the course of 7 years could not be included in the analysis. However, it was judged that there was no statistically significant effect of known factors on changes in blood glucose levels occurring over the 7-year follow-up. A second major limitation of this work was the uncertainty in the operational definition of DM complications.232425 More specifically, the operational definition of a specific disease may vary depending on the purpose of the study. In this study, both treatment codes and ICD-10 classifications were used to increase accuracy.1011 However, there is a still high possibility of underestimation or overestimation given this information alone.2425
The results of this study indicate that if patients’ blood glucose control status is characterized during the first 3 months after their first hospital visit, the patient’s long-term blood glucose management status can be estimated in a real-world setting. Moreover, our study clearly shows that if blood glucose control fails in the early stages after the first evaluation visit, the risk of complications increases. This has previously been proven in real-world settings and represents a major strength of real-world evidence investigations.26 These results reveal a treatment-outcome pattern or phenomenon in patients with DM; an awareness of this pattern will assist physicians to change a patient’s treatment regimen to improve future blood glucose control outcomes. Physicians should consider a relatively stronger treatment regimen for patients with poor blood glucose control than for other patients to lower blood glucose levels. For example, physicians may emphasize or provide additional education regarding more aggressive lifestyle modifications to patients who are expected to have persistent poor blood glucose control. Alternatively, physicians may be more aggressive in trying out strong drug combinations from the time of the patient’s first hospital visits or they may consider insulin injections at an early stage. To prove a clear causal relationship, a large-scale prospective study is needed in the future.
Based on our study’s results, we strongly advise that if a patient presents to a tertiary university hospital for the purpose of diabetes management, including optimal blood glucose control, the patient’s level of glycemic control be identified during the first 3 months of treatment. This will ensure that optimal treatment is administered, especially to patients identified as having poor glycemic control. We suggest more thorough attention and tighter management to treat patients with poor blood glucose control during the initial treatment phase than that required in the standard care of patients with DM.
 XML Download