

 PDF
PDF Citation
 Print
Print


INTRODUCTION
Severe acute respiratory syndrome coronavirus 2 (SARS-CoV-2) is thought to have originated as a parasitic virus in bats, which has evolved to be able to replicate and spread in human cells.1 It is known to use angiotensin-converting enzyme 2 (ACE2) receptor, transmembrane protease serine subtype 2 (TMPRSS2), and Furin proteins as pathways to enter human cells. When the S2 domain of the SARS-CoV-2 spike binds to the ACE2 receptor of a human cell, TMPRSS2 cuts the S2 domain, and the S1 domain of the virus binds to Furin protein to allow entry to human cells. Currently, the binding ability and susceptibility to infection with SARS-CoV-2 depends on the level of expression of the ACE2 receptor.23 In addition, the expression of ACE2 receptor is known to increase with exposure to air pollutants.45
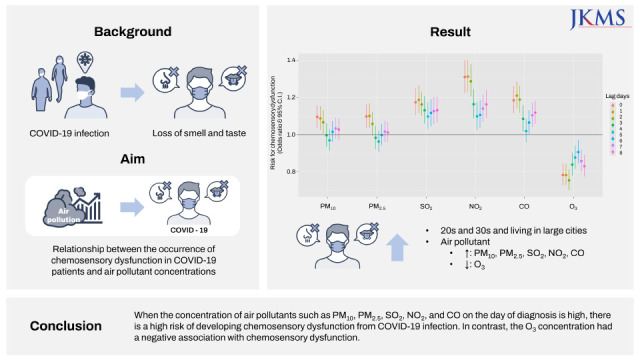
Chemosensory dysfunction has been reported as a characteristic clinical symptom of coronavirus disease 2019 (COVID-19) confirmed patients. These symptoms include anosmia, hyposmia, ageusia, and hypogeusia.67 The mechanism of the olfactory dysfunction caused by COVID-19 infection is not clearly known. One of the most promising hypotheses is a direct inflammation followed by the cytokine storm caused by SARS-CoV-2 infection of ACE2- and TMPRSS2-rich sustentacular cells in small upper nasal non-neuronal cells on olfactory epithelium.2 Gustatory dysfunction is similar to the mechanism of olfactory dysfunction, in which SARS-CoV-2 mainly penetrates the oral epithelium, taste buds, and salivary gland cells and shows high expression of ACE2, TMPRSS2, and Furin, causing inflammation.89 Since SARS-CoV-2 is mostly introduced into the body through the upper respiratory tract, chemosensory dysfunction caused by upper nasal infections mainly occur in the early stages of infection.
According to the previous results the expression of ACE2 and TMPRSS2 receptors, which are pathways for human infection of SARS-CoV-2 and the starting point of chemosensory abnormalities, are increased by exposure to air pollutants such as particulate matter (PM), sulfur dioxide (SO2), and nitrogen dioxide (NO2).1011 These facts lead to the hypothesis that chemosensory dysfunction in COVID-19 may be exacerbated through a neuroinflammatory mechanism promoted by environmental pollutant exposure.
Most of the symptoms of COVID-19 disappear by the time the patients come out of quarantine, but chemosensory symptoms such as loss of smell may persist for up to 1.5–6 months.12 In addition, chemosensory dysfunction can lead to loss of appetite and depression, thereby lowering the patient’s quality of life,13 and it can even lead to life-threatening situations during disasters such as fire or chemical exposure, which require recognition of danger by smell. In particular, since these symptoms are known to occur most frequently among young people with a relatively long life expectancy, measures for prevention and management of these symptoms are essential.1415
This study aimed to evaluate the relationship between short-term exposure to air pollutants and chemosensory dysfunction in COVID-19-confirmed patients.
METHODS
A total of 61,769 COVID-19-confirmed cases were reported through the Korea Disease Control and Prevention Agency from January 20, 2020 to December 31, 2020. Of these, 60,194 cases with residence information were enrolled in this study. Information including the date of diagnosis, residential address (Cities/Gun/Gu units, 227 regions in total), sex, age, and signs of anosmia or dysgeusia were collected from the data of the reported COVID-19 patients. Data on ambient air pollution were provided by the Korea Environment Corporation (https://www.airkorea.or.kr/web/last_amb_hour_data?pMENU_NO=123). We collected the 24-hour mean levels of PM2.5, PM10, ozone (O3), carbon monoxide (CO), NO2, and SO2 for each area (511 measuring station). For regions with two or more measuring stations, the arithmetic mean value of the data from all measuring stations was used. Data from 7 days before the diagnosis of COVID-19 to the date of diagnosis were matched with air pollution data of the patient’s residence (Gu unit) with the symptom data of the patients. Meteorological data such as 24-hour mean temperature and relative humidity was collected from the Korea Meteorological Administration (https://data.kma.go.kr/data/grnd/selectAsosRltmList.do?pgmNo=36). In regions without a measuring station (77 Gu’s), the data of the geographically closest measuring station were used. Regional age-standardized smoking rate and the number of outpatients visits were collected from the Korea Centers for Disease Control and Prevention (https://chs.kdca.go.kr/chs/stats/statsMain.do).
We performed χ2 test and Student’s t-test to evaluate group differences in demographic characteristics. Adjusted odds ratios (ORs) were estimated with 95% confidence intervals (CIs) for the risks associated with as increase in the interquartile rage (IQR) of each air pollutant using binomial logistic regressions for the presence or absence of chemosensory dysfunction in patients with confirmed COVID-19. Due to the lack of individual data, regional average data were used for smoking history and medication usage rates. Therefore, the logistic regression model used age, gender, standardized smoking rate, the number of outpatient visits, 24-hour mean temperature and relative humidity at the regional level as covariates. To examine the short-term effects of air pollution, a lag time of 0 to 7 days from the diagnosis date was evaluated. For statistical analysis, the R-based Rex program (Rex-Pro v3.6.0; Rexsoft, Seoul, Korea) was used, and P < 0.05 was used as the criterion for significance.
RESULTS
Although the first confirmed case of COVID-19 was reported in Korea on January 20, 2020, the first occurrence of chemosensory dysfunction was reported on February 29, 2020. At the beginning of the COVID-19 epidemic, the incidence rate of chemosensory dysfunction was relatively low, but an increasing trend was observed from the end of July.
Of the 60,194 confirmed cases of COVID-19 reported from January to December 2020, a total of 1,917 (3.2%) experienced chemosensory dysfunction. Among these, 1,453 (2.4%) were confirmed as showing symptoms of olfactory dysfunction (anosmia or hyposmia), 1,172 (1.9%) were confirmed as showing gustatory dysfunction (ageusia or hypogeusia), and 721 (1.2%) included both smell and taste disorders.
The patients with chemosensory dysfunction included 895 (46.7%) males and 1,022 females (53.3%), and no statistically significant sex-related difference was observed (P = 0.250). The mean age of the patients showing chemosensory dysfunction was 37.98 ± 16.24 years, which was significantly lower than that in the group without chemosensory dysfunction (46.76 ± 20.62 years, P < 0.001). When the rate of chemosensory dysfunction was analyzed by stratifying patients into age groups with an interval of 10 years, the proportion of symptomatic patients was 6.5% in the patients aged 20–29 years, followed by 5.7% in those aged 30–39 years and 3.9% in those aged 10–19 years. The frequency of chemosensory dysfunction also showed a significant difference according to the place of residence of patients (P < 0.001). In Seoul, 5.0% (956 cases) of all confirmed patients showed chemosensory dysfunction, the highest, followed by Gyeonggi-do and Incheon. In Daegu, where many cases occurred in the early stages of the COVID-19 epidemic, the rate of chemosensory dysfunction was relatively low at 0.5% (Table 1).
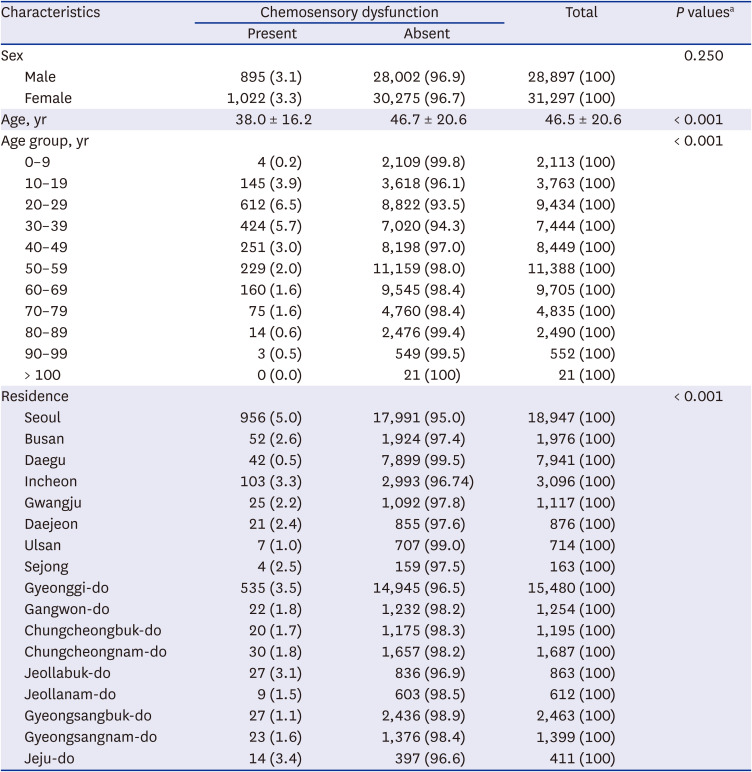
Table 1
Demographic characteristics of study subjects
Values are presented as number (%) or mean ± standard deviation.
aChi-square test or Student’s t-test.
![]()
Air pollution and meteorological data collected during the study period are shown in Table 2. The median concentrations of PM10, PM2.5, SO2, NO2, CO, O3, and daily average temperature and relative humidity were 32.5 μg/m3, 18.5 μg/m3, 3.3 ppb, 21.2 ppb, 0.5 ppm, 19.8 ppb, 5.8°C and 65.2%, respectively. The correlation matrix between air pollutants, air temperature, and relative humidity during the study period is shown in Supplementary Table 1. All correlation coefficients were statistically significant (P < 0.01).
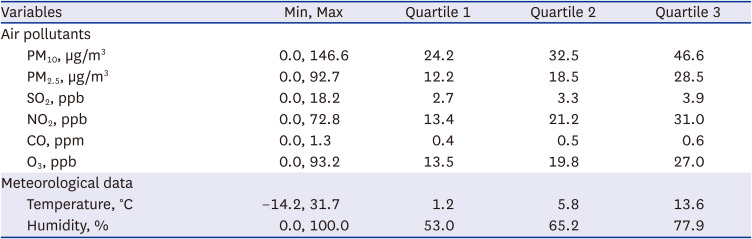
Table 2
Descriptive statistics on environmental variables during the study period
PM10 = fine particulate matter with an aerodynamic diameter of < 10 µm, PM2.5 = fine particulate matter with an aerodynamic diameter of < 2.5 µm, SO2 = sulfur dioxide, NO2 = nitrogen dioxide, CO = carbon monoxide, O3 = ozone, Min = minimum, Max = maximum.
![]()
After setting the lag day from 0 to 7 days based on the confirmed date of COVID-19 diagnosis, a binomial logistic regression analysis was performed for each lag day. In each model, the effect of the concentration of air pollutants in the residence of confirmed COVID-19 patients on the occurrence of chemosensory dysfunction was presented as ORs and 95% CIs per IQR increase in each air pollutant.
The prevalence of chemosensory dysfunction increased 1.10-fold (95% CI, 1.04–1.16) as PM10 concentration increased by 22.4 µg/m3 and by 1.10-fold (95% CI, 1.03–1.16) as PM2.5 increased by 16.3 µg/m3 on the day of diagnosis (Lag 0). For SO2 concentration, an increase of 1.2 ppb led to increase in the occurrence of chemosensory dysfunction of 1.17-fold (95% CI, 1.10–1.25), and an increase of NO2 concentration by 17.6 ppb, increased the number of symptomatic patients 1.31-fold (95% CI, 1.22–1.40). In addition, an increase of 0.2 ppm in the CO concentration on the day of diagnosis increased, led to an increase in occurrence of chemosensory dysfunction of 1.19 times (95% CI: 1.11–1.26). In contrast, as the O3 concentration on the day of diagnosis increased by 13.5 ppb, the occurrence of chemosensory dysfunction decreased 0.78-fold (95% CI, 0.72–0.84).
For PM10 and PM2.5, we found that the concentration up to 2 days before diagnosis of COVID-19 affected the occurrence of chemosensory dysfunction, and the concentration of SO2, NO2, CO and O3 at least 7 days before the diagnosis affected chemosensory dysfunction (Table 3).
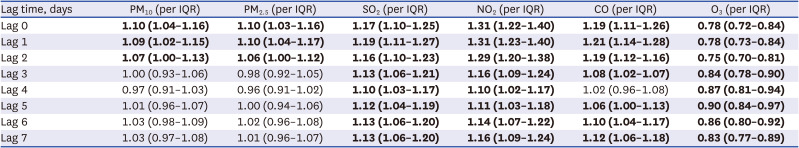
Table 3
The lag effects of air pollutants for chemosensory dysfunction in the binomial logistic regression model by lag time
Values are presented as odds ratio (95% confidence interval).
Bold values indicate statistically significant.
PM10 = fine particulate matter with an aerodynamic diameter of < 10 µm, PM2.5 = fine particulate matter with an aerodynamic diameter of < 2.5 µm, SO2 = sulfur dioxide, NO2 = nitrogen dioxide, CO = carbon monoxide, O3 = ozone, IQR = interquartile rage.
![]()
The effect of air pollutants on the development of chemosensory dysfunction was similar between the sexes (Supplementary Fig. 1). In addition, this effect was slightly greater in the older group than in the younger group (Supplementary Fig. 2).
DISCUSSION
In this study, the air pollution indicators that increase the occurrence of chemosensory dysfunction due to COVID-19 were identified as PM10, PM2.5, SO2, NO2, CO. To date, few studies have reported on the relationship between chemosensory dysfunction caused by SARS-CoV-2 infection and air pollutants. Zhang et al.16 have reported that long-term exposure to increasing concentrations of PM2.5 exposure was associated with anosmia. However, to our knowledge, studies on the relationship between short-term exposure to air pollutants and chemosensory dysfunction in COVID-19 patients have not yet been reported.
The results of the present study show that the PM10 and PM2.5 concentrations up to 2 days before diagnosis had an important effect on chemosensory dysfunction, and of the level of SO2, NO2, and CO at least one week before the diagnosis was related to the chemosensory dysfunction. Unfortunately, it is difficult to explain the reason for this difference in this study.
Unlike the case of other pollutants, it was found that higher O3 concentrations significantly reduced the incidence of chemosensory dysfunction. Although a definite explanation is not clear for this result, a possible reason is that O3 has anti-inflammatory effect. O3 is known to exhibit its strong anti-inflammatory effect by inhibiting nucleotide-binding and oligomerization domain-like receptors protein 3 inflammasome, which plays an important role in the inflammatory response in various diseases.17 In addition, because the activity of ACE2 receptor inhibits by nuclear factor erythroid 2-related factor 2 (Nrf2)18 and O3 induces the rapid activation of Nrf2,19 there is a possibility that increased O3 concentration induced anti-inflammatory effects on olfactory nerves. However, since these mechanisms are derived from the effects of high O3 concentration at the ppm level, further studies are needed on the effects of O3 at atmospheric concentration.
In this study, the rate of occurrence of chemosensory dysfunction was very low in early 2020, when the domestic COVID-19 epidemic began, and it gradually increased toward the latter half of the study. Therefore, Korea recommended that chemosensory dysfunction must be included in the response guideline for preventing the spread of COVID-19 infection at public and multi-purpose facilities after May 11, 2020. There is a possibility that in the previous period, the conditions of patients with COVID-19 infection would not have been investigated for symptoms other than those that the patients voluntarily reported. This may be the reason for the low incidence of chemosensory dysfunction in Daegu city, where there was the first wave of the COVID-19 pandemic occurred from February to March 2020.
Another reason is the changes in the virus epidemic patterns with time. At the beginning of the epidemic, the D614 mutant virus, which had little affinity for the ACE2 receptor, was prevalent, and as time passed, the epidemic of the D614G mutant virus started. Several recent studies have reported that the D614G mutant virus shows a relatively high affinity for ACE2 and increases loss of smell. The number of cases of mutant virus infection has been reported to have increased due to the D614G mutant confirmed case introduced into Korea from Itaewon club or Seoul Sarang Jeil Church from May to June 2020.202122
The proportion of patients with chemosensory dysfunction in this study was 3.2%, which was slightly lower than the proportion of patients with symptoms in other studies. According to the results of a systematic review published by Boscutti et al.,23 the proportion of chemosensory dysfunction among confirmed COVID-19 patients was 0–98%, showing a very wide range of prevalence depending on the study design. The proportion of symptomatic patients is highly likely to vary depending on the race, lifestyle, and environment of the patients. In addition, considering the lack of formal quantitative chemosensory testing, the frequency of prevalence can be also estimated to vary greatly depending on the survey method. Moreover, the data used in this study may have been underreported in comparison with the data for research purposes because they were based on the national reporting system.
Sex-related trends among symptomatic patients have been also reported to differ among studies. While some studies reported that the proportion of symptomatic patients was higher among women,2425 the results of another study showed that the incidence of chemosensory dysfunction is generally higher in men because women are known to have relatively better olfactory function than men.23 In this study, the effects of air pollutants on the development of chemosensory dysfunction was similar between the sexes.
The results on the association between age and chemosensory dysfunction due to air pollution are controversial. Our results showed that the effect of air pollution on chemosensory dysfunction was slightly greater in the older group than in the younger group. Since chemosensory dysfunction declines while susceptibility to air pollution increases with age, our results are consistent with other studies, in which age was a determinant of chemosensory dysfunction.1626 However, the reduced occurrence of chemosensory dysfunction with increasing age has been also reported in some other studies.24252728 Although the exact cause underlying this trend is not yet known, the prevalence or incidence may have been underestimated because the elderly are often unaware of their sensory abnormalities. In addition, the younger the age group, the more time they spend outside, so exposure to air pollutants related to the outbreak of COVID-19 may be relatively high in younger patients. However, further research is needed to confirm this hypothesis.
Our data suggest that, to reduce the prevalence of chemosensory dysfunction due to COVID-19 infection, exposure to pollutants should be minimized by staying indoors and wearing masks in outdoor environments.
This study had some limitations. First, due to the limited secondary data, information for factors such as smoking history and access to medical services that could affect disease occurrence was not available; therefore, regional data was included as a correction variable in the regression model. Second, the exposure amount of air pollutants used in this study is the regional concentration determined using the national measurement network, not the individual exposure concentration. Because each individual has different outdoor activity hours and even those who use the same measurement network data may show differences in exposure depending on the area of residence, it is necessary to evaluate individual exposure for a more accurate relevance assessment.
Nevertheless, this study has the following significance. Many studies to evaluate the relationship between air pollution and disease occurrence have been conducted as ecological studies at the regional level. However, this study has the advantage of overcoming ecological errors by analyzing the effects of air pollutant exposure in 2020 on the chemosensory dysfunction of confirmed COVID-19 patients as individual data. In addition, this is the first study to evaluate the relationship between chemosensory dysfunction and air pollution for all confirmed cases of COVID-19 in Korea in 2020.
To summarize, this study showed that when the concentration of air pollutants such as SO2, NO2, and CO for at least one week is high, there is a high risk of developing chemosensory dysfunction due to COVID-19 infection. This finding underscores the need to actively prevent exposure to air pollution and prevent COVID-19 infection. In addition, policies that regulate activities and products that create high amounts of harmful environmental wastes may help in promoting better health for all during COVID-19 pandemic.
 XML Download