

 PDF
PDF Citation
 Print
Print


INTRODUCTION
Endovascular treatment (EVT) has been the standard therapy for emergent large vessel occlusion since the success of its pivotal clinical trials.1234 The number of EVT procedures is increasing rapidly worldwide.5 To improve outcomes, eligible patients should be transported to EVT-capable hospitals as soon as possible, and a special certification, such as that issued for thrombectomy-capable stroke centers (TSC), may be required to determine where to transport a patient.67 In the United States, a TSC certification program was developed in collaboration between the Joint Commission and the American Heart Association/American Stroke Association. An annual procedural volume requirement of 15 EVT cases per neurointerventionist was a certification prerequisite. Although case volumes of other cardiovascular8910 and cardiac surgical procedures1112 are reported to be associated with clinical outcomes, evidence to document an EVT volume–outcome relationship and to justify the certification volume threshold is limited.1314151617
Several studies have examined the relationship between EVT case volume and three different types of outcomes: in-hospital mortality,141617 30-day mortality,13 and 3-month functional outcome.15 However, these studies do not provide robust evidence to support the cut-off value of the EVT case volume for TSC for the following reasons: 1) the outcome measures of in-hospital mortality141617 and 30-day mortality13 are not standard outcome measures for EVT12318192021; 2) there was no effort to estimate volume threshold1416; 3) the cumulative case volume, not annual case volume, was used to estimate the volume cut-off15; 4) the sample size was small (only 17 centers)15; and 4) the analysis was based on claims data for which identification of stroke cases was not validated.13 A recent study reported volume threshold at 53 cases per hospital for in-hospital mortality and at 31 cases for good discharge dispositions, but stroke severities and onset-to-arrival time were missed in adjusted covariates.17
We accessed data from the Acute Stroke Quality Assessment Program (ASQAP), which is a national audit program on the quality of acute stroke care in South Korea conducted by the Health Insurance Review and Assessment Service (HIRA).2223 Using this database, this study aimed to 1) investigate whether the annual case volume of EVT was associated with clinical outcomes, including 1-year mortality, and 2) evaluate whether the procedural volume threshold of TSC suggested by the Joint Commission was applicable to our clinical settings, provided a non-linear association was found.
METHODS
Study subjects
In 2005, the ASQAP was initiated under the National Health Insurance Act and the Medical Aid Act by the HIRA. After the first audit in 2005, the HIRA repeated the audit in 2008, 2010, 2011, 2013, 2014, and 2016.23 In each audit, the quality of acute stroke care in patients hospitalized due to acute stroke during a 3-month (2005–2014) or 6-month (2016) audit period was evaluated. We analyzed the latest available data collected by the 5th (March to May 2013), 6th (June to August 2014), and 7th (July to December 2016) audits.
The eligibility criteria for the ASQAP were patients with stroke 1) who were admitted through an emergency room within 7 days of symptom onset; 2) whose primary discharge code according to the International Classification of Diseases, Tenth Revision was I60 (subarachnoid hemorrhage), I61 (intracerebral hemorrhage), I62 (non-traumatic subdural hemorrhage), or I63 (ischemic stroke); and 3) who were treated in hospitals that claimed more than 10 acute stroke cases during the audit period. The analysis unit in the present study was a single stroke episode. Admissions to different hospitals were combined into one episode if a patient was treated at two or more hospitals; however, there was no difference or there was one-day difference in the stroke onset date. Among patients included in the ASQAP database, we selected patients with ischemic stroke who were treated with EVT. Patients who were transferred to other hospitals after EVT or whose National Institute of Health Stroke Scale (NIHSS) scores were not available were excluded.
Data collection
The ASQAP data, claims data for reimbursement, and death certificate data were combined and analyzed in this study. The ASQAP data, which were based on information submitted by the participating hospitals, comprised details on the treatment capacities of participating hospitals, patients’ demographics, stroke characteristics, quality indicators, and outcomes. Details of acute stroke management not included in the ASQAP database were extracted from the claims data. Information on EVT was an example. EVT was considered to have been performed when EVT-related claims were issued within 72 hours after admission. The annual EVT case volume was calculated as the total number of EVT procedures performed in a hospital during the total audit period (maximum of 12 months) divided by the number of months during which the hospital was eligible for the audit, and then multiplied by 12. Mortality outcomes of stroke cases were obtained from death certificate data.
Outcomes
The primary outcome measure was the risk-adjusted mortality at 1 year, which was used as a surrogate of the 3-month functional outcome, a standard outcome measure of acute stroke treatment, including EVT.2425 Age, sex, NIHSS score, and onset-to-door time were predetermined as confounding variables for adjustment because their associations with EVT outcomes are well-established.2627282930 Secondary outcomes were mortality at 1 month and 3 months.
Statistical analysis
Categorical variables are presented as frequencies (percentages) and continuous variables as means with standard deviations or medians with interquartile ranges (IQRs). Annual EVT case volume was analyzed both as a continuous variable and as a categorical variable (in quartiles). It was intended that all quartiles should have similar numbers of EVT cases. The association between EVT case volume as a continuous variable and mortality was examined using logistic regression models. Tests for non-linearity and estimation of the volume threshold were performed with restricted cubic splines (RCS) function based on logistic regression. RCS is a way of testing the hypothesis that the relationship is not linear or summarizing a relationship that is too non-linear to be usefully summarized by a linear relationship. The range of values of the independent variable is split up, with “knots” defining the end of one segment and the start of the next. Separate curves are fit to each segment. These knots are positioned at the expected cut-off value. Based on this, if the non-linearity between the independent variable and the outcome is proven, these knots can be considered as cut-off values. Three knots were placed at the 5th, 15th, and 20th percentiles in this study. Baseline characteristics, crude and adjusted mortality, and adjusted odds ratios were reported for each EVT case volume quartile.
In the course of this study, data from the 8th ASQAP (July to December 2018) became available. For sensitivity analysis, we repeated the main analysis using the new data to confirm the non-linearity of the relationship between annual EVT case volume and the unadjusted and adjusted 1-year mortality with re-estimation of the volume threshold.
Statistical analysis was performed using SAS software (version 9.4; SAS Institute Inc., Cary, NC, USA). Two-sided P < 0.05 were considered statistically significant.
Ethics statement
This study was approved by the Institutional Review Board of the Seoul National University Bundang Hospital (No. X-1902-522-902) and has adhered to the Declaration of Helsinki. According to the Act on the Protection of Personal Information Maintained by Public Institutions, the requirement for patient consent was waived, and we were provided with hospital- and patient-level data from which information on personal and hospital identification was removed. The data were kept on a separate server managed by the HIRA, and only pre-authorized researchers could access them remotely.
RESULTS
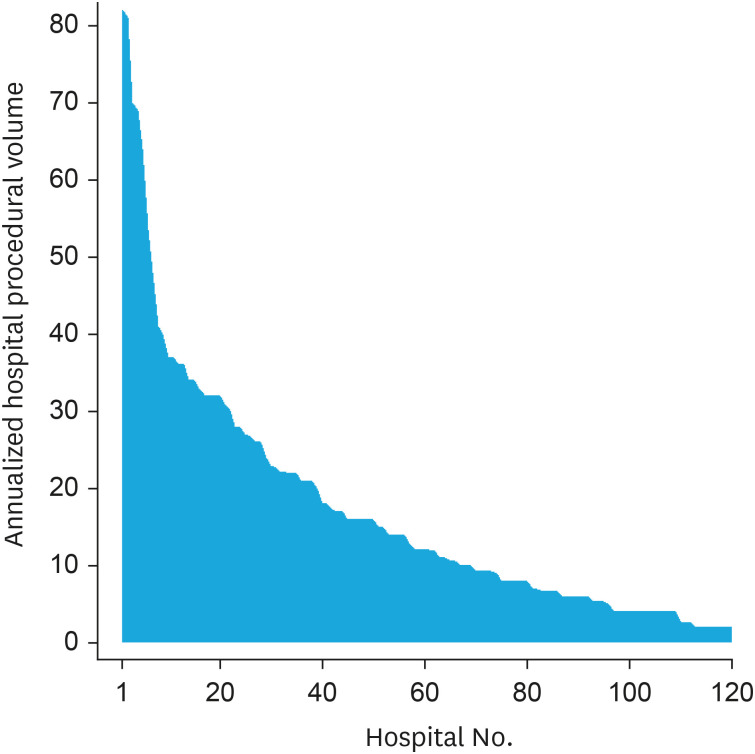
Among 34,644 patients with ischemic stroke enrolled in the 5th–7th audits of the ASQAP, EVT procedures were performed in 1,859 patients (Supplementary Fig. 1). Among them, 1,746 patients who received EVT in 120 hospitals were analyzed in this study after excluding patients treated in non-ASQAP hospitals or whose NIHSS scores were not available. The median annual stroke case volume per hospital was 291, and 55% of the hospitals provided stroke unit care (Table 1). The median annual EVT case volume per hospital was 12 (IQR: 6–23) (Fig. 1). The monthly EVT case volume was less than 1 in 71 hospitals (59.2%), and the annual EVT case volume was less than 15 in 78 hospitals (65.0%). Compared to those in the lowest-volume quartile (Q4), hospitals in the highest-volume quartile (Q1) were more likely to be tertiary hospitals, have stroke units, and be located in urban areas.
Table 1
Baseline characteristics of enrolled hospitals
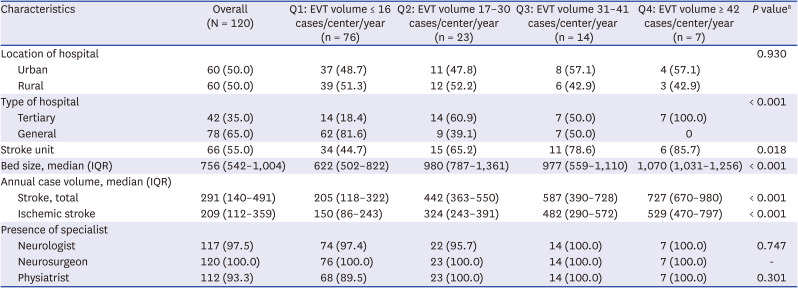
Among the 1,746 patients who received EVT, the mean age was 71 years, men constituted 57% of the sample, and the median NIHSS score was 14 points (Table 2). The median onset-to-door time was 119 minutes, and approximately 45% of the patients had intravenous thrombolysis before EVT. The patients treated in the highest-volume quartile hospitals (Q4) were older (73 vs. 71 years), less likely to be treated with intravenous tPA (37% vs. 48%), and more likely to arrive at hospitals later (median onset-to-door time: 174 vs. 84 minutes) than those treated in the lowest-volume quartile (Q1) hospitals (Table 2). There was no significant difference in sex, initial NIHSS score, and use of ambulance among patients in these quartiles.
Table 2
Baseline characteristics of enrolled patients
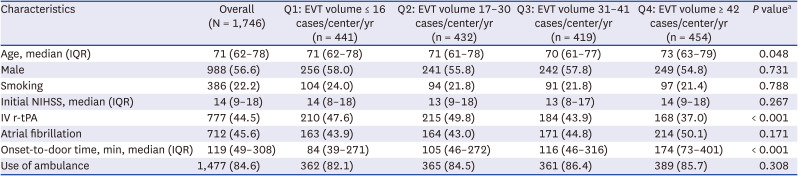
Values are presented as number (%) unless otherwise indicated.
Q = quartile, EVT = endovascular treatment, IQR = interquartile range, NIHSS = National Institute of Health Stroke Scale, IV r-tPA = intravenous recombinant tissue plasminogen activator.
aP value determined by χ2 test or Kruskal-Wallis test.
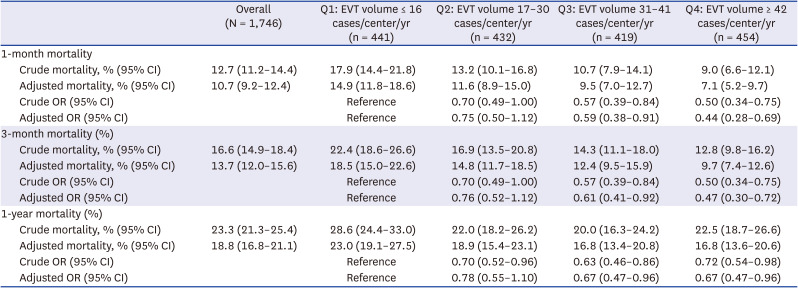
The adjusted 1-month, 3-month, and 1-year mortality rates in the main study population (n= 1,746) were 13%, 17%, and 23%, respectively (Table 3). The crude and adjusted 1-month, 3-month, and 1-year mortality rates differed according to the annual EVT case volume quartiles. The adjusted 1-year mortality rate was higher in the lowest-volume quartile (Q1) than in the higher-volume quartiles (Q2–Q4), although it was similar in the 3rd and 4th quartiles: 23% in Q1 (≤ 16 cases), 19% in Q2 (17–30 cases), 17% in Q3 (31–41 cases), and 17% in Q4 (≥ 42 cases). Non-linearity was suggested. Regarding the crude and adjusted 1-month and 3-month mortality rates, the higher the volume, the lower the mortality rate.
Table 3
Adjusted association between annual EVT case volume and outcomes
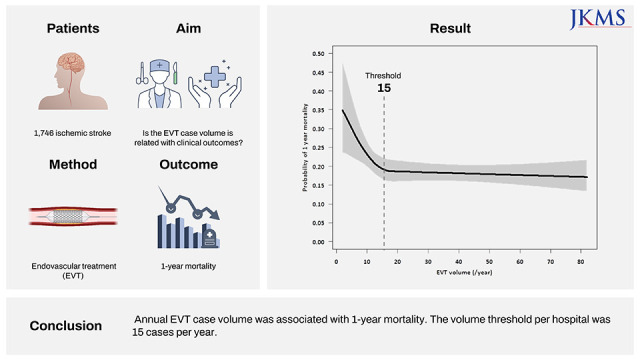
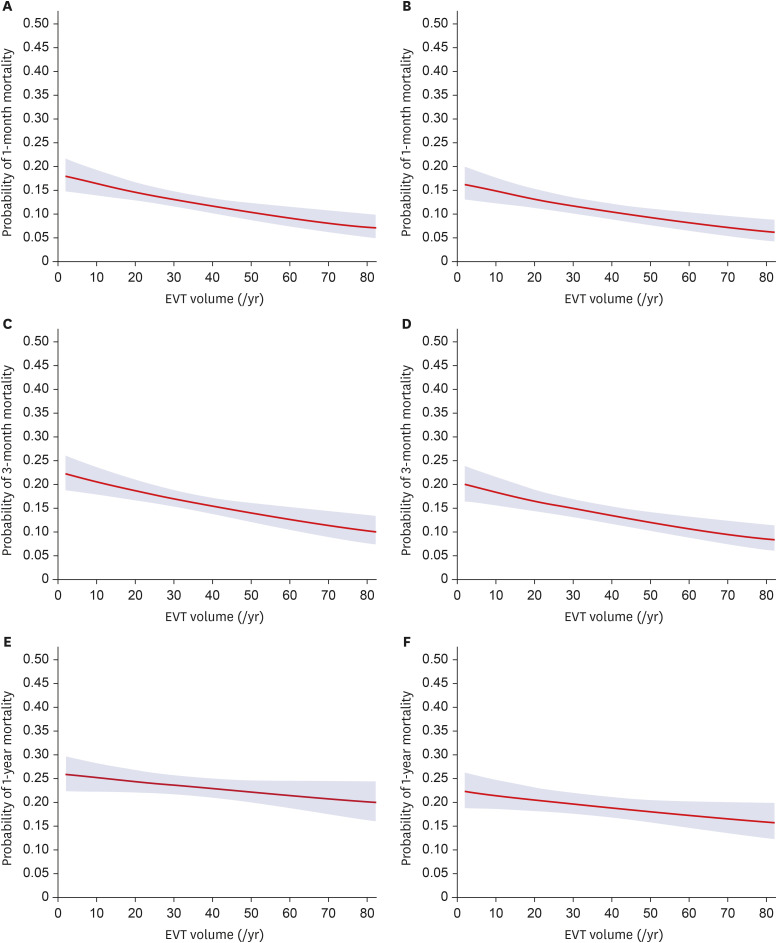
When the annual EVT case volume was considered as a continuous variable, we found a significant non-linear relationship between the adjusted 1-year mortality rate and the annual EVT case volume (P = 0.021 for non-linearity and P < 0.006 for overall effect; Fig. 2). The adjusted 1-year mortality rate declined rapidly as the annual EVT case volume increased to 15 and stabilized beyond this point. Similar patterns were observed for the unadjusted 1-year, 3-month, and 1-month mortality rates. However, significant non-linearity was not observed for the adjusted 1-month and 3-month mortality rate. The overall effect was significant for all the unadjusted and adjusted mortality estimates. In modeling without the non-linear term, a linear relationship between mortality and annual EVT volume was observed for all unadjusted and adjusted mortality estimates, except for the unadjusted 1-year mortality (Fig. 3).
Fig. 2
Predicted probabilities of non-linear effects of annual EVT case volume. Predicted probabilities of non-linear effects of annual EVT case volume on unadjusted and adjusted 1-month (A, P = 0.020 [P < 0.001 for overall effect]; B, P = 0.152 [P < 0.001 for overall effect]), 3-month (C, P = 0.008 [P < 0.001 for overall effect]; D, P = 0.081 [P < 0.001 for overall effect]), and 1-year mortality (E, P < 0.001 [P < 0.001 for overall effect]; F, P = 0.021 [P = 0.006 for overall effect]). Adjusted for age, sex, NIHSS score, and onset-to-door time (min).
EVT = endovascular treatment, NIHSS = National Institute of Health Stroke Scale.
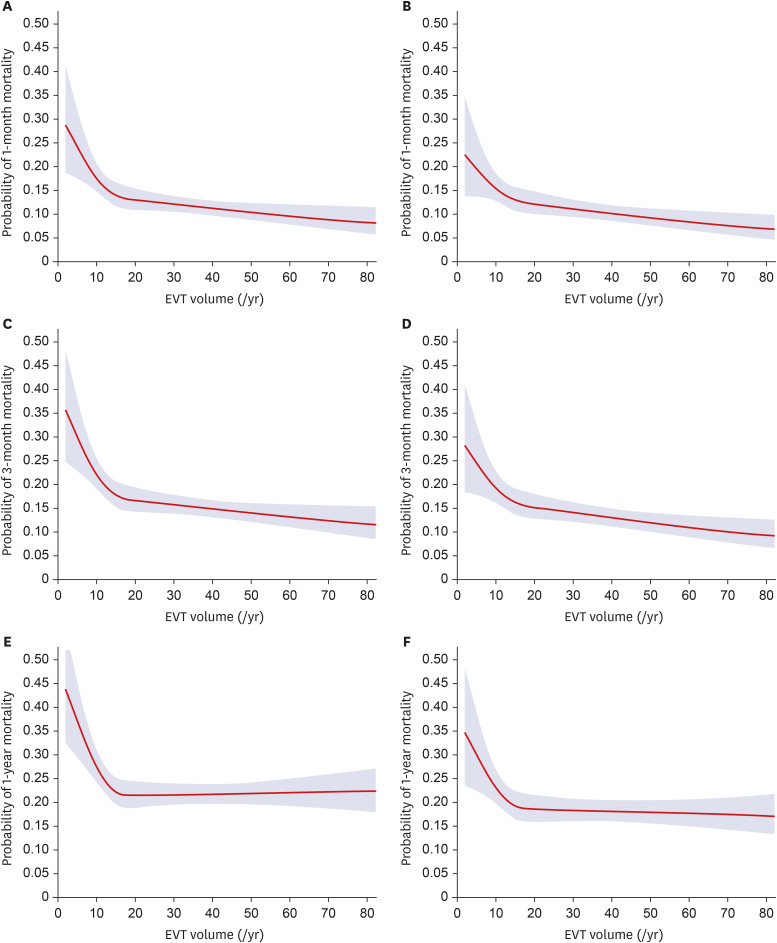
Fig. 3
Predicted probabilities of linear effect of annual EVT case volume. Predicted probabilities of linear effect of annual EVT case volume on unadjusted and adjusted 1-month (A, P < 0.001; B, P < 0.001), 3-month (C, P < 0.001, D, P < 0.001), and 1-year mortality (E, P = 0.102; F, P = 0.041). Adjusted for age, sex, NIHSS score, and onset-to-door time (min).
EVT = endovascular treatment, NIHSS = National Institute of Health Stroke Scale.
Sensitivity analysis based on 1,603 patients treated in 123 hospitals from the 8th audit in 2018 confirmed a significant non-linear relationship between the unadjusted and adjusted 1-year mortality and annual EVT case volume (P = 0.021 and 0.022 for non-linearity and P = 0.010 and 0.001 for overall effect on the unadjusted and adjusted 1-year mortality, respectively; Supplementary Fig. 2). The threshold of the annual EVT case volume was again 15. The median annual EVT case volume in this dataset was 18 (IQR, 8–41). The monthly EVT case volume was < 1 in 41 hospitals (33.3%), and the annual EVT case volume was < 15 in 53 hospitals (43.1%).
DISCUSSION
This study investigated whether the annual case volume of EVT was associated with clinical outcomes and estimated the volume threshold associated with 1-year mortality. We found that hospital EVT case volume is associated with clinical outcomes,131415 the association is non-linear, and the threshold of the annual EVT case volume is 15. The absolute difference in the unadjusted and adjusted 1-year mortality rates between the lowest-volume centers (≤ 16 cases per year) and the highest-volume centers (≥ 42 cases per year) was approximately 6%. The higher-volume centers were more likely to be tertiary hospitals with stroke units in urban areas. The patients treated in the higher-volume centers were more likely to be older and arrive at the hospital later and less likely to be treated with intravenous thrombolysis.
The Joint Commission has proposed a TSC certification program as an intermediate classification between primary and comprehensive stroke centers.31 The TSC certification mandated the capacity to perform EVT 24 hours per day and 7 days per week, availability of equipment for advanced imaging, and a written agreement for transfer with at least one comprehensive stroke center. In the beginning, the Joint Commission required that center must had performed mechanical thrombectomy and post-procedure care for at least 15 patients with ischemic stroke over the past 12 months or 30 over past 24 months. Effective February 1, 2019, the original volume criteria had been applied to the each neurointerventionists.31 Although out results were based on the number of procedures per not neurointerventionist, but hospital, the Committee on Quality Improvement of the Korean Stroke Society has decided to use this cut-off based on our results.
Efforts have been made to provide evidence of the volume-threshold of EVT for the TSC certification requirement, and a related paper has been recently reported.17 In this study, the authors showed that higher hospital EVT case volumes were associated with reduced in-hospital mortality and good outcome, defined by the discharge dispositions including home/self-care, rehabilitation departments, as opposed to death, hospice, and skilled nursing facility. They, also, reported two different volume-thresholds per hospitals for in-hospital mortality and for good outcome. However, they did not include major covariates including NIHSS, onset-to-arrival time, which were well-known to be related with outcome in patients treated with EVT. Also, since the authors used the Medicare database, about 41% of nationwide stroke patients treated with EVT and patients under 65 years had not been covered. Our results were more representative because they are derived from the compulsory adequacy evaluation database including all the acute care hospitals meeting the eligibility criteria. Furthermore, we included NIHSS score and onset-to-arrival time in the analysis as covariates.
Although patients with excellent collaterals are resistant to emergent large vessel occlusion, faster reperfusion is desirable even in these patients. Moreover, a longer duration of ischemia due to delayed treatment might lead to lower recanalization rates.32 In our study, higher-volume centers could achieve better outcomes (irrespective of adjustment for onset-to-door time and other clinical variables) despite greater delay in onset-to-door time, with the median onset-to-door time of 174 minutes in Q4 vs. 84 minutes in Q1. Shorter door-to-treatment time, which was not measured in our study, and better equipment and greater expertise available at higher-volume centers may have contributed to the better outcomes. Inter-hospital transfer delay has been negatively associated with the likelihood of receiving EVT in patients transferred to a tertiary hospital for possible EVT: a 2.5% decrease in the rate of offering treatment has been reported for every minute of delay.33 If regional stroke systems can be reorganized to direct EVT-eligible patients to EVT-capable centers, such as TSCs, as fast as possible, clinical outcomes can improve and stroke-related costs may decrease. Our previous study has shown that moving a patient from a state of moderate to severe disability (3-month modified Rankin scale [mRS] score of 4 or 5 points) to a state of no disability (3-month mRS score of 0 or 1 point) saved more than USD 200,000 over 5 years.34 This type of outcome improvement is frequently achieved by EVT.
As a primary outcome measure, most pivotal EVT trials chose the 3-month mRS score,2335 whereas our study used 1-year mortality. In general, 3-month functional disability affects long-term survival after stroke, and the effect is stronger than that of other well-known prognostic factors.25 A recent analysis of the association between the 3-month mRS score and death/disability at 1 and 5 years after stroke in a population-based cohort study showed that mortality outcomes beyond 1 year could surrogate 3-month disability without much erosion by non-stroke-related deaths,24 which is why we chose 1-year mortality as the primary outcome measure in this study that had no data on 3-month mRS score.
Many studies have reported non-linear associations between procedural case volume and clinical outcomes in other fields, such as percutaneous coronary intervention,3637 coronary artery bypass graft surgery,38 congenital heart disease catheterization,39 and colorectal surgery.40 EVT may follow a similar pattern. Better outcomes can be achieved with a higher case volume, which potentially leads to greater expertise, availability of more advanced equipment and imaging techniques, and better post-procedural care. There is a minimum volume threshold required to establish and maintain these conditions in a hospital, which may explain the non-linearity in the volume–outcome relationship.
The non-linear effect of the annual EVT case volume on mortality was statistically significant for 1-year mortality but not for adjusted 1-month or 3-month mortality. The non-linear relationship between EVT case volume and in-hospital mortality remains controversial.141641 A study with 11,745 EVT cases reported significant non-linearity in the relationship between EVT case volume and 1-month mortality.13 The non-significant results in our study might be explained by our sample size being insufficient to support the modest non-linearity between EVT case volume and 1- and 3-month mortality.
Between 2013 and 2016, 59% of the enrolled hospitals treated fewer than one case per month with EVT, and 65% of the hospitals in South Korea could not meet the minimum volume requirement for a TSC (15 cases per year). These proportions decreased in 2018. Nevertheless, one-third of hospitals performing EVT treat less than one case per month, and more than 40% of the hospitals do not meet the TSC requirement in our study. Furthermore, the annual EVT case volume of 36 has been suggested as a possible new minimum volume requirement for a TSC, based on the argument that EVT should be conducted at high-volume centers with skilled neurointerventionists.4243 Applying this volume requirement to the 2018 audit data, only 35 (28%) of the hospitals in South Korea would remain eligible. The American Heart Association Get With The Guidelines-Stroke data showed that the annual case volume of most EVT-capable hospitals is ≥ 12 in the United States, but most hospitals treat < 36 cases per year.5
This study has some limitations. First, the ASQAP data used in this study were based solely on hospitalized patients with acute stroke treated in acute care hospitals in South Korea, and almost all patients in this study were ethnically Korean. Thus, the present findings may not be generalized to all EVT cases and EVT-performing hospitals outside of Korea. Second, we could not use the 3-month mRS score as a primary outcome measure, but used 1-year mortality instead. One-year mortality has been reported to surrogate 3-month mRS score.24 Third, the dataset used in this study did not allow us to identify other factors that influence EVT outcomes, such as door-to-puncture time, initial imaging parameters, basal collateral status, early neurological deterioration including hemorrhagic transformation, center characteristics that we could not measure, and metrics related to inter-hospital transfer. Therefore, these unmeasured confounders may affect the study results. Fourth, we had no data on the interventionists who performed EVT in the cases studied. Therefore, we could not consider the procedural volume per interventionist and the effects of operator-related factors, such as EVT volume per interventionist and interventionists’ expertise, on clinical outcomes. Fifth, EVT techniques and related clinical practice evolved rapidly,5 particularly between 2014 and 2016 when landmark clinical trials118192021 were published; for example, EVT rates increased during the study period, from 3.6% in 2013 to 6.6% in 2016 (Supplementary Table 1). However, we did not consider these temporal changes in the analysis. Sixth, center characteristics including stroke units, critical care units could affect as confounders. Despite this limitation, the robustness of the present findings is supported by replication of the study results in the sensitivity analysis, based on the 2018 audit data made available in 2020.
In conclusion, the present findings suggest a non-linear association between annual EVT case volume and 1-year mortality, with a volume threshold of 15 cases per year. These results are supporting the current procedural volume requirement for TSC but should be confirmed using the 3-months mRS instead of 1-year mortality as an outcome measure.
 XML Download