

 PDF
PDF Citation
 Print
Print


In the era of coronavirus disease 2019 (COVID-19), surgical smoke (SS) has become one of the major concerns of the safety of surgical teams (ST).1 Regardless of whether SS contains actual severe acute respiratory syndrome-coronavirus-2 particles, to ensure the safety of the ST during surgery on COVID-19 patients, it is important to adopt a proper air ventilation system (AVS) that facilitates the rapid dilution and directional discharge of SS generated on the operating table.2
The AVS of the operating room (OR) can greatly affect SS flow and SS concentrations in the breathing zone (BZ) of the ST.3 However, it is difficult to find studies that presented improvement methods for AVS and evaluated them in terms of SS control efficiency. This is presumably because it has been accepted that making changes in the AVS in the OR is complicated and the methods of directly measuring SS are not suitable.
Therefore, a number of recent studies on SS recommended strategies to reduce the generation of SS along with the use of local evacuation devices and strengthening personal protective equipment rather than methods of improving AVS.4 A few studies have investigated the discharge efficiency of SS between ORs with different AVS schemes and that can indirectly predict SS flow by computational simulation of the OR air flow. However, even those studies had limitations in the interpretation of the results and practical applications because a complex and numerical research methodology was used.
In a previous pilot experiment conducted in our negative-pressure OR designed to generate unidirectional laminar airflow ventilation (UDLV), stagnation and the irregular discharge of SS above the operating table and an air short-circuit from the corridor through the doorway were observed. The findings indicated that proper ventilation was not being achieved in the OR.
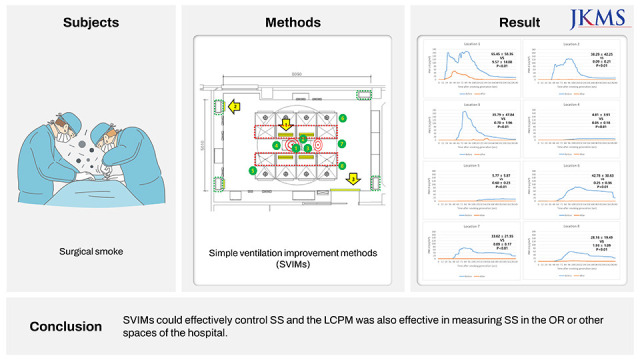
The authors applied simple ventilation improvement methods (SVIMs) to facilitate the dilution and exhausting of SS and a low-cost particulate matter meter (LCPM) for measuring SS in this study based on the information obtained through a preliminary study.
The purpose of this study was to investigate whether SVIMs could effectively control SS and whether an LCPM could support the investigation by effectively measuring SS.
OR Air Conditioning Improvement Methods
The experiment in this study was conducted in a negative-pressure OR. The target negative pressure value was −4.0 Pa or more with 21.9 or more air changes per hour. The air flow in the negative pressure OR is designed to consist of 8 supply diffusers located on the 3 m high ceiling, and the exhaust grills located at each corner with a center height of 0.5 m from the floor.
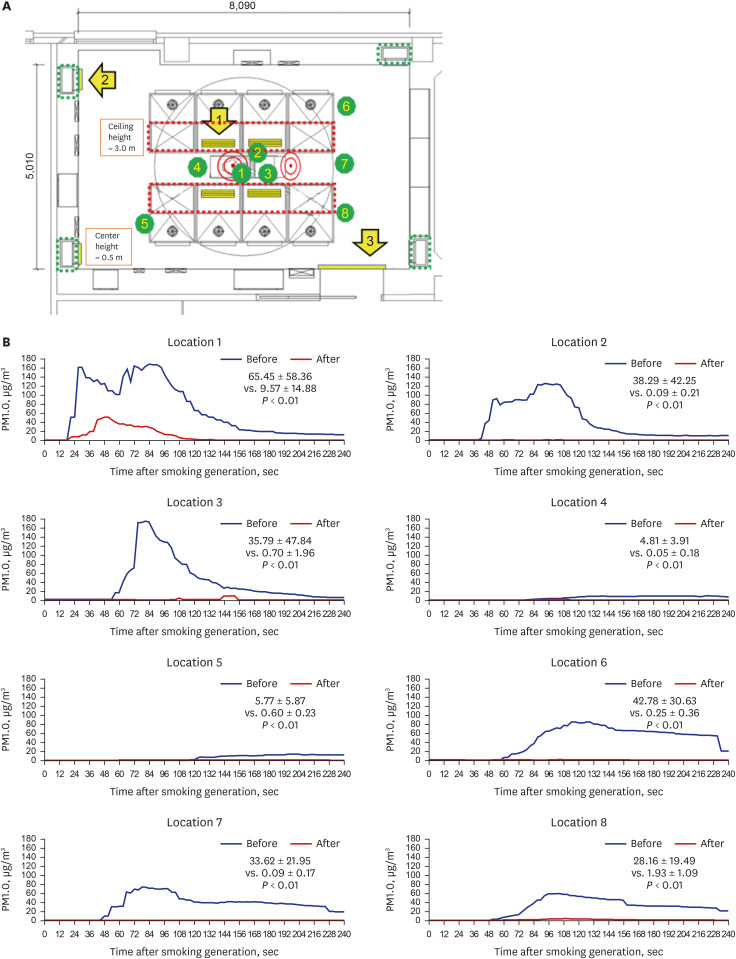
Among the 0.6 × 0.915 m seized 8 existing ceiling perforated-type diffusers, 4 located in the center were replaced with 0.2 × 0.915 m seized louver-type diffusers. The new diffusers were able to increase the air supply velocity from 0.178 to 0.534 m/s and direct the air supply to an area above the operating table. The two exhaust grills on the patient's head side were closed with plastic covers so that SS could only be exhausted through the two exhaust grills on the patient's leg side with increasing air exhausted velocity from 0.497 to 0.994 m/s. To reduce excessive outside air inflow through the upper gap of the doorway, a plastic cover was applied inside the doorway. The effect of reducing the inflow of external air was visually confirmed through a smoke test (Fig. 1).
When the three ventilation improvement methods were applied simultaneously, the effect of diluting the contaminants on the operating table was increased compared to the case where only one or two methods were applied. This was confirmed through the previous smoke test and computational fluid dynamics performed in advance. The reason for selecting and closing the patient’s head side exhaust grills was decided in consideration of the situation in which the SS generated from the operating table could not be easily exhausted toward the patient’s head side direction due to anesthetic barrier tenting placement and other anesthesia equipment.
SS Generation
SS was generated by continuously performing electrocautery for 1 minute with 50 watts of power on the muscle area of a pork block with a size of 18 × 8 × 6 cm placed in the center of the operating table in front of the operator, location 1. SS was made in the same way in all experimental sets including before and after SVIM application. In order to generate SS in the same condition, the carbonized area was cut with a knife.
LCPM Meter
An Oracle indoor air quality monitor LCPM (COBALT, Inc., Daejeon, Korea) was used to measure the particulate matter in SS as an indicator of the concentration of SS. The LCPM was equipped with a PMS5003 sensor and could measure and quantitate particles with a size of < 1.0 μm (PM1.0), < 2.5 μm (PM2.5) and 10.0 μm (PM10.0).5 The LCPM is a 1st grade certified product by the Ministry of Environment. The model name is AC101-PS; relative precision, data acquisition rate, accuracy, and calibration coefficient are all 1st grade. The LCPM was customized to transmit the measurement value to a wired central computer at 3 second intervals according to the user’s request. The calibration process by the manufacturer and the reproducibility and accuracy in the measuring were checked in advance by the research team.
The LCPM uses the light scattering method. In general, particles exhibit various optical properties such as scattering, refraction, reflection, and absorption when exposed to light. When the particles are small, the light is scattered a lot, and when the particles are large, the light is focused in front. So, the laser light shines on the place where the dust passes, and the optical sensor senses the degree of diffraction, refraction, and reflection, counting the size of the number of particles and calculating the concentration.
ST and Location of SS Measurements
The experiment was conducted by the ST using equipment set up for a mock laparotomy with the same conditions as those for conventional open laparotomy. SS concentration was simultaneously measured at 8 locations using 8 LCPMs. After starting the generation of SS, SS concentration data at 3 second interval for 4 minutes were collected. The same experiment was repeated 3 times, and the average value of the 3 data was presented. Eight measurement locations in the order of the ST's interest were determined by discussion. The 8 locations were the BZs of the operator (location 1), the first assistant (location 2), the scrub nurse (location 3), the anesthesiologist (location 4), and the circulation nurse (location 6); and the right corner of the patient’s head side (location 5), the left corner of the patient’s legs side (location 7), and the right corner of the patient’s leg side (location 8). The height of the SS measurements was determined to be between 110 cm and 160 cm in consideration of the height of the actual BZ. The 110 cm high BZ is for the anesthesiologist in a seating position, and the 160 cm high BZ is for the scrub nurse on a 20 cm high step and the first assistant on a 10 cm high step.
After SS was generated, the graphs of the data confirmed that the PM concentrations increased from around the operating table (locations 1, 2, 3, and 4) and gradually spread to the surrounding area (locations 5, 6, 7, and 8). The average PM concentrations were higher in the 3 locations on the patient's leg side than in the 2 locations on the patient’s head side.
After applying SIVMs, a significant decrease in mean PM1.0 concentrations was observed at all 8 locations (Wilcoxon signed-rank test, version 3.0.3; RexSoft Inc., Seoul, Korea), from 65.45 to 9.57 μg/m3 in location 1, from 38.29 to 0.09 μg/m3 in location 2, from 35.79 to 0.70 μg/m3 in location 3, from 4.81 to 0.05 μg/m3 in location 4, from 5.77 to 0.60 μg/m3 in location 5, from 42.78 to 0.25 μg/m3 in location 6, from 33.62 to 0.09 μg/m3 in location 7, and from 28.16 to 1.93 μg/m3 in location 8. At locations 1 and 2 under the surgical lamp, a double-peak pattern was observed before and after applying SIVMs (Fig. 1). The particle concentrations of PM2.5 and PM10.0 zones were similar to PM1.0, so there was no singularity, and only the results of PM1.0, which are theoretically suggested as the risk size for viral transmission, are presented here.
This study was novel in that it showed the decrease in the risk of SS inhalation by the ST after applying SVIMs as a simple visual graph based on data measured by an LCPM over time after SS generation.
The SVIMs were not expensive or complicated, but they were effective in controlling SS. The decrease in the peak PM1.0 concentration and shortening of the time taken to fall to the baseline level at all 8 locations meant that both the dilution and exhausting of SS were improved.
However, SS concentration of the locations of the operator and first assistant below the surgical lamp showed a double-peak pattern even after implementing SVIMs, indicating that there was stagnant or turbulent SS flow. Therefore, studies on additional measures to address and remediate this local congestion are needed.6 The position of the anesthesiologist and the right of the patient’s head side showed relatively low concentrations of SS both before and after implementing SVIMs.
Many hospitals have adopted UDLV, in which clean air is supplied through a HEPA filter from ceiling diffusers.7 However, there are problems with air turbulence and stagnation, as in our hospital.8 Even though a previous study reported that the exposure of the operator to SS was reduced in a displacement ventilation (DV) system having an upward flow type compared to UDLV, it violates the basic airflow principle that fresh air must pass through the medical staff and be discharged through the contaminated areas.9 Additionally, changing the AVS scheme from UDLA to DV requires complicated construction.
Computational fluid dynamics is a commonly used method to analyze the airflow in the OR.10 However, the results may vary depending upon the experience and expertise of the person performing the simulation, and there is a limit to interpreting the results according to the knowledge level of fluid dynamics of the ST. An LCPM can measure SS directly by practically reflecting the spatial conditions in multiple locations at the same time in the OR. In addition, the quantified results can be interpreted relatively easily by the ST.
The laser light scattering sensor used was cost-effective in measuring SS. Because of its small size, it is expected that this study can be extended and utilized to study SS measurements in a sufficiently large number of locations to represent the entire OR space. The non-inferiority of this sensor has been shown by several studies, but it is necessary to accumulate data that can guarantee the public's trust in the accuracy and precision of the laser scattering method for measuring SS.11 In addition, since the correction factor by gravimetric method was not applied to the light scattering method, it cannot be used as a toxicity test.
The limitation of this study was that it did not evaluate how the SVIMs affected locations other than the 8 measured locations, and the possibility that the increased air velocity might adversely affect the surgical wound or the comfort of the ST cannot be excluded. There is a limit to the simple application of SVIMs because the air conditioning system adopted by each hospital is different, and the location and amount of SS differ for each operation.
The methodology used in this study can be improved by diversifying the way of generating particles and sufficiently increasing the number of small-sized LCPMs that can transmit wireless data. The improved methodology simulates in various spaces in the hospital where negative pressure and a closed ventilation system are applied, such as isolation rooms, intensive care units, X-ray rooms and endoscopic room. Subsequently, a multidisciplinary collaborative study in which data scientists and fluid mechanics experts participate should be conducted. Such collaborative research is expected to produce interesting results with the development of computing power and artificial intelligence technology.
 XML Download