

 PDF
PDF Citation
 Print
Print


INTRODUCTION
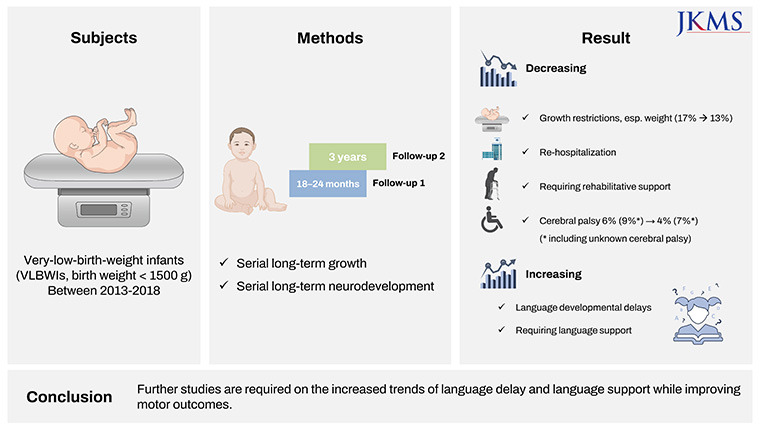
Recently, the survival rate of very-low-birth-weight infants (VLBWIs; birth weight < 1,500 g) has markedly improved because of advanced maternal care, such as antenatal steroid therapy,1 and advanced neonatal care, such as surfactant therapy2 and infection control. Naturally, VLBWIs who are at great risk for the development of long-term growth and neurodevelopmental impairments that require early intervention have been an emerging burden for child health systems. Additionally, infants with neurodevelopmental impairments survive through childhood and into adulthood; therefore, it is not purely an impairment of childhood.
Cerebral palsy, the most common motor disability in childhood, is a disorder of movement and posture with activity limitations caused by non-progressive disorders in the developing brain of the fetus or infant. The overall prevalence of cerebral palsy is 1–4 per 1,000 live births and recently, it was reported to be 2.1 per 1,000 live births in Canada.3 Further, infants with cerebral palsy are often accompanied by other disturbances such as communication, cognition, learning, or intellectual problems. The risk of cerebral palsy increases with decreasing gestational age (GA).4 The incidence of cerebral palsy was approximately 10% in preterm infants with a GA of < 27 weeks in Sweden. Among the cases, 76% were accompanied by other disturbances, and more than half of them had severe disabilities.5 The incidence of cerebral palsy in VLBWIs at 18–24 months of corrected age (CA) born in 2013 and 2014 was 6.6%6 and 6.2%,7 respectively, according to the annual report of the Korean Neonatal Network (KNN). VLBWIs are also predisposed to neurosensory disabilities such as hearing loss requiring cochlear implants or hearing aids,8 or any degree of blindness,9 and postnatal growth failure, namely, extrauterine growth restriction10 as well as motor disability.
The KNN, a nationwide prospective cohort, was established in 2013 to achieve improved neonatal care and to achieve improved survival and long-term outcomes of VLBWIs in Korea. Over 80% of VLBWIs born in Korea are registered in the KNN, and up to 87% are registered in 2020.11 To the best of our knowledge, this is the first report to evaluate the overall long-term growth and neurodevelopmental outcomes of VLBWIs in Korea since the establishment of KNN. We aimed to evaluate the long-term growth and neurodevelopmental outcomes of VLBWIs born between 2013 and 2018, both at 18–24 months of CA and three years of age using a nationwide large cohort, and to examine whether these outcomes have improved over time from 2013 to 2018.
METHODS
This study used data from the annual reports of the KNN from 2015 to 2020 (born between 2013 and 2018) for 18–24 months of CA (follow-up 1) and between 2016 and 2020 (born between 2013 and 2017) for three years of age (follow-up 2).6711121314 Follow-up 1 data were collected from 10,065 eligible VLBWIs born between January 1, 2013, and December 31, 2018. Follow-up 2 data were collected from 8,156 eligible VLBWIs born between January 1, 2013, and December 31, 2017.
The definition of each variable was based on the manual of operations of KNN. Neurodevelopmental outcomes include blindness; hearing loss requiring cochlear implants or hearing aids; and cerebral palsy, defined as Gross Motor Functional Classification System levels ≥ 2.15 Cerebral palsy includes diplegia, hemiplegia, or quadriplegia. We also analyzed individuals with ‘unknown’ cerebral palsy who were unknown having cerebral palsy. A mental developmental index (MDI) < 70 or a psychomotor developmental index (PDI) < 70 on the Bayley Scales of Infant Development Second Edition (BSID II), or cognitive, language, or motor scores < 70 on the BSID III, were analyzed. ‘Further evaluation needed’ of gross motor, fine motor, cognition, or language domains of the Korean Developmental Screening Test for Infants and Children (K-DST) was also evaluated.16 The growth outcomes included weight, height, and head circumference < 5th percentile according to the 2006 World Health Organization (WHO) Child Growth Standards.17 The mortality rate at follow-up 1 was defined as the rate of death between discharge from the neonatal intensive care unit (NICU) and follow-up 1. The mortality rate at follow-up 2 was defined as the rate of death between follow-ups 1 and 2.
Statistical analysis
The overall mortality rate was analyzed based on eligible registrants (data from 10,065 registrants at follow-up 1; 8,156 registrants at follow-up 2). Treatment, growth, and developmental variables were calculated among infants who were followed up. GA and birth weight were also calculated for the infants who were followed up. Continuous variables were compared using the t-test or Mann-Whitney U test, and categorical variables were compared using the χ2 test or Fisher’s exact test, as appropriate. The Cochran-Armitage test was conducted for trend analysis. The R software (version 3.6.3; R Foundation for Statistical Computing, Vienna, Austria) was used to perform statistical analyses. Statistical significance was set at a P value of < 0.05.
Ethics statement
With the review and approval of the Institutional Review Board of each participating center including the Inha University Hospital (IRB No. 2016-03-006), data were collected during admission and follow-up. This study was reviewed and approved by the KNN ethics committee. Written informed consent was obtained from the parents of the registrants upon enrollment in the KNN registry.
RESULTS
Long-term outcomes at 18–24 months of CA according to GA
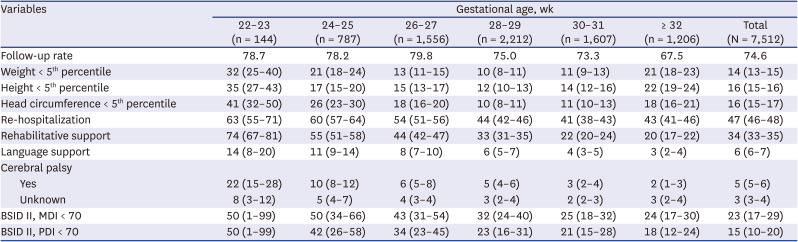
The overall follow-up rate of infants born between 2013 and 2018 at follow-up 1 was 74.6% (7,512/10,065) (Table 1). The follow-up rate increased with decreasing GA and was the highest at 78.7% in infants with a GA of 22–23 weeks. The rate of growth restriction was decreased with increasing GA. However, the rate of growth restriction was increased again in infants with GA of ≥ 32 weeks. Approximately half of the VLBWIs (47%) were re-hospitalized at least once between discharge from the NICU and follow-up 1. The younger the GA, the more re-hospitalization occurred. Among the infants, 34% required rehabilitative support and 6% required language support. More infants required rehabilitative support and language support with decreasing GA, as expected. The overall incidence of cerebral palsy at 18–24 months of CA in VLBWIs born between 2013 and 2018 was 5%. The incidence of ‘unknown’ cerebral palsy was 3%. The incidence of cerebral palsy was highest at 22% in infants with a GA of 22–23 weeks, which decreased abruptly to 10% in infants with a GA of 24–25 weeks, and finally to 2% in infants with a GA of ≥ 32 weeks. About half of the infants with GA of 22–23 weeks had a mental developmental delay with MDI < 70 on the BSID II, and motor developmental delay with PDI < 70 on the BSID II.
Table 1
Long-term outcomes at 18–24 months of corrected age according to gestational age
Long-term outcomes at 18–24 months of CA according to era
The overall mortality rate between discharge from the NICU and follow-up 1 was 1% (104/10,065) (Table 2). Growth restriction decreased over time, and weight growth restriction decreased from 17% in infants born in 2013–2014 to 13% in infants born in 2017–2018. Contrary to the decreased rate of re-hospitalization and rehabilitative support according to era, more infants required language support according to era. Further, infants with language developmental delay based on a language score < 70 on the BSID III or ‘further evaluation needed’ of the language domain of K-DST were increased according to era. The overall rates of blindness and hearing loss at follow-up 1 were 0.4% (29/7,512) and 2% (149/7,512), respectively. Among the infants, 92.8% (6,969/7,512) and 87.7% (6,591/7,512) were able to sit alone and walk independently at follow-up 1, respectively. The incidence of cerebral palsy at 18–24 months of CA has significantly decreased over time, from 6% in 2013–2014 to 5% in 2015–2016, and finally to 4% in 2017–2018 (Table 2, Fig. 1).
Table 2
Long-term outcomes at 18–24 months of corrected age according to era (N = 7,512)
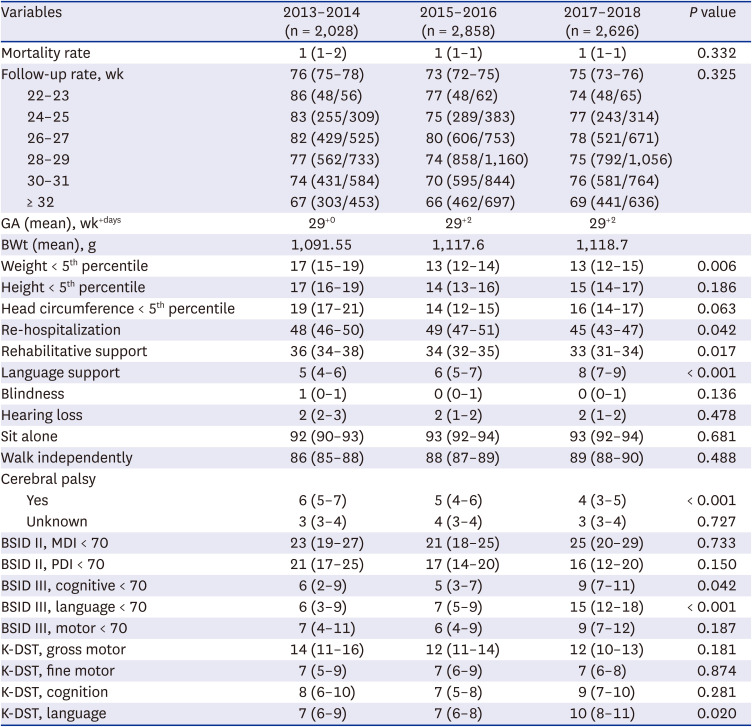
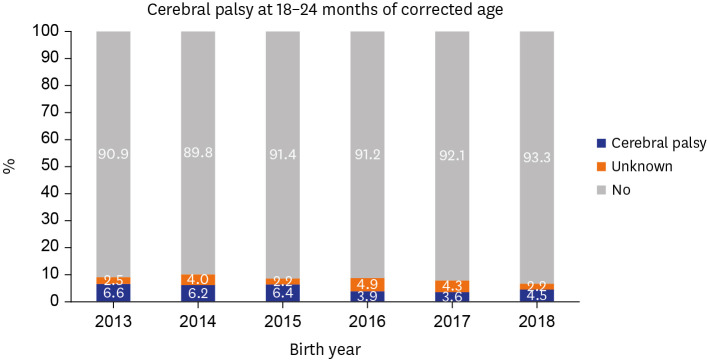
Fig. 1
Cerebral palsy at 18–24 months of corrected age according to birth year. The incidence of cerebral palsy at 18–24 months of corrected age has significantly decreased over time from 6.6% in infants born in 2013 to 4.5% in 2018. The follow-up rates of infants at 18–24 months of corrected age were 76%, 73%, and 75% in infants born in 2013–2014, 2015–2016, and 2017–2018, respectively. Blue bar, the rate of infants with cerebral palsy; orange bar, the rate of infants with ‘unknown’ cerebral palsy; and gray bar, the rate of infants without cerebral palsy.
Long-term outcomes at three years of age according to GA
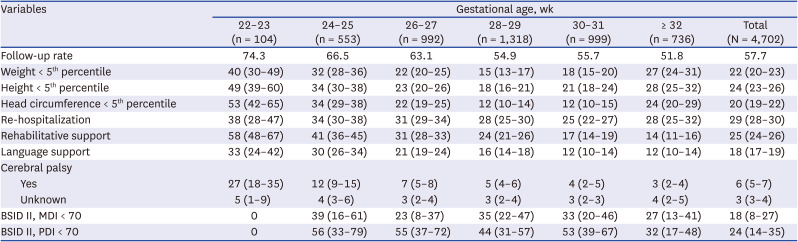
The overall follow-up rate of infants born between 2013 and 2017 at follow-up 2 was 57.7% (4,702/8,156) (Table 3). More infants were followed up with decreasing GA. The follow-up rate was highest at 74.3% in infants with a GA of 22–23 weeks. Only half of the infants (51.8%) with a GA ≥ 32 weeks were followed up at three years of age. Growth restriction improved with increasing GA, and the rate increased again in infants with GA ≥ 32 weeks. Approximately 29% of VLBWIs were re-hospitalized at least once between follow-ups 1 and 2. A quarter of the VLBWIs (25%) required rehabilitative support. More infants required rehabilitative support with decreasing GA. Among the infants, 58% with a GA of 22–23 weeks and 14% with a GA ≥ 32 weeks required rehabilitative support. Among the infants, 18% needed language support, which decreased with increasing GA. The overall incidence of cerebral palsy at three years of age in VLBWIs born between 2013 and 2017 was 6%. The incidence of ‘unknown’ cerebral palsy was 3%. The incidence of cerebral palsy in infants was highest at 27% at GA of 22–23 weeks, which decreased abruptly to 12% at GA of 24–25 weeks, and finally to 3% at GA ≥ 32 weeks.
Table 3
Long-term outcomes at three years of age according to gestational age
Long-term outcomes at three years of age according to era
The overall mortality rate between follow-ups 1 and 2 was 0.049% (4/8,156) (Table 4). The follow-up rate at follow-up 2 increased over time from 55% in infants born in 2013–14 to 62% in 2017. The growth restriction rate tended to decrease according to era. More infants required rehabilitative and language support according to era. Furthermore, infants with language developmental delays based on ‘further evaluation needed’ of the language domain of K-DST were increased according to era. The overall rate of blindness was 0.5% (23/4,702). Among the VLBWIs, 1.8% (85/4,702) required cochlear implants or hearing aids because of hearing loss at three years of age. Among the infants, 93.6% (4,402/4,702) and 91.6% (4,305/4,702) could sit alone and walk independently at three years of age, respectively. The incidence of cerebral palsy at three years of age has decreased serially from 8% in infants born in 2013–2014 to 7% in 2015–2016, and finally to 5% in 2017 (Table 4, Fig. 2).
Table 4
Long-term outcomes at three years of age according to era (N = 4,702)
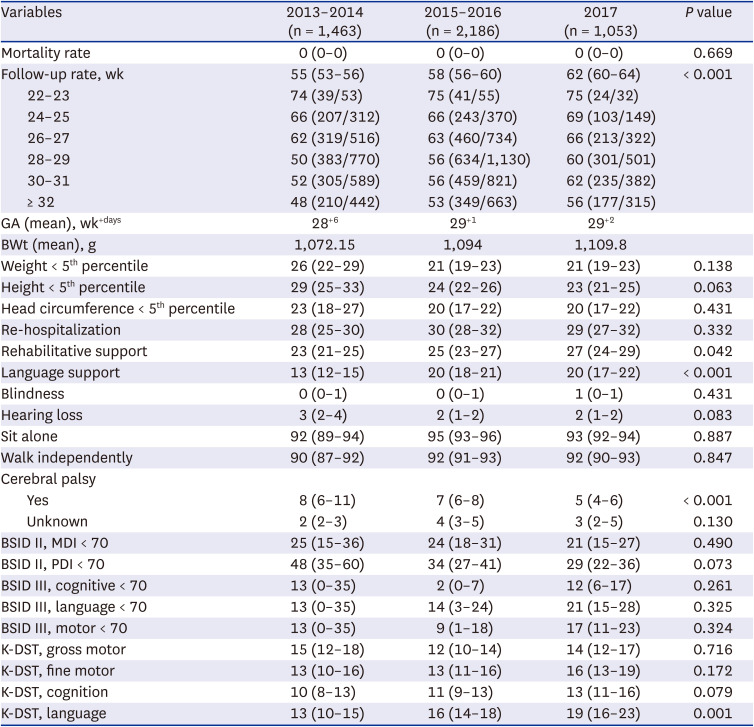
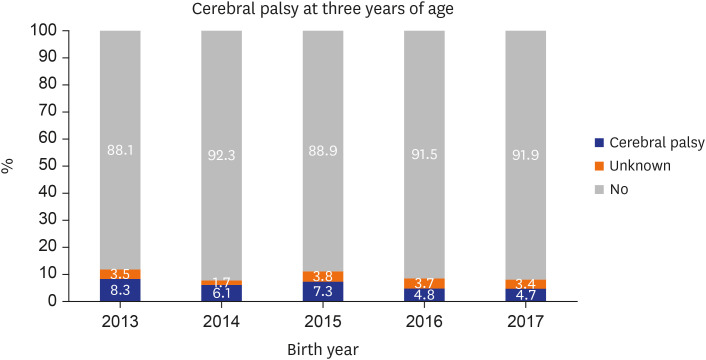
Fig. 2
Cerebral palsy at three years of age according to birth year. The incidence of cerebral palsy at three years of age has significantly decreased over time from 8.3% in infants born in 2013 to 4.7% in 2017. The follow-up rates of infants at three years of age were 55%, 58%, and 62% in infants born in 2013–2014, 2015–2016, and 2017, respectively. Blue bar, the rate of infants with cerebral palsy; orange bar, the rate of infants with ‘unknown’ cerebral palsy; and gray bar, the rate of infants without cerebral palsy.
DISCUSSION
In the present study, we demonstrated that VLBWIs with cerebral palsy decreased serially according to era, both at 18–24 months of CA and at three years of age. Growth-restricted infants, especially those with weight growth restriction at 18–24 months of CA, have decreased in recent years. Re-hospitalization between discharge from the NICU and 18–24 months of CA and rehabilitative support at 18–24 months of CA decreased according to era. However, more VLBWIs required language support according to the period, both at 18–24 months of CA and three years of age. In particular, the rate of VLBWIs requiring language support was more than twice as high as at three years of age compared with those at 18–24 months of CA.
In the present study, 5% and 6% of VLBWIs were diagnosed with cerebral palsy at 18–24 months of CA and at three years of age, respectively. ‘Unknown’ cerebral palsy was 3% both at 18–24 months of CA and at three years of age. In the present study, at 18–24 months of CA, 22%, 10%, and 6% of infants with GA of 22–23, 24–25, and 26–27 weeks, respectively, were diagnosed as having cerebral palsy. At three years of age, 27%, 12%, and 7% of infants with GA of 22–23, 24–25, and 26–27 weeks, respectively, were diagnosed as having cerebral palsy. In Japan, at three years of age, the rates of cerebral palsy were 22.4%, 22.0%, 15.1%, and 14.3% in infants with a GA of 22, 23, 24, and 25 weeks born between 2003 and 2012, respectively, which were 11.2%, 10.7%, and 8.6% in infants with a GA of 26, 27, and 28 weeks, respectively, by the Neonatal Research Network of Japan (NRNJ). 18 Further, 7.1% of VLBWIs born between 2003 and 2012 were found to have cerebral palsy, and the rates of cerebral palsy were 9.5% in infants with birth weights < 1,000 g and 5.1% in infants with birth weights of 1,000–1,500 g by NRNJ.19 Similarly, in a recent meta-analysis, the prevalence of cerebral palsy in VLBWIs was 6.8%, 8.4% in infants with birth weight < 1,000 g, 4.2% in infants with birth weight 1,000–1,500 g, and 10.0% in extremely preterm infants with GA < 28 weeks.20 In the Australian and New Zealand Neonatal Network (ANZNN),21 at 2–3 years of age, the rates of cerebral palsy were lower than those in the present study, with 13%, 10%, 9%, 4%, and 4% in infants with a GA of < 24, 24, 25, 26, and 27 weeks, respectively. The rate of cerebral palsy in VLBWIs at 18–24 months of CA and at three years of age in Korea decreased over time in the present study. This result is in line with those of recent reports from other countries that observed a decreasing prevalence of cerebral palsy in VLBWIs as well as in term infants. In Japan, the prevalence of cerebral palsy has decreased over time to 1.88 per 1,000 live births in infants born between 1988 and 2007.22 Among them, 70% were preterm or low-birth-weight infants. In Europe, the prevalence of cerebral palsy has also decreased, from 1.90 to 1.77 per 1,000 live births in infants born between 1980 and 2003.23 Further, in VLBWIs, it decreased from 70.9 to 35.9 per 1,000 live births,23 which is similar to the results of the present study. In addition, the Surveillance for Cerebral Palsy in Europe (SCPE) network reported that the prevalence of cerebral palsy in preterm infants born between 2004 and 2010 continues to decrease.24 The rate of motor delay at 18–42 months of CA in ANZNN21 was lower than that in the present study, which was 39%, 26%, 24%, 16%, and 13% in infants with a GA of < 24, 24, 25, 26, and 27 weeks, respectively, as reported by ANZNN. In the present study, the rate of infants requiring rehabilitative support at 18–24 months of CA decreased according to era. This finding was presumed to be affected by the decreased number of infants with cerebral palsy who continued to require rehabilitative motor support. But 34% and 25% of our VLBWIs required rehabilitative support at 18–24 months of CA and at three years of age, respectively. The follow-up rate at follow-up 2 increased over time in infants with each GA, not only in infants with larger GA. Therefore, decreased morbidities at follow-up 2 compared with follow-up 1 did not seem to be associated with increased follow-up of infants with larger GA.
The rate of infants with language developmental delays and requiring language support increased according to era. Further, infants with language developmental delay and requiring language support were increased at three years of age compared with those at 18–24 months of CA. This may result from the increased follow-up of severe infants at three years of age, increased concerns about language development at three years of age, or an actual increase in language developmental delay at three years of age. This trend is similar to the study by Stolt et al.25 that VLBWIs with weak language skill increased at five years of age (20–27% of VLBWIs) compared with those at two years of age (16–18% of VLBWIs). Further, preterm infants have increased risk of atypical linguistic performances, which means language development in preterm infants is quite different from term infants.26 Further studies on the increasing trends in language delay and language support are needed. According to an ANZNN,21 the rate of cognitive delay at 18–42 months of CA was 34%, 26%, 18%, 15%, and 12% in infants with GA of < 24, 24, 25, 26, and 27 weeks, respectively. Moreover, the rate of language delay at 18–42 months of CA was higher than that of motor or cognitive delay at 56%, 40%, 32%, 28%, and 25% in infants with a GA of < 24, 24, 25, 26, and 27 weeks, respectively, as reported by ANZNN.21
The rate of growth restriction, especially weight growth restriction at 18–24 months of CA, has decreased according to era. This may be partly due to aggressive nutritional support and improved NICU care. The rate of growth restriction decreased with increasing GA and then increased again in infants with GA ≥ 32 weeks. A direct comparison between the ANZNN report and the present study was not possible because of the methodological differences. However, this trend is similar to the ANZNN report that the decreased rate of growth restriction with increasing GA increased again in infants with larger GA (≥ 28 weeks). According to the report of ANZNN, the rates of weight growth restriction (weight < 10 percentile) at the 2–3 year follow-up were 30%, 20%, 18%, 16%, 15%, and 37% in infants with GA < 24, 24, 25, 26, 27, and ≥ 28 weeks, respectively.21 The rates of height growth restriction (height < 10 percentile) at the 2–3 year follow-up were 35%, 31%, 26%, 24%, 23%, and 43% in infants with GA < 24, 24, 25, 26, 27, and ≥ 28 weeks, respectively. In addition, the rates of head circumference growth restriction (head circumference < 10 percentile) at the 2–3 year follow-up were 33%, 22%, 16%, 12%, 9%, and 23% in infants with GA < 24, 24, 25, 26, 27, and ≥ 28 weeks, respectively.21 KNN registration was based on birth weight (< 1,500 g) not GA. Small-for-gestational age (SGA) infants with a GA ≥ 32 weeks and birth weight < 1,500 g may be included in the group of infants with a GA ≥ 32 weeks at enrollment. Therefore, extrauterine growth restriction might be affected by the enrollment rate of SGA infants, and SGA infants tend to have smaller head circumferences and remain lighter and shorter than appropriate-for-GA infants.27 Further, the rate of growth restriction was higher at three years of age than at 18–24 months of CA in the present study. This result may be attributed to the higher follow-up rate of infants with respiratory distress syndrome, bronchopulmonary dysplasia, operation of patent ductus arteriosus, or periventricular leukomalacia,28 who are at great risk for extrauterine growth restriction.29 Also, this may be in line with the finding that the early achievement of catch-up growth is not sustained in some preterm infants.27
In the present study, we have presented long-term follow-up data according to GA. Therefore, additionally long-term outcomes according to birth weight were analyzed based on the annual reports of KNN 2020 (follow-up 1 of VLBWIs born in 2018, and follow-up 2 of VLBWIs born in 2017) (Supplementary Tables 1 and 2). Long-term outcomes were improved according to increasing birth weight both at follow-ups 1 and 2. At follow-up 2, VLBWIs who re-hospitalized, or required rehabilitative support were decreased, whereas those required language support were increased compared with follow-up 1. The incidence of cerebral palsy decreased abruptly according to increasing birth weight. The incidences of cerebral palsy and ‘unknown’ cerebral palsy at follow-up 1 were 4.5% and 2.4%, respectively in infants born in 2018, and those at follow-up 2 were 4.7% and 3.4%, respectively in infants born in 2017.
The present study has some limitations. First, this study was based on the annual reports of the KNN. Therefore, we could not control for all the confounding factors. For example, the enrollment rate of SGA infants in each GA group could not be controlled. Furthermore, direct statistical comparison with other neonatal networks was impossible because of methodological differences in long-term follow-up age, stratification of GA, and inclusion criteria of registrants. Second, infants with morbidities such as respiratory distress syndrome, bronchopulmonary dysplasia, operation of patent ductus arteriosus, periventricular leukomalacia, or retinopathy of prematurity were more commonly followed up.28 Considering the long-term follow-up nature of this study, those selection bias was inevitable. Third, the higher mortality rate in the NICU among infants with a smaller GA may be related to a lower rate of long-term growth and neurodevelopmental impairment among survivors.19 Despite these limitations, this study is significant because it is the first to evaluate the overall long-term growth and neurodevelopmental outcomes of VLBWIs in Korea using a nationwide large cohort.
In conclusion, the long-term outcomes of VLBWIs regarding weight growth and cerebral palsy, the most common motor disability in childhood, have improved serially since the establishment of the KNN. However, the rate of infants with language delays requiring language support has increased, according to era. Further research is needed on the increased trends of language delay and language support while improving motor outcomes.
 XML Download