Abstract
Background
Muscle atrophy is caused by an imbalance between muscle growth and wasting. Delta-like 1 homolog (DLK1), a protein that modulates adipogenesis and muscle development, is a crucial regulator of myogenic programming. Thus, we investigated the effect of exogenous DLK1 on muscular atrophy.
Methods
We used muscular atrophy mouse model induced by dexamethasone (Dex). The mice were randomly divided into three groups: (1) control group, (2) Dex-induced muscle atrophy group, and (3) Dex-induced muscle atrophy group treated with DLK1. The effects of DLK1 were also investigated in an in vitro model using C2C12 myotubes.
Results
Dex-induced muscular atrophy in mice was associated with increased expression of muscle atrophy markers and decreased expression of muscle differentiation markers, while DLK1 treatment attenuated these degenerative changes together with reduced expression of the muscle growth inhibitor, myostatin. In addition, electron microscopy revealed that DLK1 treatment improved mitochondrial dynamics in the Dex-induced atrophy model. In the in vitro model of muscle atrophy, normalized expression of muscle differentiation markers by DLK1 treatment was mitigated by myostatin knockdown, implying that DLK1 attenuates muscle atrophy through the myostatin pathway.
Muscular atrophy is the loss of skeletal muscle mass as a consequence of increased myofibrillar protein degradation and decreased protein synthesis [1]. Muscle atrophy occurs under a variety of conditions, and can lead to serious social debility and associated social costs especially in the recent aging society [2]. Delta-like 1 homolog (DLK1) is a transmembrane protein belonging to the epidermal-growth-factor-like-repeat-containing family and essential for proper skeletal muscle development and regeneration [3]. In addition, treatment with soluble DLK1 peptide attenuates hepatic steatosis and hyperglycemia in vivo [4], implying pleiotropic effects of DLK1 including metabolic regulation. The effects of DLK1 on muscle and other organs can be studied by injection of soluble DLK1 peptide, which is commercially available as a construct of the N-terminal extra cellular domain of DLK1 fused with a human Fc fragment, into animal models. However, the therapeutic effects of DLK1 in muscle atrophy and the underlying mechanisms of the condition have not previously been studied in vivo.
We used dexamethasone (Dex) to establish an experimental model of muscle atrophy [5], as Dex induces muscle wasting and degeneration by stimulating the production of myostatin [6,7]. Myostatin negatively regulates muscle mass and accelerates muscular atrophy during Dex treatment [8]. The ubiquitin-proteasome system plays a major role in the catabolic action of glucocorticoids, and myostatin increases the activity of important muscle-specific ubiquitin E3 ligases, muscle-specific RING finger protein 1 (MuRF1) and atrogin1 [8]. We also used the cardiotoxin (CTX) isolated from Naja pallida, an amphiphilic peptide that damages muscle due to increased production of reactive oxygen species (ROS) secondary to cytosolic calcium overload [9], to induce muscle atrophy in vivo.
In the present study, we investigated whether DLK1 inhibits or attenuates muscular atrophy in Dex- or CTX-induced muscular atrophy models in vivo and in vitro. To assess the effects of DLK1 on muscle quantity and quality, we evaluated morphological changes in muscle fibers and mitochondria of muscle cells, and changes in the expression of myostatin and other markers of muscle atrophy and differentiation.
A soluble form of DLK1 protein tagged with FLAG (FLAG-DLK1) was provided by Dr. Bum-Chan Park (Y-Biologics, Inc., Daejeon, Korea) and was produced as described previously [4].
Eight-week-old male C57BL/6J mice were purchased (Joong-ang Experimental Animal Co., Seoul, Korea) and acclimatized for 2 weeks. The mice were housed in an animal facility maintained at 23°C±2°C and 55%±5% humidity. Mice were exposed to a 12 hours/12 hours light/dark cycle and fed an unrestricted standard chow diet. All animals had free access to drinking water, and body weight was measured every 2 days. All mice were fasted for 6 hours before sacrifice. In all cases, mice were anesthetized and sacrificed 24 hours after the final administration of drugs. After mice were sacrificed, blood was collected by cardiac puncture and tibialis anterior (TA) muscle tissue was harvested. Specimens were snap-frozen in liquid nitrogen and maintained at −80°C until analysis. All animal experiments were approved by the Institutional Animal Care and Use Committee of Yonsei University Health System (YUHS-IACUC, 2017−0066, 2018−0194) and complied with the regulations and guidelines of the Animal Protection Act (2008), the Laboratory Animal Act (2008), and the Eighth Edition of the Guide for the Care and Use of Laboratory Animals of NRC (2011).
In experiments employing the Dex-induced muscle atrophy model, 10-week-old C57BL/6J male mice were divided into three groups: (1) control group (distilled water [DW] oral gavage and intraperitoneal [IP] phosphate buffered saline [PBS]; n=6); (2) Dex group (Dex oral gavage and IP PBS; n=8), and (3) Dex+DLK1 group (Dex oral gavage and IP DLK1; n=8). Briefly, 1 mg/kg Dex (D2915, Sigma-Aldrich, St. Louis, MO, USA) or DW was administrated by oral gavage once daily for 2 weeks, and DLK1 (0.8 mg/kg/day) or PBS (DaiHanPharm, Ansan, Korea) was administered by IP injection once daily for 2 weeks.
In experiments employing the CTX muscle-crush injury model, 10-week-old mice were divided into three groups: (1) control group (intramuscular [IM] PBS and IP PBS; n=3); (2) CTX group (IM CTX and IP PBS; n=4); and (3) CTX+DLK1 group (IM CTX and IP DLK1; n=3). Briefly, mice were anesthetized, and then CTX (150 μL at 10 μM) isolated from Naja pallida (Latoxan L81-02) was injected into the TA muscle. Beginning the day of IM CTX or PBS injection, DLK1 (0.8 mg/kg/day) or PBS was administered to the mice by IP injection once daily for 10 days.
The C2C12 mouse myoblast cell line was purchased from the American Type Culture Collection (Manassas, VA, USA) and grown in Dulbecco’s Modified Eagle Medium (DMEM) supplemented with 10% v/v fetal bovine serum (Invitrogen, Burlington, ON, Canada) and 1% penicillin/streptomycin at 37°C in 5% CO2. After growing to 100% confluence, cells were further cultured in DMEM containing 2% horse serum (differentiation medium [DM]) for 5 days to induce differentiation of myotubes. The first day of incubation in the DM was considered Day 0 of differentiation. The DM was changed every 24 hours. On Day 4 of differentiation, one of three DM-based media was added to wells containing the resulting C2C12 myotubes (in triplicate), and the plates were incubated for an additional 24 hours: (1) control group (0.02% v/v ethanol); (2) Dex group (10 μM Dex [D4902, Sigma-Aldrich]dissolved in ethanol); and (3) Dex + DLK1 group (10 μM Dex dissolved in ethanol with 5.0 μg/mL DLK1). After 24 hours growth, cells were harvested for extraction of total RNA and used for the analyses.
Harvested TA tissue was fixed in 10%-PBS-buffered formaldehyde for 48 hours, embedded in paraffin, and sectioned into 5-μm-thick slices for Masson’s trichrome staining. After sealing the slides with neutral gum, the Masson’s trichrome-stained tissue slices were examined at 200× magnification. Blue-stained fibrosis area in Masson’s trichrome staining were quantified using the Image J software (NIH Image, Bethesda, MD, USA). After adjusting for the threshold within the section image, the surface area above the threshold was measured to determine the absolute and percentage area of blue-stained tissue.
On the day before the experiment was completed, four mice from each group were selected and subjected to dual energy X-ray absorptiometry (DXA, InAlyzer Medikors, Seongnam, Korea) for whole body composition analysis. The DXA scanner uses two separate low-dose X-ray exposures to read bone and soft tissue mass with a high degree of precision. Prior to the start of the experiment, the system was calibrated according to the manufacturer’s instructions. Software integrated into the scanner was used for data analysis.
Two mice in each group with body weights similar to the median were selected as representative mice. A minimum of five tissue sites was randomly selected for imaging, and a representative image is presented in the figures. Samples of TA muscle were fixed with 2% glutaraldehyde in paraformaldehyde (Merck & Co. Inc., Kenilworth, NJ, USA) overnight at 4°C and post-fixed for 1 hour in 1% OsO4 resin (Polysciences Inc., Warrington, PA, USA). Samples were dehydrated in ethanol (Merck & Co.), embedded in rubber molds with epoxy resin (Polysciences Inc.), and polymerized in an oven at 60°C for 20 hours. Semithin sections (1 μm thick) were cut using a Leica Ultracut UCT (Leica Microsystems Inc., Buffalo Grove, IL USA) and stained with toluidine blue (Merck). Ultrathin sections (70 nm thick) were cut and mounted on coated copper grids (Nisshin EM, Tokyo, Japan) and double stained with 6% uranyl acetate (Ted Pella Inc., Redding, CA, USA) and lead citrate (Wako, Osaka, Japan). The ultrastructure of the tissue sections was observed using a JEM-1011 transmission electron microscope (TEM, JEOL, Tokyo, Japan) with an accelerating voltage of 80 Kv. Images were viewed using Camera-Megaview III software (EMSIS, Munster, Germany).
Total RNA was extracted using a Hybrid-R™ RNA purification kit (GeneAll Biotechnology, Seoul, Korea) according to the manufacturer’s instructions. Synthesis of cDNA from 1.0 μg total RNA per sample was performed in a 20 μL reaction volume using a high-capacity cDNA reverse transcription kit (Life Technologies, Carlsbad, CA, USA) and 2.5 μM of random primers. Quantitative real-time polymerase chain reaction (qPCR) was performed in 10 μL reaction volumes containing cDNA, 5 pmol of each oligonucleotide primer, and 5.0 μL of Power SYBR® Green PCR Master Mix (Life Technologies, Warrington, UK). The qPCR reactions were performed in a StepOnePlus™ Real-Time PCR System (Applied Biosystems, Foster City, CA, USA) in a 96-well plate. The 2-ΔΔCt method was used to determine the relative abundance of mRNAs for muscle atrophy F-box protein (atrogin1), dynamin-related protein-1 (Drp1), myosin heavy chain (MHC) I, IIb, and IIx, MuRF1, myogenic differentiation (MyoD), myogenin, myostatin, and optic atrophy protein 1 (Opa1) using 18S ribosomal RNA (18S) as an internal reference. The mouse cDNA sequences were obtained from GeneBank (Supplemental Table S1).
Double-stranded small interfering RNAs (siRNAs) targeting myostatin (20 nM) were purchased from QIAGEN (Cambridge, MA, USA). The C2C12 cells were transfected with siRNAs complexed with Lipofectamine™ 2000 reagent or negative control siRNA (Invitrogen, Carlsbad, CA, USA) according to manufacturer instructions. Myostatin siRNA transfection of myotubes was performed on Days 0 and 3 of differentiation. knockdown of myostatin gene expression (reduction ≥70%) was tested using the transfected cell line. After sufficient transfection, C2C12 cells were washed with PBS, the growth medium was changed on cell differentiation Day 4, and the wells were divided into three groups: (1) control group (0.02% v/v ethanol); (2) Dex group (10 μM Dex [D4902, Sigma-Aldrich] dissolved in ethanol); and (3) Dex+DLK1 group (10 μM Dex dissolved in ethanol with 5.0 μg/mL DLK1). After 24 hours, cells were harvested for Western blot analyses.
The C2C12 cells were grown for 4 days, with the DM changed every 24 hours. On the day of the experiment, fresh medium with test agents was added to the wells as follows. Cells were washed with PBS, scraped off in ice-cold PhosphoSafe™ buffer (Novagen, Merck), and centrifuged for 5 minutes at 16,000×g (4°C). Protein concentrations were determined from clear supernatants using a Bradford assay (Sigma-Aldrich) with bovine serum albumin as the control. Equal amounts (20 μg) of total protein were electrophoresed in sodium dodecyl sulfate-polyacrylamide gel electrophoresis (SDS-PAGE) 10% gradient gels. Proteins were transferred to polyvinylidene fluoride (PVDF) membranes (Millipore). Samples were immunoblotted overnight with the indicated primary antibodies (typically at a 1:1,000 dilution) followed by secondary antibody conjugated with horseradish peroxidase (1:5,000 dilution). A SuperSignal™ West Pico PLUS kit (Thermo, Waltham, MA, USA) was used for detection. Proteins of interest were detected with the following specific antibodies: myogenin (F5D, Abcam, Boston, MA, USA), GDF8/myostatin (Abcam), and glyceraldehyde-3-phosphate dehydrogenase (GAPDH; 6C5, Santa Cruz Biotechnology Inc., Dallas, TX, USA).
All results are presented as the mean±standard error of the mean. Statistical significance was calculated using a one-way analysis of variance (ANOVA) to assess differences between the multiple groups. Additionally, the Student’s t test was performed to compare values between two groups in post hoc analyses. A P<0.05 was considered statistically significant. All experiments were repeated at least three times. All statistical procedures were conducted using SPSS software version 25.0, for Windows (IBM Corp., Armonk, NY, USA).
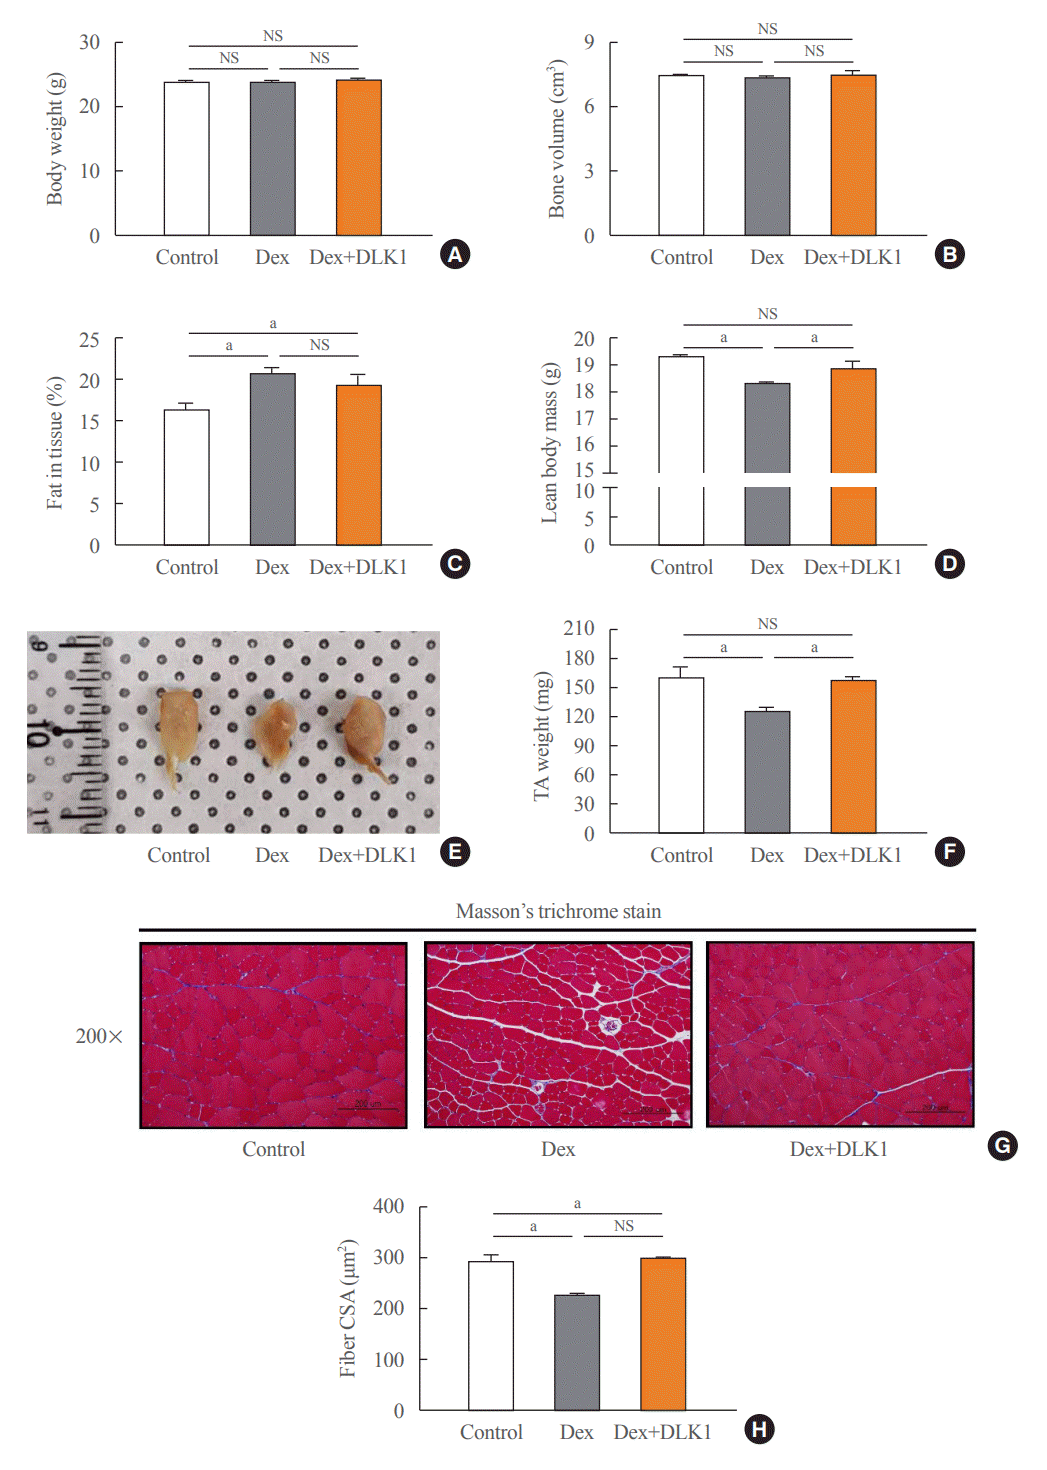
The DXA body composition of representative mice from the three groups in the Dex-induced muscle atrophy model was analyzed (Fig. 1A–D). Body weight and bone volume did not differ between the three groups (Fig. 1A, B), but the percentage of tissue fat was significantly increased in the Dex group compared to the control group (P<0.05) (Fig. 1C). Lean body mass was significantly reduced in the Dex group compared to the control group, and DLK1 administration reversed the reduction in lean body mass which was evident in the Dex-only group (P<0.01) (Fig. 1D).
We also compared the TA muscle weight of mice from the three groups (Fig. 1E, F). The TA muscle weight was significantly lower in the Dex group than the control and Dex+DLK1 groups (P<0.05), but there was no difference between the control and Dex+DLK1 groups (Fig. 1F). Trichrome staining revealed reduced muscle fibril size and atrophy in the Dex group (Fig. 1G). Histology studies (Fig. 1H) indicated reduction of the cross-sectional area of TA myofibrils in the Dex group compared to the control group (22.3% reduction, P<0.05) (Fig. 1H), while the cross-sectional area of myofibrils in the Dex+DLK1 group was similar to that of the control group. Fibrotic area of TA muscle in the Dex group was significantly increased compared to the control group (Supplemental Fig. S1). DLK1 administration reduced Dex-induced fibrotic area, but statistical significance was not found. A significant reduction in mRNA expression was observed for type IIb fiber in the Dex group compared to the control group (Supplemental Fig. S2). In general, the relative mRNA expression ratio of each type of muscle fiber was consistent from 0.7 to 0.8 in the Dex group versus the control group, irrespective of fiber type. The relative expression of each type of fiber was not significantly different between the control and Dex+DLK1 groups.
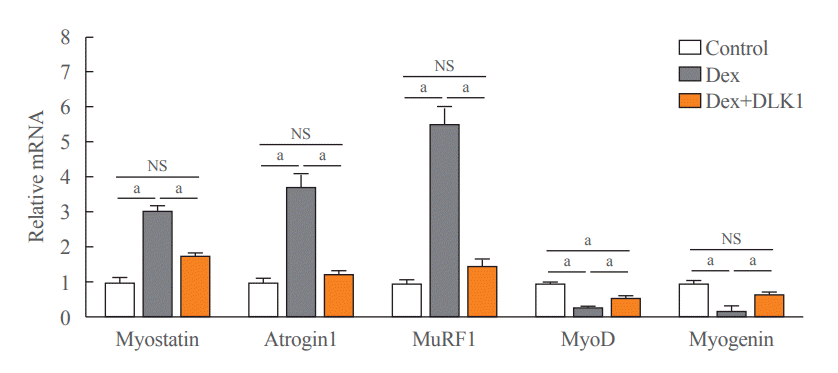
In the TA muscle from the Dex-induced muscle atrophy model, mRNA expression of myostatin, a negative regulator of muscle mass that upregulates muscle-atrophy-related factors such as atrogin1 and MuRF1 [8], was up to three-fold greater than that of the control group, an effect that was significantly inhibited by DLK1 treatment (Fig. 2). Similarly, the expression of atrogin1 and MuRF1 was significantly greater in the Dex group compared to the control group, but these changes were not evident in the Dex+DLK1 treatment group (Fig. 2). In contrast, the expression of the myogenic factors MyoD and myogenin was significantly reduced in the Dex group, and these changes were attenuated in the Dex+DLK1 group (Fig. 2).
In the CTX-induced atrophy model, TA muscle weight was tended to be lower in the Dex group than in the control and Dex+DLK1 groups on the tenth day after the CTX injection (Supplemental Fig. S3A). In the CTX model, the myostatin expression was greater in the Dex group than in the control group on the 10th day after the CTX injection, and DLK1 treatment significantly attenuated these changes (Supplemental Fig. S3B). The expression level of myogenin was higher in the Dex+DLK1 group than in the Dex group on the 5th day after the CTX injection (Supplemental Fig. S3C).
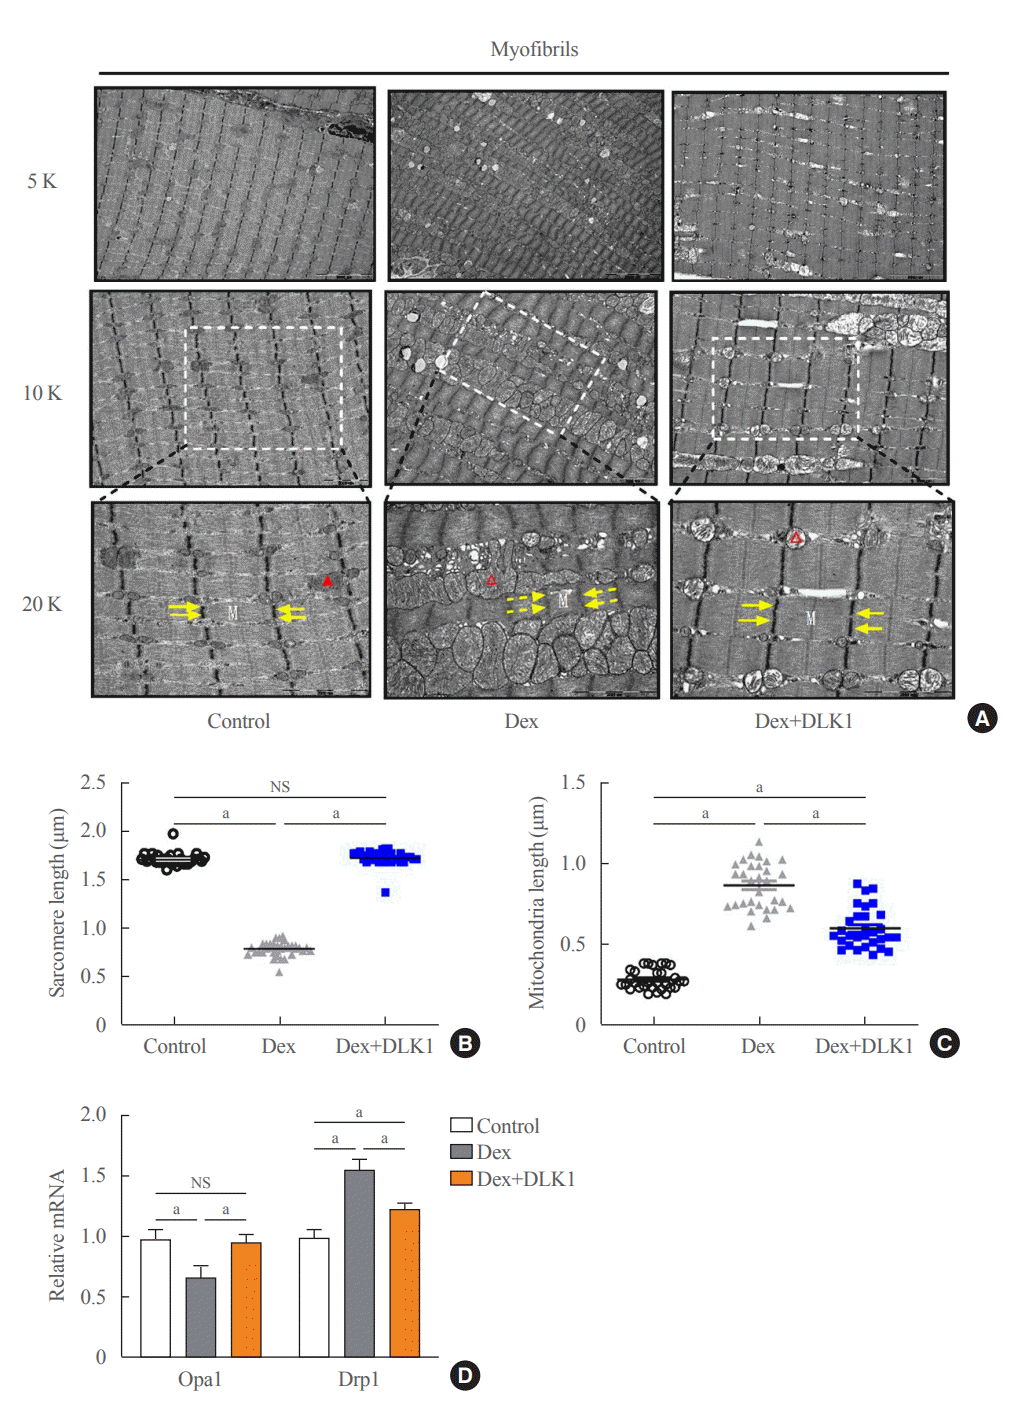
The effects of Dex and DLK1 administration on the inter-myofibrillar morphology and organelles (myofibril, Z line, and mitochondria) of the TA muscle were assessed using TEM (Fig. 3A). In contrast with the intact mitochondrial structure and cristae in the control group, swollen mitochondria with disorganized and fragmented cristae were evident in the Dex group. In the most severely damaged muscle cells, near complete dissolution of the internal architecture of both the Z line and myofibril was found. In the Dex+DLK1 group, Dex-induced mitochondrial swelling and disarray of the cristae were markedly reduced compared to the Dex-only group. The sarcomeres within TA muscle were significantly shorter in the Dex group than the control group (P<0.05) (Fig. 3B), while there was no difference in sarcomere length between the control and Dex+DLK1 groups. The mitochondria within the TA muscle were significantly longer in the Dex group than the control group (Fig. 3C) (P<0.05), and mitochondria lengthening was less pronounced in the Dex+DLK1 group. Regarding the mitochondria-shaping factors (Opa1 and Drp1) that regulate mitochondrial fusion and fission processes (Fig. 3D), decreased expression of Opa1 and increased expression of Drp1 were found in TA muscle from the Dex group compared to the control group. In contrast, in the Dex+DLK1 group, mitochondrial fusion-fission machinery in the TA muscle was relatively maintained.
The TEM imaging of the TA muscle from the CTX-induced muscle atrophy model revealed no CTX-induced mitochondrial degeneration in the Dex+DLK1 group (Supplemental Fig. S3E).
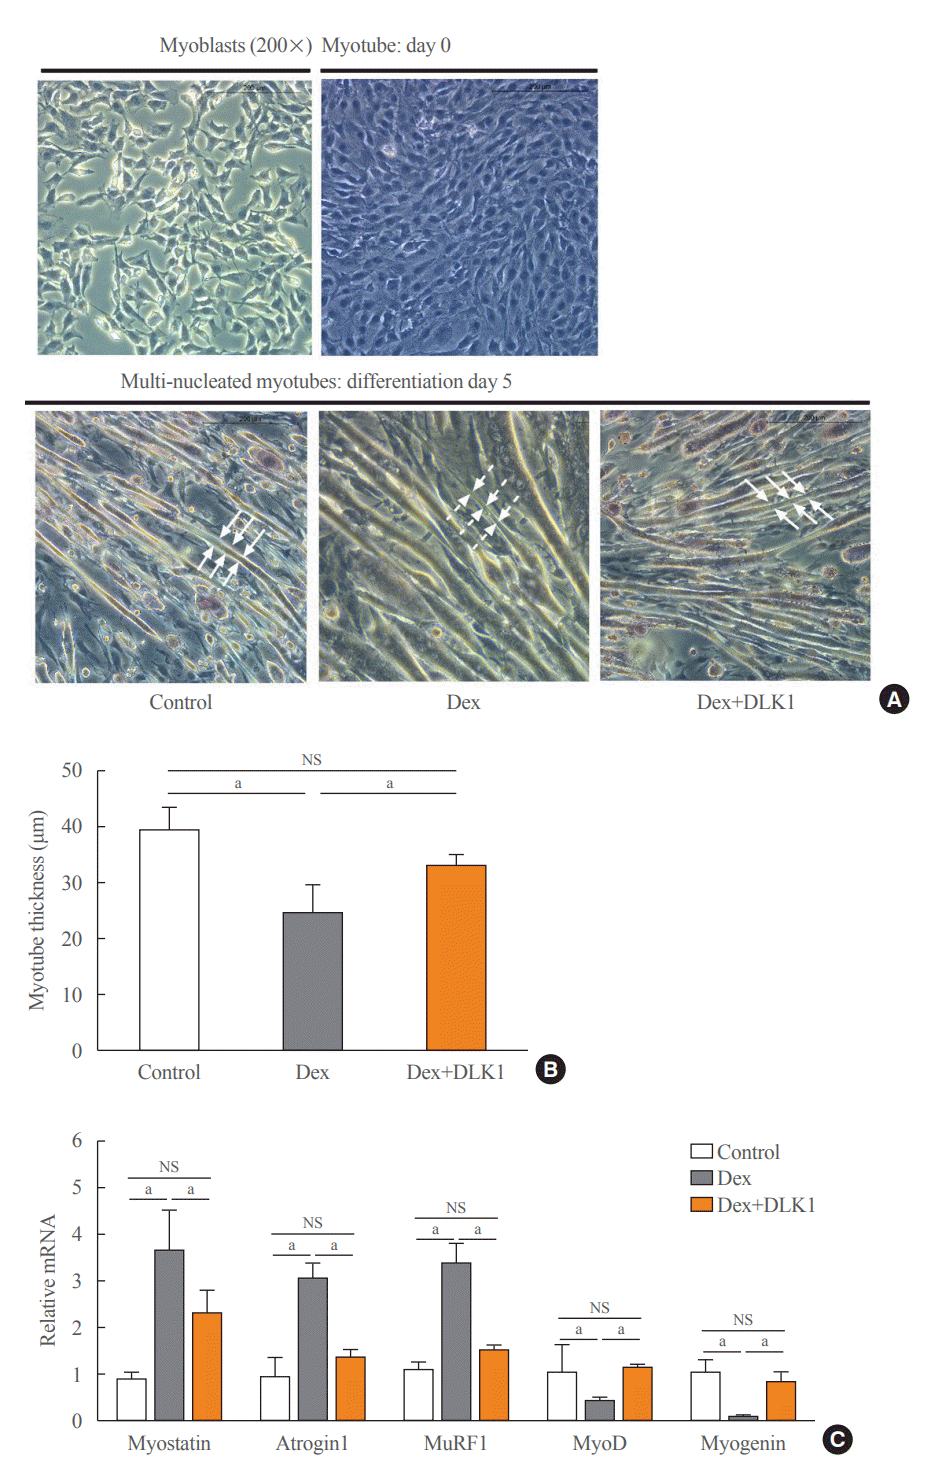
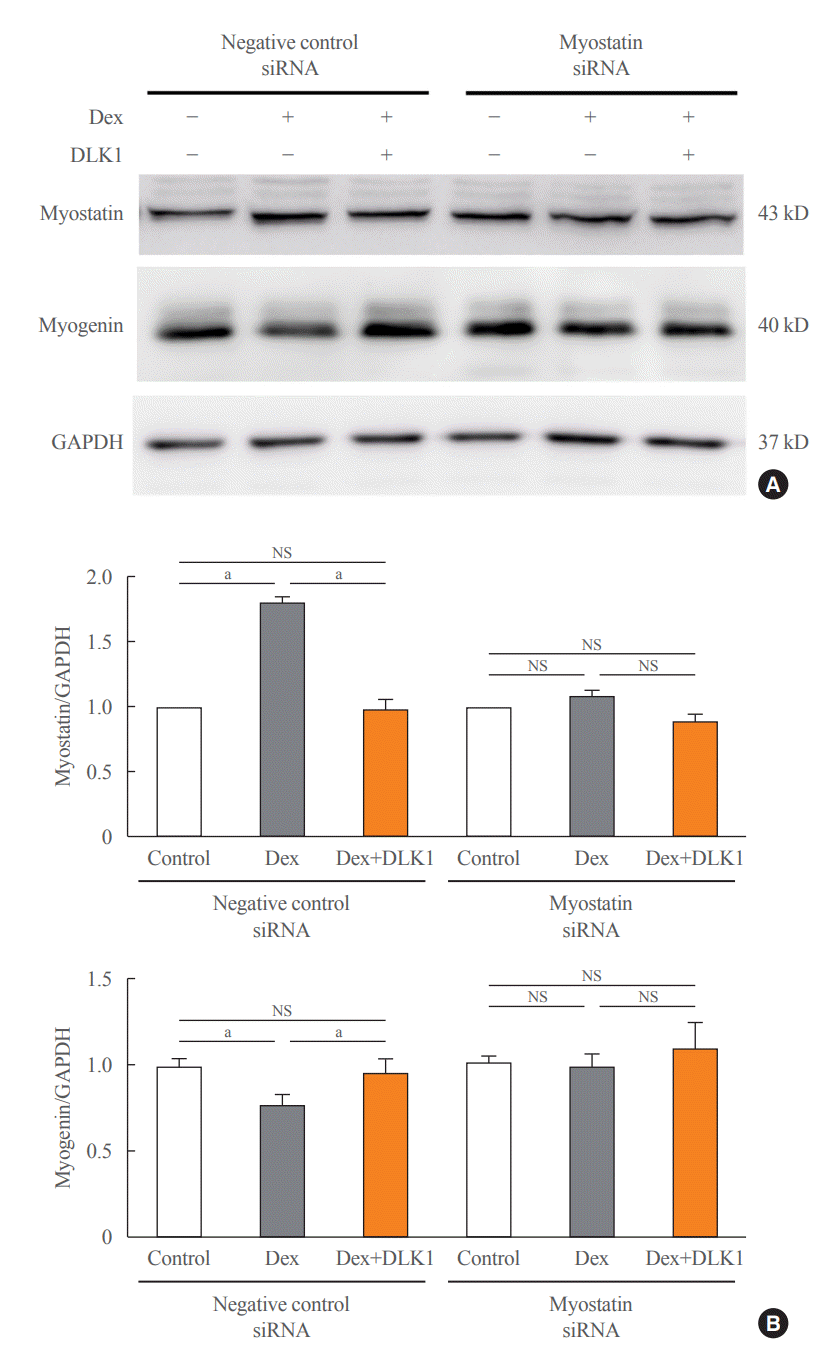
Dex was added into the culture medium of differentiated C2C12 myotubes for 24 hours on Day 4 of differentiation and resulted in myotube atrophy (Fig. 4A). In contrast, myotube thickness was significantly increased by the addition of DLK1 (5 μg/mL) to Dex-treated C2C12 myotubes compared to the addition of Dex alone (Fig. 4A, B). The C2C12 myotubes incubated with Dex showed a significant increase in the mRNA expression of myostatin and of muscle atrophy factors, atrogin1 and MuRF1, compared to ethanol-treated controls (Fig. 4C). In addition, Dex suppressed mRNA expression of the myogenic factors, MyoD and myogenin. In contrast, the addition of DLK1 to Dex prevented the atrophic effect of Dex in C2C12 myotube cultures by reducing the expression of muscle atrophy factors and increasing the expression of myogenic factors. Incubation with Dex also induced structural and morphological changes in myotubular mitochondria, characterized by elongation and swelling of mitochondria, but these changes were not evident in cultures to which Dex and DLK1 were added (Fig. 5A). Along with mitochondrial morphological changes, Dex significantly reduced mRNA expression of the fusion regulator Opa1 and increased mRNA expression of the fission regulator Drp1 compared to those of the control (Fig. 5B). Addition of Dex+DLK1 to myotube cultures normalized Dex-induced changes in the expression of mitochondrial fusion and fission markers to levels comparable with those of the control group (Fig. 5B). To confirm whether the protective effect of DLK1 on muscle atrophy is mediated by modulation of myostatin, myostatin expression was down-regulated in differentiated C2Cl2 myotubes using siRNA transfection. In myotubes transfected with negative control siRNAs, Dex treatment significantly increased myostatin expression and decreased myogenin expression (Fig. 6); these effects were not evident in the Dex+DLK1 myotube cultures, which showed comparable myostatin and myogenin expression to the control group. However, under the condition of myostatin knockdown, no significant difference in myostatin and myogenin protein expression were found in the Dex-treated myotube cultures compared to the control and Dex+DLK1 myotube cultures (Fig. 6).
In the present study, we demonstrated that DLK1 attenuated Dex- and CTX-induced muscular degenerative changes by decreasing myostatin expression in these mouse muscle atrophy models. In addition, DLK1 treatment improved mitochondrial dynamics in the Dex-induced atrophy model. Knockdown of myostatin reduced the protective effect of DLK1 against muscle atrophy in vitro, suggesting critical role for myostatin in DLK1-mediated muscle protection.
The balance between muscle proteolysis and synthesis is regulated by myokines, the cytokines secreted by muscle [10]. Myostatin is an important myokine that negatively regulates muscle hypertrophy [11]. Myostatin is a member of the transforming growth factor β (TGF-β) family and essential for negative regulation of skeletal muscle growth [12]. Mutation of myostatin was reported to lead to an increase in muscle mass in vivo [13]. Therefore, myostatin might be an attractive target for treatment of sarcopenia associated with muscle atrophy [14].
Attenuation of muscular atrophy process by DLK1 treatment in this study could be mediated by inhibition of myostatin downstream signaling, as DLK1 is a pharmaceutical composition for suppressing linkage between activin receptor type 2 B (ACVR2B; a TGF-β type II receptor) and its ligands, representatively myostatin [15,16] in a competitive manner (Supplemental Fig. S4). Binding of myosatin to ACVR2B stimulates the phosphorylation of Smad2/3 [15-17]. Phosphorylated Smad2/3 leads to down-regulation of myogenic genes such as MyoD and myogenin [18]. In addition to Smad2/3 stimulation, myostatin pathway inhibits Akt, which consequently activates forkhead box O (FoxO) signaling [15]. Activated FoxO upregulates transcription of atrophy-specific genes, such as atrogin1 and MuRF1 [15]. Furthermore, independent of regulating Smad, FoxO and Akt, myostatin signaling can interact with peroxisome proliferator-activated receptor-γ coactivator-1 α (PGC1-α) in muscle [15]. Suppression of myostatin is associated with increased activity of PGC1-α [15,19]. PGC1-α enhances mitochondrial biogenesis in muscle by upregulating mitochondrial fusion genes including Opa1 [19,20]. In oxidative stress condition, PGC1-α protects muscle cells from ROS-mediated mitochondrial removal [21].
Dex upregulates muscle degradation, suppresses muscle synthesis, and causes muscular atrophy [22]. Dex-induced muscle proteolysis is induced by stimulation of the ubiquitin proteasome system that is composed of muscle-specific proteins (the so-called atrogenes), including atrogin1 and MuRF1 [23]. Both MyoD and myogenin are myogenic regulatory factors [24]: MyoD upregulates skeletal myogenesis that directs contractile protein synthesis and mediates muscle injury repair process [25], and myogenin enhances muscular biosynthetic pathway and regulates differentiation of myoblasts to multinucleated myotubes under atrophic conditions [26]. Loss of the myogenin gene is a lethal mutation due to severe skeletal muscle deficiency as myoblasts are unable to fuse into multinucleated myofibers without myogenin activity [27]. Dex treatment is associated with reduced expressions of MyoD and myogenin in muscle, similar to catabolic states. In the present study, DLK1 administration attenuated Dex-induced muscle atrophy and loss of TA muscle weight. Consistent to previous findings [28], in this study, Dex upregulated expression levels of myostatin and muscular-atrophy-related factors including atrogin1 and MuRF1. These Dex-induced changes were attenuated by DLK1 treatment. In addition, Dex-induced reductions in MyoD and myogenin were inhibited by DLK1 treatment. In the present in vitro study using knockdown of endogenous myostatin expression [29], the protective effect of DLK1 against muscle atrophy was diminished, suggesting that DLK1 treatment inhibits atrophic progression through regulation of the myostatin signaling pathway [30].
The CTX-induced model of muscle injury involves disruption of ion fluxes, mediated by membrane depolarization, and is accompanied by the loss of protein content and organellar breakdown [31]. Myogenic regulatory factors including myogenin are sharply induced at Days 3 to 5 after CTX injury to promote MyoD in the regeneration process after injury [32]. In the present study, myogenin expression in the TA muscle was significantly amplified by DLK1 treatment on Day 5 after CTX injection, suggesting an augmented regenerative response to injury. Thus, we postulate that DLK1 generally enhances muscular regeneration after various injurious stimuli such as Dex and CTX. Further studies are needed to assess potential clinical applications of DLK1.
Muscular atrophy is characterized histologically by decreased muscle size and protein content, and loss of cellular organelles [33], accompanied by changes in muscle fibers and mitochondria. The mitochondrial architecture and function in skeletal muscle are maintained by fusion/fission machinery [34,35], and homeostatic regulation of mitochondrial fusion and fission by two transcription factors, Opa1 and Drp1, is disrupted in muscle wasting in vivo [35,36]. Fusion of the inner mitochondrial membrane is mediated by Opa1 [37], and loss of Opa1 is associated with age-dependent muscle loss and weakness [35]. In the present study, DLK1 treatment blocked Dex-mediated reductions of Opa1 in vitro and in vivo. Mitochondrial fission is an early event during cellular degeneration of muscle [37-39]. The mitochondrial fission factor Drp1 was increased by Dex, and DLK1 attenuated Dex-mediated Drp1 upregulation in vitro and in vivo. These results suggest that DLK1 treatment attenuated Dex-mediated muscle atrophy in our model by modulation of Opa1 and Drp1, preventing Dex-mediated alterations in mitochondrial fusion and fission homeostasis.
The balance between synthesis and degradation of myofibrillar protein determines muscle mass. When Dex and DLK1 were co-administered, the diameter of myotubes was significantly increased compared to the effects of Dex treatment alone. These changes were accompanied by ultrastructural changes in muscle fibers as assessed using TEM. In the TA muscle of mice with Dex-induced muscular atrophy, muscle cell mitochondria displayed swollen features, similar to the findings of a previous report [40], while DLK1 treatment partly blocked these changes in mitochondrial morphology and density. Based on these data, we postulate that changes in molecular markers of muscle atrophy, differentiation, and mitochondria induced by DLK1 treatment consequently lead to improvement in muscle architecture.
The current study has some limitations. First, aging-related biological changes mainly drive sarcopenia in humans [41], but DLK1 attenuated muscle wasting by Dex or CTX in the current study. Thus, further studies are needed to investigate the beneficial effect of DLK1 on aging-driven muscle atrophy in vivo. Second, the expression of myogenic factors including MyoD and myogenin was not measured daily after Dex or CTX injection. As muscle regeneration after CTX injury involves time-dependent phases of tissue healing [31], daily evaluation of myogenic factors could provide more detailed information about DLK1-mediated enhancement of muscle regeneration. Third, changes in gross and microscopic feature and muscular biomarkers were investigated using TA muscle, as we considered that muscular atrophy induced by Dex or CTX would be more prominent in the glycolytic muscles such as TA muscle, due to their more vulnerability to stressors such as aging and corticosteroid treatment than oxidative muscle such as soleus muscle [42,43]. However, the absence of data in the oxidative muscle limits the interpretation of DLK1’s effect on muscular atrophy. The effect of DLK1 on muscular atrophy needs to be further comprehensively validated using both glycolytic and oxidative muscles. Fourth, a positive correlation between DLK1 and insulin resistance was observed previously [44], but changes in insulin resistance-related parameters were not measured in this study. To safely use DLK1 in sarcopenia which is frequently accompanied with insulin resistance and diabetes [45], the effect of DLK1 on insulin resistance requires further investigation. Fifth, the capacity of DLK1 could be decided using the degree of increase in TA muscle and lean body mass in the present study. However, changes in muscle strength by DLK1 treatment should be additionally assessed using methods such as forelimb grip strength [46], as sarcopenia, a disease that DLK1 aims to treat, is defined as a progressive decline of not only skeletal muscle mass, but also muscle strength and functions [47,48]. Sixth, changes in mitochondrial function by DLK1 treatment was not investigated. As intact mitochondrial function is an important determinant to prevent muscle atrophy [49], further experiments such as high-resolution respirometry to measure mitochondrial function [50,51], are needed to support the benefit of DLK1 on sarcopenia.
In summary, the present study demonstrated that DLK1 administration has a therapeutic effect on muscular atrophy in vivo, and the action of DLK1 might be mediated by suppression of the myostatin-driven signal transduction system. Collectively, DLK1 could be a promising candidate for treatment of sarcopenia characterized by muscle atrophy and dysfunction.
ACKNOWLEDGMENTS
This study was partly supported by research fund from Dong-A ST Research Center, 2015−2018 (grant No RM0170). The funder had no role in study design, data collection and analysis, decision to publish, or preparation of the manuscript. This article is based in part on the previously published PhD thesis of Ji Young Lee.
REFERENCES
1. Fanzani A, Conraads VM, Penna F, Martinet W. Molecular and cellular mechanisms of skeletal muscle atrophy: an update. J Cachexia Sarcopenia Muscle. 2012; 3:163–79.
2. Saini A, Faulkner S, Al-Shanti N, Stewart C. Powerful signals for weak muscles. Ageing Res Rev. 2009; 8:251–67.
3. Waddell JN, Zhang P, Wen Y, Gupta SK, Yevtodiyenko A, Schmidt JV, et al. Dlk1 is necessary for proper skeletal muscle development and regeneration. PLoS One. 2010; 5:e15055.
4. Lee YH, Yun MR, Kim HM, Jeon BH, Park BC, Lee BW, et al. Exogenous administration of DLK1 ameliorates hepatic steatosis and regulates gluconeogenesis via activation of AMPK. Int J Obes (Lond). 2016; 40:356–65.
5. Morrison-Nozik A, Anand P, Zhu H, Duan Q, Sabeh M, Prosdocimo DA, et al. Glucocorticoids enhance muscle endurance and ameliorate Duchenne muscular dystrophy through a defined metabolic program. Proc Natl Acad Sci U S A. 2015; 112:E6780–9.
6. Ma K, Mallidis C, Bhasin S, Mahabadi V, Artaza J, Gonzalez-Cadavid N, et al. Glucocorticoid-induced skeletal muscle atrophy is associated with upregulation of myostatin gene expression. Am J Physiol Endocrinol Metab. 2003; 285:E363–71.
7. Menconi M, Gonnella P, Petkova V, Lecker S, Hasselgren PO. Dexamethasone and corticosterone induce similar, but not identical, muscle wasting responses in cultured L6 and C2C12 myotubes. J Cell Biochem. 2008; 105:353–64.
8. Wang R, Jiao H, Zhao J, Wang X, Lin H. Glucocorticoids enhance muscle proteolysis through a myostatin-dependent pathway at the early stage. PLoS One. 2016; 11:e0156225.
9. Langone F, Cannata S, Fuoco C, Lettieri Barbato D, Testa S, Nardozza AP, et al. Metformin protects skeletal muscle from cardiotoxin induced degeneration. PLoS One. 2014; 9:e114018.
10. Costamagna D, Costelli P, Sampaolesi M, Penna F. Role of Inflammation in muscle homeostasis and myogenesis. Mediators Inflamm. 2015; 2015:805172.
11. Rodriguez J, Vernus B, Chelh I, Cassar-Malek I, Gabillard JC, Hadj Sassi A, et al. Myostatin and the skeletal muscle atrophy and hypertrophy signaling pathways. Cell Mol Life Sci. 2014; 71:4361–71.
12. Rebbapragada A, Benchabane H, Wrana JL, Celeste AJ, Attisano L. Myostatin signals through a transforming growth factor beta-like signaling pathway to block adipogenesis. Mol Cell Biol. 2003; 23:7230–42.
13. Morissette MR, Stricker JC, Rosenberg MA, Buranasombati C, Levitan EB, Mittleman MA, et al. Effects of myostatin deletion in aging mice. Aging Cell. 2009; 8:573–83.
14. Chen JL, Walton KL, Hagg A, Colgan TD, Johnson K, Qian H, et al. Specific targeting of TGF-β family ligands demonstrates distinct roles in the regulation of muscle mass in health and disease. Proc Natl Acad Sci U S A. 2017; 114:E5266–75.
15. Han HQ, Zhou X, Mitch WE, Goldberg AL. Myostatin/activin pathway antagonism: molecular basis and therapeutic potential. Int J Biochem Cell Biol. 2013; 45:2333–47.
16. Liu M, Hammers DW, Barton ER, Sweeney HL. Activin receptor type IIB inhibition improves muscle phenotype and function in a mouse model of spinal muscular atrophy. PLoS One. 2016; 11:e0166803.
17. Lach-Trifilieff E, Minetti GC, Sheppard K, Ibebunjo C, Feige JN, Hartmann S, et al. An antibody blocking activin type II receptors induces strong skeletal muscle hypertrophy and protects from atrophy. Mol Cell Biol. 2014; 34:606–18.
18. Langley B, Thomas M, Bishop A, Sharma M, Gilmour S, Kambadur R. Myostatin inhibits myoblast differentiation by down-regulating MyoD expression. J Biol Chem. 2002; 277:49831–40.
19. LeBrasseur NK, Schelhorn TM, Bernardo BL, Cosgrove PG, Loria PM, Brown TA. Myostatin inhibition enhances the effects of exercise on performance and metabolic outcomes in aged mice. J Gerontol A Biol Sci Med Sci. 2009; 64:940–8.
20. Gill JF, Delezie J, Santos G, McGuirk S, Schnyder S, Frank S, et al. Peroxisome proliferator-activated receptor γ coactivator 1α regulates mitochondrial calcium homeostasis, sarcoplasmic reticulum stress, and cell death to mitigate skeletal muscle aging. Aging Cell. 2019; 18:e12993.
21. Baldelli S, Aquilano K, Ciriolo MR. PGC-1α buffers ROS-mediated removal of mitochondria during myogenesis. Cell Death Dis. 2014; 5:e1515.
22. Schakman O, Gilson H, Thissen JP. Mechanisms of glucocorticoid-induced myopathy. J Endocrinol. 2008; 197:1–10.
23. Bodine SC, Latres E, Baumhueter S, Lai VK, Nunez L, Clarke BA, et al. Identification of ubiquitin ligases required for skeletal muscle atrophy. Science. 2001; 294:1704–8.
24. Hernandez-Hernandez JM, Garcia-Gonzalez EG, Brun CE, Rudnicki MA. The myogenic regulatory factors, determinants of muscle development, cell identity and regeneration. Semin Cell Dev Biol. 2017; 72:10–8.
25. Shintaku J, Peterson JM, Talbert EE, Gu JM, Ladner KJ, Williams DR, et al. MyoD regulates skeletal muscle oxidative metabolism cooperatively with alternative NF-κB. Cell Rep. 2016; 17:514–26.
26. Flynn JM, Meadows E, Fiorotto M, Klein WH. Myogenin regulates exercise capacity and skeletal muscle metabolism in the adult mouse. PLoS One. 2010; 5:e13535.
27. Hasty P, Bradley A, Morris JH, Edmondson DG, Venuti JM, Olson EN, et al. Muscle deficiency and neonatal death in mice with a targeted mutation in the myogenin gene. Nature. 1993; 364:501–6.
28. Ma K, Mallidis C, Artaza J, Taylor W, Gonzalez-Cadavid N, Bhasin S. Characterization of 5’-regulatory region of human myostatin gene: regulation by dexamethasone in vitro. Am J Physiol Endocrinol Metab. 2001; 281:E1128–36.
29. Ronning SB. Myogenesis: methods and protocols. New York: Springer New York;2019. Chapter 13, A siRNA mediated screen during C2C12 myogenesis. 229–43.
30. Elkina Y, von Haehling S, Anker SD, Springer J. The role of myostatin in muscle wasting: an overview. J Cachexia Sarcopenia Muscle. 2011; 2:143–51.
31. Forcina L, Cosentino M, Musaro A. Mechanisms regulating muscle regeneration: insights into the interrelated and time-dependent phases of tissue healing. Cells. 2020; 9:1297.
32. Yan Z, Choi S, Liu X, Zhang M, Schageman JJ, Lee SY, et al. Highly coordinated gene regulation in mouse skeletal muscle regeneration. J Biol Chem. 2003; 278:8826–36.
33. Bonaldo P, Sandri M. Cellular and molecular mechanisms of muscle atrophy. Dis Model Mech. 2013; 6:25–39.
34. Iqbal S, Hood DA. The role of mitochondrial fusion and fission in skeletal muscle function and dysfunction. Front Biosci (Landmark Ed). 2015; 20:157–72.
35. Tezze C, Romanello V, Desbats MA, Fadini GP, Albiero M, Favaro G, et al. Age-associated loss of OPA1 in muscle impacts muscle mass, metabolic homeostasis, systemic inflammation, and epithelial senescence. Cell Metab. 2017; 25:1374–89. e6.
36. Favaro G, Romanello V, Varanita T, Andrea Desbats M, Morbidoni V, Tezze C, et al. DRP1-mediated mitochondrial shape controls calcium homeostasis and muscle mass. Nat Commun. 2019; 10:2576.
37. Liu YJ, McIntyre RL, Janssens GE, Houtkooper RH. Mitochondrial fission and fusion: a dynamic role in aging and potential target for age-related disease. Mech Ageing Dev. 2020; 186:111212.
38. Del Campo A, Jaimovich E, Tevy MF. Mitochondria in the aging muscles of flies and mice: new perspectives for old characters. Oxid Med Cell Longev. 2016; 2016:9057593.
39. Del Campo A, Contreras-Hernandez I, Castro-Sepulveda M, Campos CA, Figueroa R, Tevy MF, et al. Muscle function decline and mitochondria changes in middle age precede sarcopenia in mice. Aging (Albany NY). 2018; 10:34–55.
40. Sayed RK, de Leonardis EC, Guerrero-Martinez JA, Rahim I, Mokhtar DM, Saleh AM, et al. Identification of morphological markers of sarcopenia at early stage of aging in skeletal muscle of mice. Exp Gerontol. 2016; 83:22–30.
42. Crupi AN, Nunnelee JS, Taylor DJ, Thomas A, Vit JP, Riera CE, et al. Oxidative muscles have better mitochondrial homeostasis than glycolytic muscles throughout life and maintain mitochondrial function during aging. Aging (Albany NY). 2018; 10:3327–52.
43. Schiaffino S, Dyar KA, Ciciliot S, Blaauw B, Sandri M. Mechanisms regulating skeletal muscle growth and atrophy. FEBS J. 2013; 280:4294–314.
44. Jensen CH, Kosmina R, Ryden M, Baun C, Hvidsten S, Andersen MS, et al. The imprinted gene delta like non-canonical notch ligand 1 (Dlk1) associates with obesity and triggers insulin resistance through inhibition of skeletal muscle glucose uptake. EBioMedicine. 2019; 46:368–80.
45. Wang M, Tan Y, Shi Y, Wang X, Liao Z, Wei P. Diabetes and sarcopenic obesity: pathogenesis, diagnosis, and treatments. Front Endocrinol (Lausanne). 2020; 11:568.
46. Bonetto A, Andersson DC, Waning DL. Assessment of muscle mass and strength in mice. Bonekey Rep. 2015; 4:732.
47. Mankhong S, Kim S, Moon S, Kwak HB, Park DH, Kang JH. Experimental models of sarcopenia: bridging molecular mechanism and therapeutic strategy. Cells. 2020; 9:1385.
49. Romanello V, Sandri M. Mitochondrial quality control and muscle mass maintenance. Front Physiol. 2016; 6:422.