

 PDF
PDF Citation
 Print
Print


INTRODUCTION
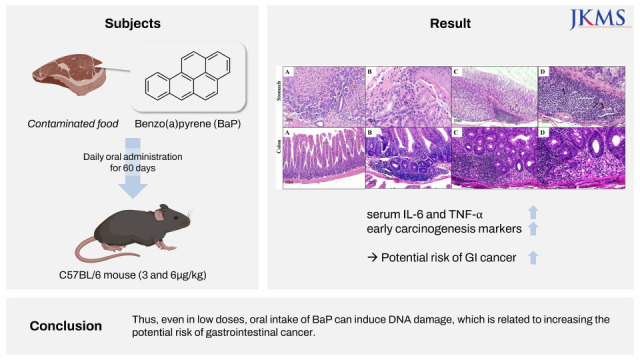
Benzo(a)pyrene (BaP) and other polycyclic aromatic hydrocarbons are environmental pollutants generated from the incomplete combustion of organic matters, found in red meats, charcoal-grilled food, and fatty foods.12 Human exposure to BaP is through dietary intake, contaminated food, and cooking processes such as grilling, barbecuing, and deep-frying.34 Metabolic activation of BaP can induce genotoxic effects, which contribute to genomic instability5 and gene mutations,6 causing extensive DNA damage and forming DNA adducts. Thus, the association between these levels of DNA damage and digestive system toxicity effects is an essential key to understanding the risk of cancer in the digestive system of BaP-DNA adducts caused by daily intake of food contamination. Notably, during the gastrointestinal carcinogenic process of humans or animals, tumor suppressor (p53), tumor transcription factor (nuclear factor [NF]-κB), and mucin glycoprotein (MUC) expressions can change, and altered MUC expression has proven to be a indicator for adverse outcomes associated with various cancer.
This study aims to confirm oral intake of low doses of BaP and its induced DNA adducts formation in the stomach and colon and the expression levels of the carcinogenic biological indicators in the gastrointestinal tract to understand the risk of stomach and colorectal cancer. Cancer-related inflammation, oxidative stress, NF-κB, tumor suppressor marker (p53), β-catenin, and mucin are mainly targeting biomarkers to evaluate the early carcinogenetic development risks in the colon and stomach following oral intake-BaP (3 and 6 µg/kg) for 60 days.
Go to : 
METHODS
Animals
All chemicals, including BaP, were ordered from Sigma-Aldrich (St. Louis, MO, USA). Male C57BL/6 (6 weeks old, 23 ± 2 g) mice were ordered from Vital-River Lab (VRL) company (Beijing, China). All animals were housed following the standard animal laboratory conditions:12-hour day/night cycles, humidity 50 ± 10%, temperature 25 ± 1°C. Animals were provided with a standard drinking water and chow diet. The experiment was conducted after one week of the adaptation period.
Experimental design
Mice were divided into the following four groups (seven per group): 1) blank group (only water), 2) control group (vehicle, corn oil only), 3) medium-dose exposure BaP group (3 µg/kg), and 4) high-dose exposure BaP group (6 µg/kg). All animals were administered a daily dose (in 0.2 mL corn oil) by oral administration for 60 days. The mice were sacrificed, and all tissues of interest (liver, stomach, heart, lung, spleen, and testis) were collected from every mouse.
Tissue homogenization
All the collected tissues were cleaned by washing with 1× phosphate-buffered saline (PBS) buffer. The cleaned tissues were washed three times with water and were homogenized in 1× PBS buffer (1:3, W/V). The homogenization treatment with an ultrasonic probe was conducted in an ice bath for the 20 seconds. All tissue homogenates were stored as aliquots at −80°C before analysis.
Immunoassay of DNA adducts
BaP-induced DNA adduct levels were determined using an enzyme-linked immunosorbent assay (ELISA) kit (OxiSelect™ BPDE-DNA Adduct Elisa Kit; Cell BioLabs, San Diego, CA, USA). BPDE-DNA adducts were quantified by comparison with a known standard curve formula following the manufacturer’s instructions. DNA was extracted from 2 mL aliquots of tissue homogenate using a commercial DNA extraction kit (Animal Tissues/Cells Genomic DNA Extraction Kit; SolarBio, Beijing, China). The extracted DNA sample was diluted to 4 µg/mL with 1× Tris ethylenediaminetetraacetic acid buffer. The DNA samples (50 µL) and standards were transferred to 96-well plates, mixed, and incubated at room temperature (20–25°C) overnight on an orbital shaker. The plates were then washed twice with PBS. The anti-BPDE-I antibody (100 µL) was added, incubated for 1 hour, and washed 5 times. Next, 100µL of secondary antibody-horseradish peroxidase (HRP) conjugate was added, and the plates were incubated for 1 hour. The plates were then washed 5 times. After adding 100 µL of stop solution, the optical density was 450 nm. Unknown samples were analyzed in triplicate.
Histological examination
The stomach and colon tissues were washed with saline three times and fixed with 10% neutral formalin. Tissue samples were stored at 4°C for later analysis. The paraffin blocks of tissue were prepared at room temperature, and the sections were carefully cut at a thickness of 4–6 µm for analysis. A histological evaluation was performed after hematoxylin and eosin staining.
Interleukin (IL)-6 and tumor necrosis factor (TNF)-α in mouse serum
IL-6 Quantikine ELISA Kit (M6000B; R&D Systems, Minneapolis, MN, USA) and mouse TNF-α Quantikine ELISA Kit (MTA00B; R&D Systems) were used to detect the expression of IL-6 and TNF-α in serum, respectively. The test steps were operated according to the instructions of the kit.
The absorbance value was obtained at the wavelength of 450nm using enzyme-labeling instrument, and the standard curve was used to calculate the corresponding concentration value.
Western blot and immunohistochemical staining
Western blot assay detected IL-6, NF-κB, p53, superoxide dismutase 1 (SOD1), β-catenin, MUC1, and MUC2 in the stomach and colon. The 100 mg of mice colon or stomach tissue was prepared to homogenize, centrifuged at low temperature(−4°C), and then the supernatant was collected. Tissue proteins were calculated using Bradford protein assay, loaded with 10% sodium dodecyl sulfate-polyacrylamide gel electrophoresis gel to detect. The primary monoclonal antibodies used p53 (Anti-p53 Mouse mAb; Service, Shanghai, China), SOD1 (Superoxide Dismutase 1 Rabbit pAb; Service), NF-κB (NF-κB p65 Rabbit pAb; Service), IL-6 (IL-6 Rabbit pAb; ServiceBio, Shanghai, China), MUC2 (Anti-MUC2 Rabbit pAb; ServiceBio), MUC1 (Anti-MUC1 Rabbit pAb; ServiceBio) and β-catenin (β-catenin Mouse mAb; ServiceBio). These primary antibody dilutions were 1:1,000. The second antibodies were used by p53 (HRP Goat Anti-Mouse [IgG]; Service), SOD1 (HRP Goat Anti-Rabbit [IgG]; ServiceBio), NF-κB (HRP Goat Anti-Rabbit [IgG]; ServiceBio), IL-6 (HRP Goat Anti-Rabbit [IgG]; ServiceBio), MUC1 and MUC2 (HRP Goat Anti-Rabbit [IgG]; ServiceBio), β-catenin (HRP Goat Anti-Mouse [IgG]; ServiceBio). The 5 µm thin sections of fixed tissue were prepared for immunohistochemical staining assay. The slides were deparaffinized with xylene and rehydrated in graded ethanol series solutions. Heat-based antigen retrieval of experimental conditions with an autoclaving temperature at 121°C for 15 minutes was used to pre-treat the sections in 0.01 mol/L citrate buffered saline (pH 6.0). The sections were incubated at 24°C with 3% H2O2 for 30 minutes, washed with 1× PBS, and blocked with 10% normal goat serum for 1h at room temperature to block nonspecific binding of the immunological reagents. After incubation with primary and second antibodies at 4°C overnight, HRP and streptavidin-biotin complex were applied in the immunohistochemistry procedure, which visualizes the reaction products. The nuclear counterstaining was performed with Mayer’s hematoxylin solution.
Data analysis
SPSS 25.0 software (IBM Corp., Armonk, NY, USA) was used to process the data, and a t-test was used to compare the samples between groups. The data were expressed as mean ± standard deviation. The statistical significance was performed using analysis of variance (ANOVA) followed by the Student-Newman-Keuls test which was considered significant at P ≤ 0.05.
Ethics statement
All animal care and experimental procedures were approved by the Xinxiang Medical University Institutional Animal Care and Use Committee (IACUC) (approval date: Aug 6, 2019, No. 2019005A).
Go to :
RESULTS
Immunoassay of DNA adducts
The increase of BaP during DNA adducts formation was observed in the colon, stomach, liver, testis, lung, heart, and kidney, after daily oral intake of BaP (3 and 6 µg/kg) for 60 days. The formation of DNA adducts levels observed in each tissue were ordered as follows: colon > stomach > liver > testis > lung > heart > kidney (Table 1).
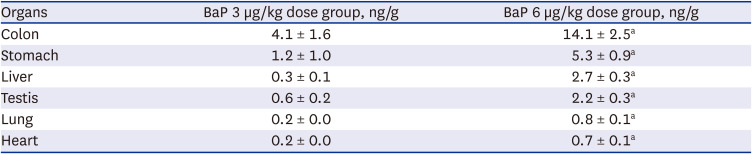
Table 1
Comparison of BaP−DNA adduct formation on main types of tissues following 3 and 6 µg/kg BaP of oral administration for 60 days
BaP = benzo(a)pyrene.
aP < 0.001, 6 µg/kg BaP dose group compared to mice treated with 3 µg/kg BaP dose group.
![]()
Histological examination
Histopathological changes in the stomach and colon of mice treated with BaP were evaluated by H&E staining (Fig. 1). Mice have daily orally administrated BaP (3 and 6 µg/kg) for 60 days. Compared with the control (Fig. 1), a large number of cell infiltration in the stomach and the colon of 3 µg/kg of the group and mononuclear cells, inflammatory cells, and multifocal cells in the stomach and the colon of 6 µg/kg of the group were observed. In addition, acute villous injury and atrophy with edema fluid accumulation in the lumen were frequently observed in the colon following orally administrated BaP 6 µg/kg of mice.
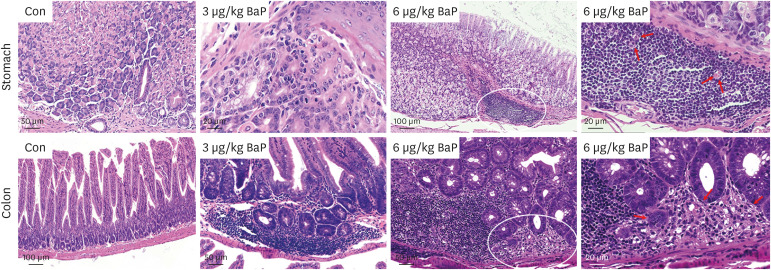 | Fig. 1Histopathological changes in the stomach and colon of mice after daily oral intake of 3 or 6 µg/kg BaP for 60 days, respectively. No histologic damage in the stomach and colon is observed in mice with vehicle controls. A large number of cell infiltration and inflammatory cells of the stomach, parts of the crypts cells destroyed, and the surface epithelium damaged in the colon are observed following oral intake of 3 µg/kg BaP, respectively. The inflammatory cells are induced by oral intake of 6 µg/kg BaP. The mononuclear cells, and multifocal cells in the stomach and the colon are induced following oral intake of 6 µg/kg BaP, in which the crypts cells destroyed in the colon are observed.BaP = benzo(a)pyrene.
|
Expression of IL-6 and TNF-α in serum
Table 2 shows that compared with the control group, the expression of serum IL-6 and TNF-α of the BaP group was significantly higher (P = 0.012 and P = 0.003). The serum IL-6 and TNF-α of the BaP 6 µg/kg group were considerably higher than the BaP 3 µg/kg group (P = 0.009 and P = 0.002).
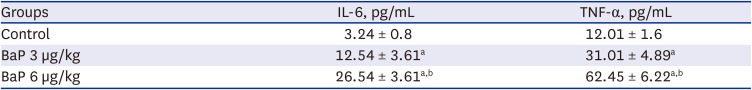
Table 2
Expression of IL-6 and TNF-α in serum of mice in each group
| Groups | IL-6, pg/mL | TNF-α, pg/mL |
|---|---|---|
| Control | 3.24 ± 0.8 | 12.01 ± 1.6 |
| BaP 3 µg/kg | 12.54 ± 3.61a | 31.01 ± 4.89a |
| BaP 6 µg/kg | 26.54 ± 3.61a,b | 62.45 ± 6.22a,b |
IL = interleukin, TNF = tumor necrosis factor, BaP = benzo(a)pyrene.
aVersus the control group, the difference is statistically significant (P < 0.05), bThe BaP 6 µg/kg group vs. the BaP 3 µg/kg group, the difference is statistically significant (P < 0.05).
![]()
IL-6, NF-κB, p53, SOD1, β-catenin, MUC1, and MUC2 in the colon
The immunohistochemical staining assay detected a high-frequency expression of IL-6, SOD1, NF-κB, β-catenin, p53, MUC 1, and MUC 2 proteins in the tissues (colon, stomach) (Figs. 2 and 3) after being treated with BaP. WB analysis was used to detect the expression difference of their proteins in the stomach and colon (Figs. 4 and 5). The results showed that there was a significant dose-dependently increase in IL-6, SOD1, NF-κB, β-catenin, and MUC1 in the stomach and colon, respectively (Fig. 4A and B). The expression of IL-6, SOD1, NF-κB, β-catenin of the BaP 3 µg/kg group was significantly higher than the control group (P < 0.001, P = 0.007, P < 0.001, and P =0.013) in the stomach, and in colon (P < 0.001), respectively. In addition, compared with the BaP 3 µg/kg group, the expression of those of the BaP 6 µg/kg group was increased significantly in the stomach (P = 0.001, P = 0.022, P = 0.017, and P = 0.021) and the colon (P = 0.007, P =0.006, P = 0.003, and P < 0.001). MUC1 and MUC2 were expressed in epithelial cells membrane, cytoplasm, and perinuclear cell membrane border, and p53 was expressed in epithelial cells nuclei and cytoplasm (Fig. 3). MUC1 was a significant dose-dependently increased compared with the control group (Fig. 5B and F).
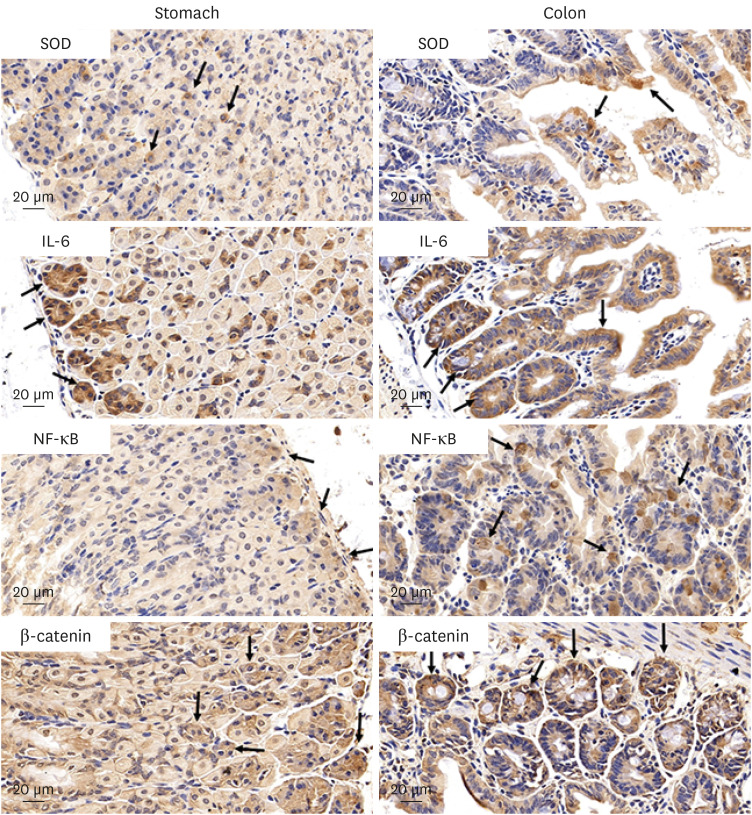 | Fig. 2Histologic expression of the antioxidant enzyme, the pro-inflammatory oncogenic cytokine, the tumor transcription factor, and the Wnt signaling cascade regulator of stomach and colon tissues are detected using immunohistochemical stains after daily oral intake of BaP for 60 days. SOD, IL-6, NF-κB, and β-catenin are expressed (yellowish-brown color) in the stomach and colon of mice, respectively.BaP = benzo(a)pyrene, SOD = superoxide dismutase, IL = interleukin, NF = nuclear factor.
|
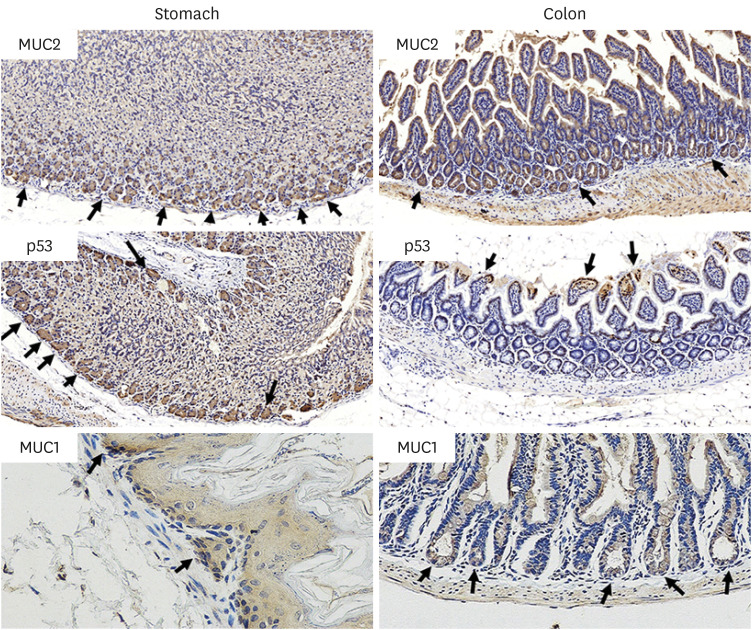 | Fig. 3Histologic expression of the indicator cancer markers: MUC2, p53, and MUC1 in stomach and colon tissues, are detected by using immunohistochemical stains after daily oral intake of BaP for 60 days. MUC2, p53, and MUC1 in the stomach and colon of mice, respectively.MUC = mucin glycoprotein, BaP = benzo(a)pyrene.
|
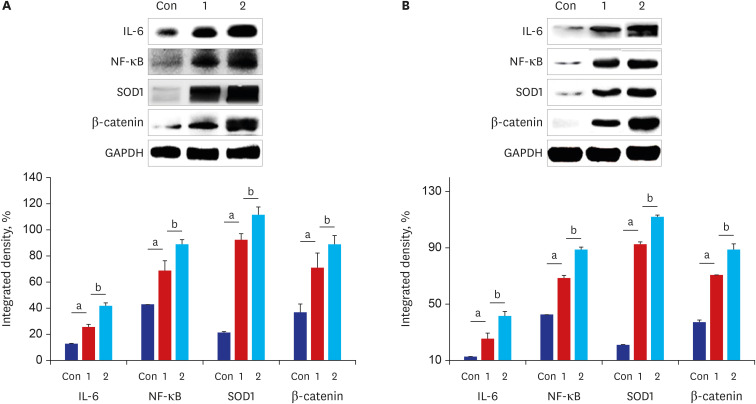 | Fig. 4Expression levels of the antioxidant enzyme, the pro-inflammatory oncogenic cytokine, the tumor transcription factor, and the Wnt signaling cascade regulator in the stomach and the colon tissue of mice are induced (n = 8). The stomach and the colon tissue were collected from mice after daily oral intake of BaP for 60 days. (A) Performing western blot analysis of IL-6, NF-κB, SOD1, β-catenin using antibodies and this graph illustrating the changes in the levels of IL-6, NF-κB, SOD1, β-catenin in the stomach were evaluated and compared to oral intake of controls vehicle (Con) and 3 µg/kg BaP (1) or 6 µg/kg BaP (2). (B) Performing western blot analysis of IL-6, NF-κB, SOD1, β-catenin in the colon tissues, and these graphs illustrating the changes in the levels of those were evaluated and compared. The densitometric values were normalized to levels of GAPDH expressed in each group. All data expressed the mean ± standard deviation of eight mice in each group.
aCompared to the control mice, the difference was statistically significant (P < 0.05); bCompared to mice between oral intake of 3 µg/kg BaP and 6 µg/kg BaP, the difference was statistically significant (P <0.05).
BaP = benzo(a)pyrene, IL = interleukin, NF = nuclear factor, SOD = superoxide dismutase, GAPDH = glyceraldehyde 3-phosphate dehydrogenase.
|
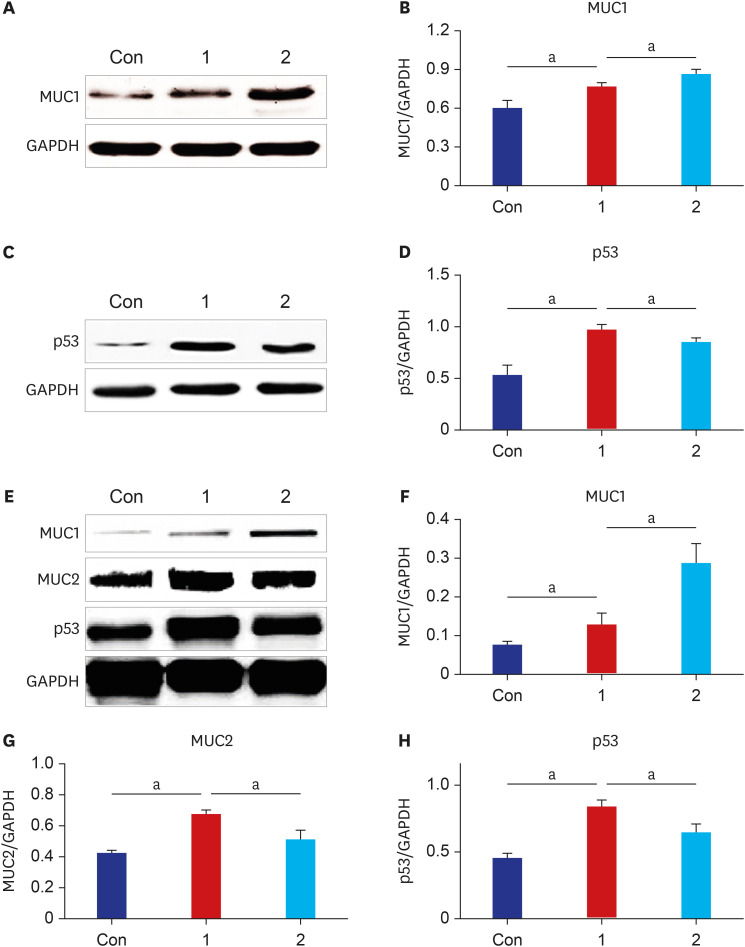 | Fig. 5Expression levels of the indicator cancer markers: MUC1, p53, and MUC2 in the stomach and the colon tissue of mice are induced (n = 8). The stomach and the colon tissue were collected from mice after daily oral intake of BaP for 60 days. (A) Performing western blot analysis of MUC1 using antibodies. (B) These graphs illustrate the changes in the levels of MUC1 in the stomach of each group; (C) Performing western blot analysis of p53 using antibodies, and (D) these graphs illustrate the changes in the levels of p53 in the stomach were evaluated and compared to oral intake of controls vehicle (Con) and 3 µg/kg BaP (1) or 6 µg/kg BaP (2). (E) Performing western blot analysis of MUC1, MUC2, and p53 in the colon tissues. (F, G, H) The graphs illustrating the changes in MUC1, MUC2, and p53 levels were evaluated and compared. The densitometric values were normalized to levels of GAPDH expressed in each group. All data expressed the mean ± standard deviation of eight mice in each group.MUC = mucin glycoprotein, BaP = benzo(a)pyrene, GAPDH = glyceraldehyde 3-phosphate dehydrogenase.
aThe difference was statistically significant (P < 0.05).
|
MUC1 of the BaP 3 µg/kg group was higher than the control group in the stomach and the colon (P = 0.018 and P = 0.046), and compared with MUC1 of the BaP 3 µg/kg group, the BaP 6 µg/kg group was increased in the stomach and the colon (P = 0.037 and P = 0.008). The expression of p53 of the BaP 3 µg/kg group was increased than that in the control group of the stomach (P = 0.001) and the colon (P < 0.001), and compared with p53 of the BaP 3 µg/kg group, the BaP 6 µg/kg group was decreased in the stomach (P = 0.021) and the colon (P = 0.005) (Fig. 5D and H). We are also very interested in the altered expression of MUC2 in goblet cells of the colon (Fig.5E and G). The results showed that MUC2 expression in the 3 µg/kg BaP of the colon was significantly increased than that of control groups (P < 0.001). However, compared to 3 µg/kg BaP, the 6 µg/kg BaP group significantly decreased (P = 0.009) (Fig. 5E and G), and the low expression of MUC2 in the stomach was not detected in the Western blotting experiment.
Go to :
DISCUSSION
BaP is the main environmentally hazardous and carcinogenic polycyclic aromatic hydrocarbons (PAH) family and is also known to cause contamination during cooking, such as during charcoal grilling of food, via cooking oil fumes, and cuisine of foods rich in fat and red meats. BaP levels in smoked dried beef (5.47 mg/kg), fried chicken (5.25–5.55 BaP mg/kg), and potato chip (4.06 mg/kg) are high.5 The national estimated average dietary exposure range was 8 µg/kg BaP.6 Moreover, the investigation of PAH in Chinese tea sold in Nigeria found the intake of BaP ranged from 66 to 145 µg/kg, exceeding the allowable daily intake limit of BaP.7 In the experimental dose-design of animal models, BALB/C mice were an oral intake of 125 mg BaP/kg/day and 2.5% DSS (BaP/DSS) to induce colorectal cancer.8
BaP-induced DNA adducts require genotoxicity and cancer initiation by altering gene expression profiles. After oral administration of BaP (75 and 125 mg/kg/day), the high-level formatted DNA adducts were observed in the colon and stomach in the LacZ transgenic mouse.9 In this study, the BaP-DNA adduct also was formed mainly in the colon and stomach of C57BL/6, indicating that even a low dose of BaP can form high-level adducts in the colon and stomach. It should be noted that the digestive system (colon and stomach) showed high levels of DNA adducts.
DNA lesions and mutations are associated at every concentration. Even low levels of DNA damage make the repair inadequate10 to induce cellular senescence.11 The present study performed an immunohistochemical evaluation of cancer biomarkers for the colon and stomach. These results indicated significant changes in the level of pro-inflammatory oncogenic cytokine (IL-6), antioxidant enzyme (SOD1), a pro-transcription activator of Wnt signaling cascade (β-catenin), and the dynamic tumor transcription factor (NF-κB). There was a high correlation between the overexpression of the potential prognostic factor, β-catenin, and the progression of colorectal cancer from normal epithelial tissue, polyps, and adenomas to carcinomas in colorectal cancer patients 1213 and levels of SOD and IL-6 were closely related to cancer risk.1415 The results confirmed that oral intake of low doses-BaP caused harmful effects by inducing DNA adducts by increasing the inflammation (i.e., IL-6) and oxidative stress (i.e., SOD1) in the stomach and colon.
Significant risk factors for cancer include genes for tumor suppressor (p53) and NF-κB, which are known to contribute to several pathways, including cellular apoptosis (controlling cell death), DNA repair, cell division, and proliferation, metastasis, and angiogenesis.16 Since the critical tumor suppressor p53 is involved in damage response during early diagnosis of carcinogenesis,1718 it is an excellent early expression gene marker. In addition, tumor suppressor p53 prevents tumor invasion and the progression of lung cancer,19 and mutant p53, together with the loss of wild-type p53, can accelerate the metastasis in colorectal cancer through the inflammatory pathways.20 Thus, anticancer drugs effectively increase the expression of p53 by which mechanism related to inhibition of anti-apoptotic protein (Bcl-2) expression to delay tumorigenesis in BaP-induced colorectal cancer.21 Furthermore, it is co-regulated with targets of NF-κB in tumor-associated macrophages and can drive pro-inflammatory cytokine induction,22 such as that of IL-6 and TNF-α. NF-κB activation enhances cancer cell proliferation, and survival β-catenin regulates NF-κB activity in primary colorectal cancers23 as a pro-transcription activator. Therefore, the present study’s overexpression of NF-κB, p53, IL-6, TNF-α, β-catenin (Wnt signaling cascade), which are confirmed to involve in the biological pathways, indicate oral intake of a low dose of BaP and its DNA adducts formations could be significantly correlated with cancer risk potential. To the best of our knowledge, there have been no immediate reports of the relationship between BaP and MUC in gastrointestinal tissues. During the gastrointestinal carcinogenic process, MUC expressions can change, and altered MUC expression has proven to be a indicator of adverse outcomes associated with various cancers (e.g., breast, lung, gastric, etc.).2425 MUC 1 contributes to the colon goblet cells metaplasia, and MUC2 is the mainly high-level product of the colon goblet cells. Thus, we are mostly interested in whether frequent/long-term exposure to low oral doses of BaP could alter MUC expression to increase the risk of cancer development. Pope et al.26 reported that decreased goblet cell number decreases MUC 2 in the colon, suggesting BaP 6 µg/kg was more harmful to the colon cells than 3 µg/kg, resulting in decreased MUC 2 expression in BaP 6 µg/kg groups (Fig. 5). The overexpression of MUC1 suggests that MUC1 can be rendered as an antibody-based therapeutic target27 and inhibiting MUC1 expression also could suppress cancer cell migration as a novel therapeutic approach to pancreatic cancer treatment.28 The overexpression of MUC1 was directly associated with the apoptosis pathway29 and gastric cancer,30 indicating it could be considered a high-risk factor for the prognosis of gastrointestinal carcinoma. Szlendak et al.31 reported that decreased expression of MUC2 secreted gel-forming mucin is generally observed in colorectal adenocarcinoma, while increased expression of MUC1 was observed in colorectal cancer, indicating low oral doses of BaP could alter MUC expression via colonic injury. Moreover, acute villous injury and atrophy with edema fluid accumulation in the lumen, the mononuclear cells, inflammatory cells, and multifocal cells in the stomach and the colon of mice were investigated following oral intake of BaP for 60 days, suggesting these altered expressions could be contributed to early cancer development risk potential.
In conclusion, frequent/long-term exposure to low oral doses of BaP via food contamination could result in toxic biological effects, cellular damage, and gastrointestinal damage to increase the risk of cancer development. This study will provide a scientific basis for researching environmental contaminated food and intestinal health following daily oral administration of low doses of BaP.
Go to :
 XML Download