INTRODUCTION
METHODS
Animals and treatment
Cell culture and treatment
Construction of TM3 stable cells with fancd2os overexpression or gene silencing
Total RNA extraction and RT-PCR
Immunohistochemistry and immunofluorescence
Testosterone concentration assay
Detection of apoptosis
Western blots
Statistical analysis
RESULTS
Fancd2os is highly expressed in the testes and is primarily located in murine Leydig cells
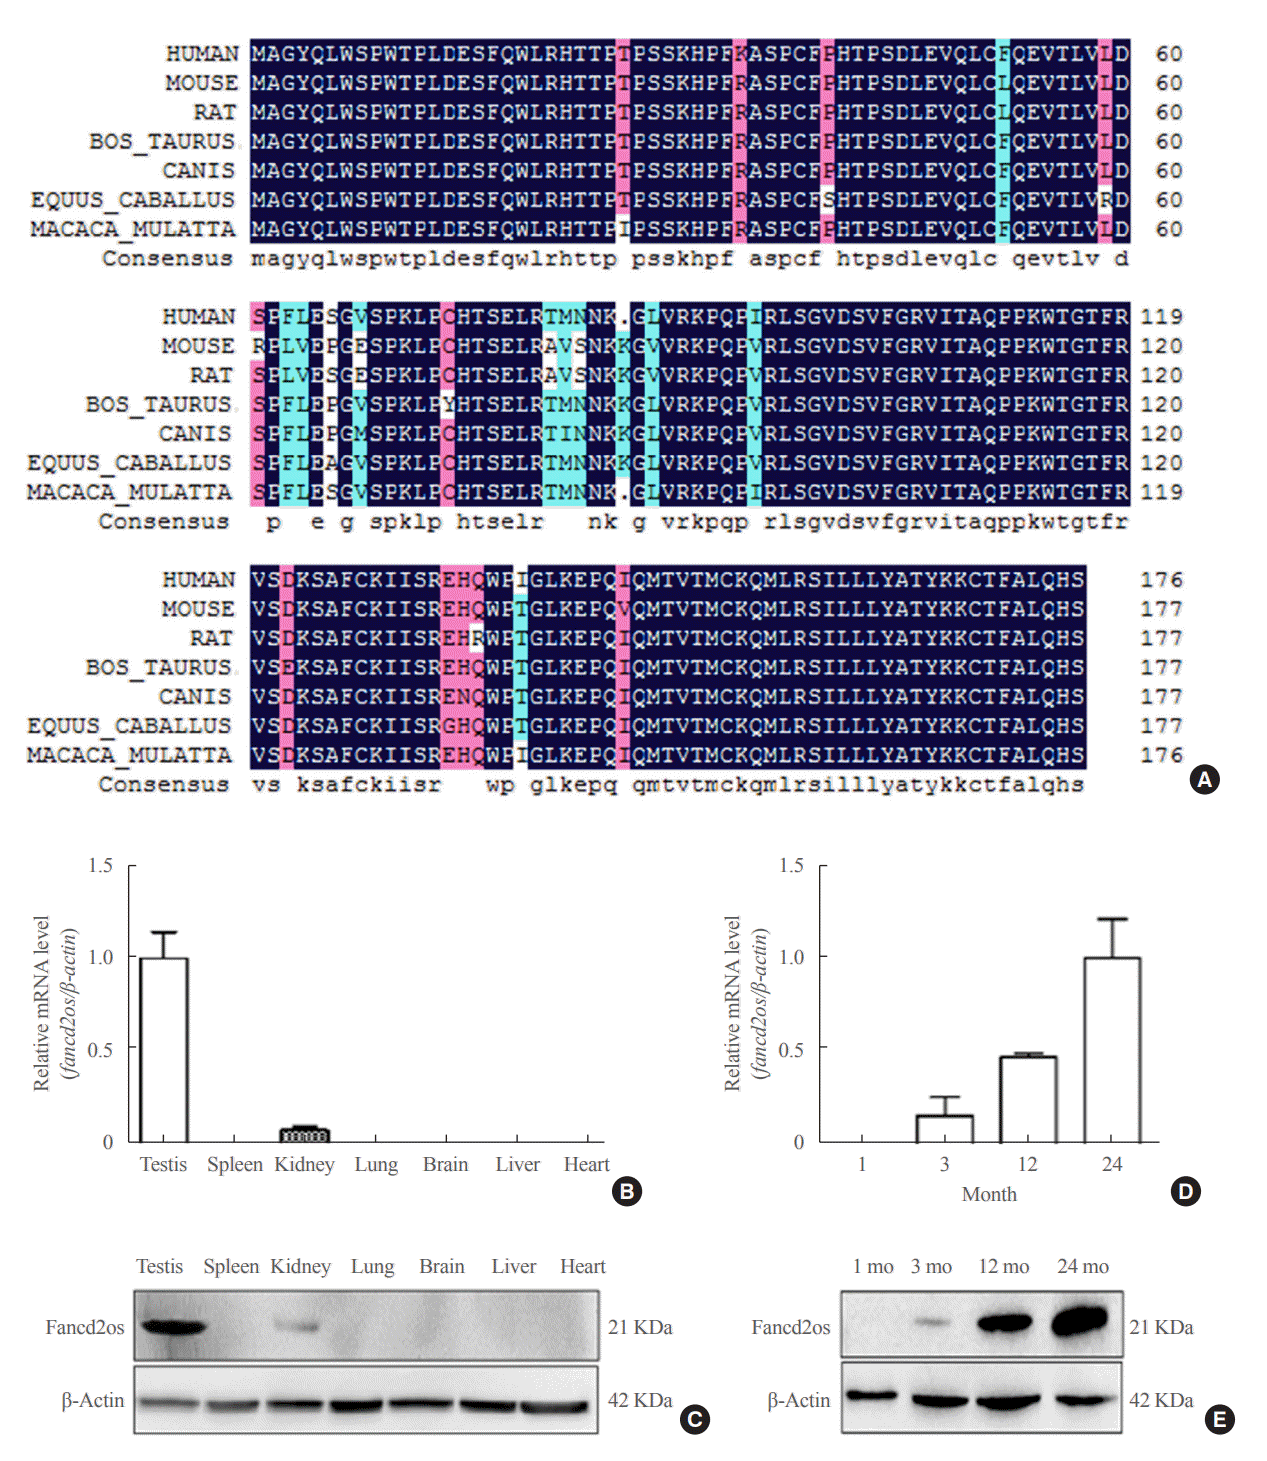 | Fig. 1.The expression of Fancd2 opposite-strand (Fancd2os) in a panel of mouse tissues and its temporal expression in developing mouse testes. (A) Alignment of the amino acid sequence of Fancd2os in mice (NP_081909.2), humans (NP_001158311.1), rats (NP_001102721.1), Macaca mulatta (NP_001181271.1), Bos taurus (NP_001070589.1), Equus caballus (XP_023475748.1), and Canis lupus (XP_
005632228.1). The alignment was performed by DNAMAN (Lynnon). Homology levels are highlighted in different colors: black, 100%; pink, 75%; blue, 50%. (B, C) The tissue distribution of Fancd2os mRNA in adult mice was analyzed by (B) quantitative real-time polymerase chain reaction (RT-PCR) and (C) Western blots. (D, E) The mRNA and protein levels of Fancd2os in the testes from juvenile, young, middle-aged, and aged mice were detected by quantitative RT-PCR and Western blots. β-Actin served as a loading control. Each assay was repeated three times with similar results. Each number represents the age of the mice. |
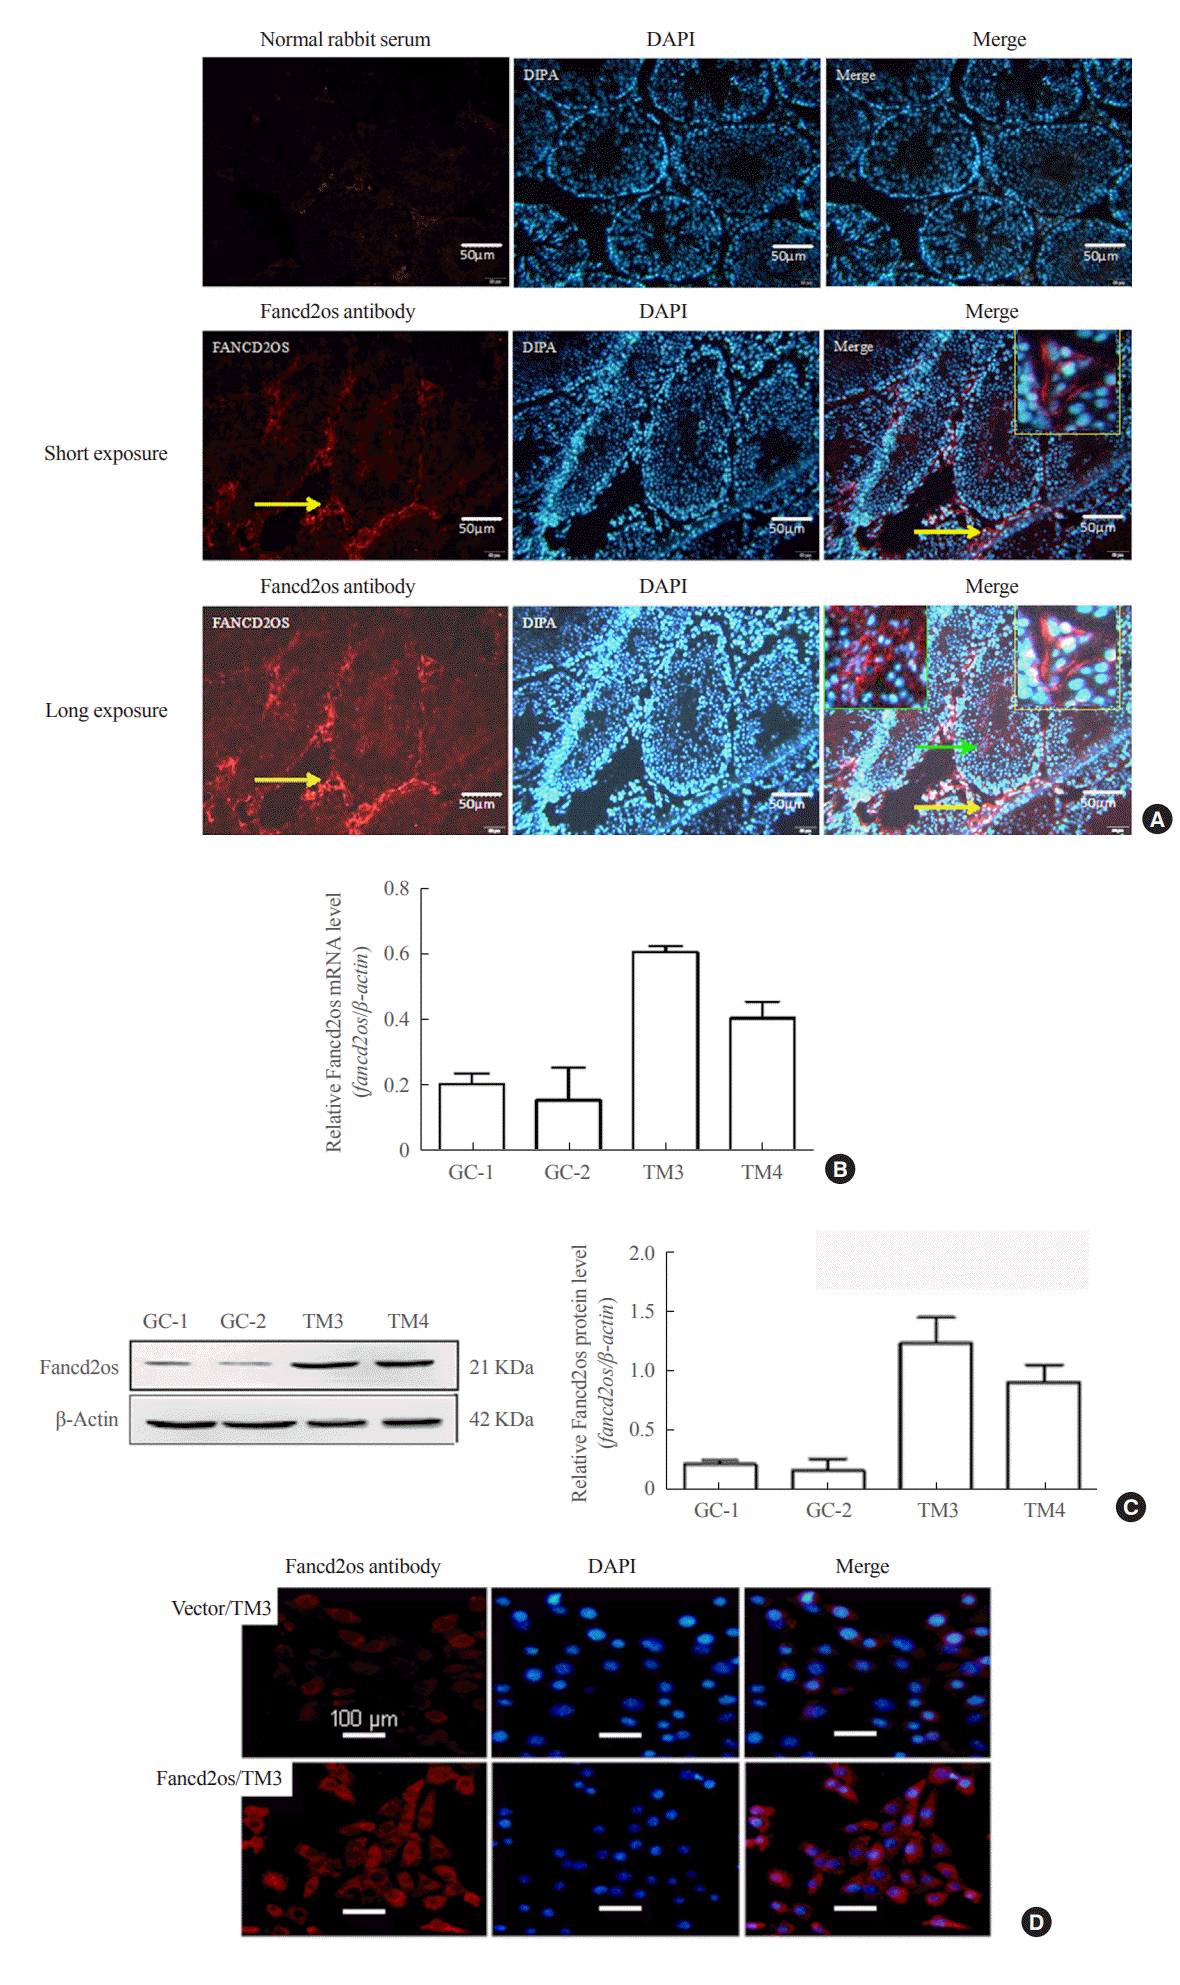 | Fig. 2.Fancd2 opposite-strand (Fancd2os) is primarily distributed in mouse testicular Leydig cells and localized in the cytoplasm. (A) Immunofluorescence analysis was performed with an anti-Fancd2os polyclonal antibody (bottom panel) to detect the localization of Fancd2os in adult mouse testes. A negative control was performed using rabbit immunoglobulin G (upper panel). The yellow arrows indicate Fancd2os-positive cells, and the yellow boxes represent the magnified field of view. The green arrows indicate Fancd2os-positive cells in seminiferous tubule, and the green boxes represent the magnified field of view. Scale bars represent 50 μm. (B, C) The cellular distribution of Fancd2os mRNA and protein in four mouse testes-related cell lines were measured by (B) quantitative real-time polymerase chain reaction and (C) Western blots. β-Actin served as a loading control. Each assay was repeated three times with similar results. (D) TM3 cells that stably expressed Fancd2os were subjected to immunofluorescence analysis with an anti-Fancd2os antibody followed by incubation with Alexa Fluor 546 goat anti-mouse antibody. Fluorescence signals were analyzed using confocal laser scanning microscopy. Nuclei were stained with 4′,6-diamidino-2-phenylindole (DAPI). Scale bars represent 100 μm. DAPI, dapidiamidino-phenyl-indole. |
Fancd2os reduces testosterone production in TM3 cells via the downregulation of steroidogenic enzymes
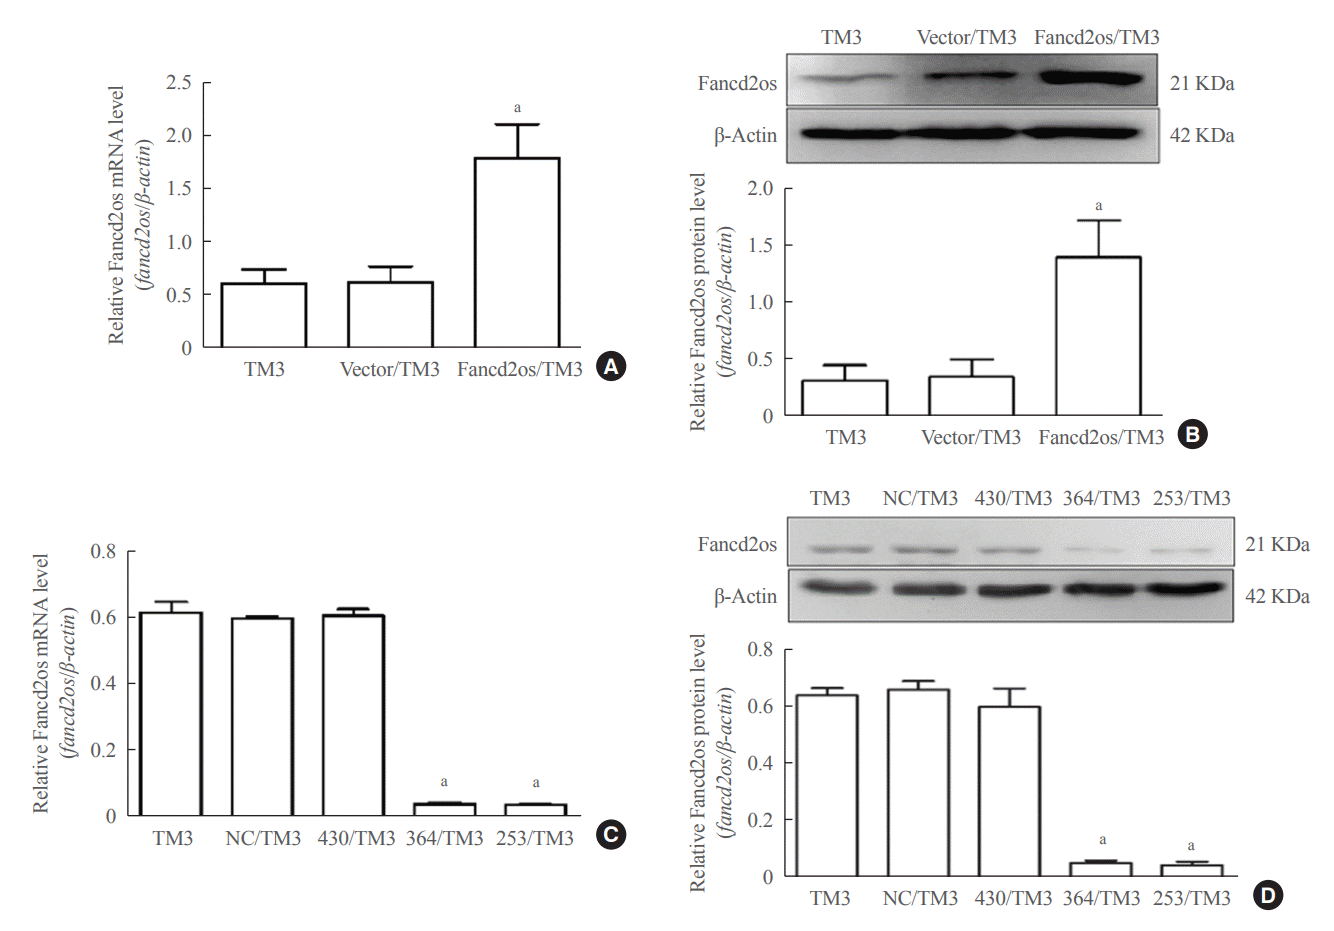 | Fig. 3.Stable Fancd2 opposite-strand (Fancd2os)-overexpressing TM3 or stable Fancd2os knockdown TM3 cells were constructed. TM3 cells were infected with Lv5(EGla-GFP/Puro)-fancd2os, LV3-fancd2os-Mus-253/364/430, or vector following puromycin screen, the stable Fancd2os/TM3 and stable Fancd2os knockdown TM3 cells were confirmed using (A, C) real-time polymerase chain reaction and (B, D) Western blots. Each bar represents the mean±standard deviation from three separate experiments. Significant difference compared to TM3, vector/TM3 or NC/TM3. aP<0.01. |
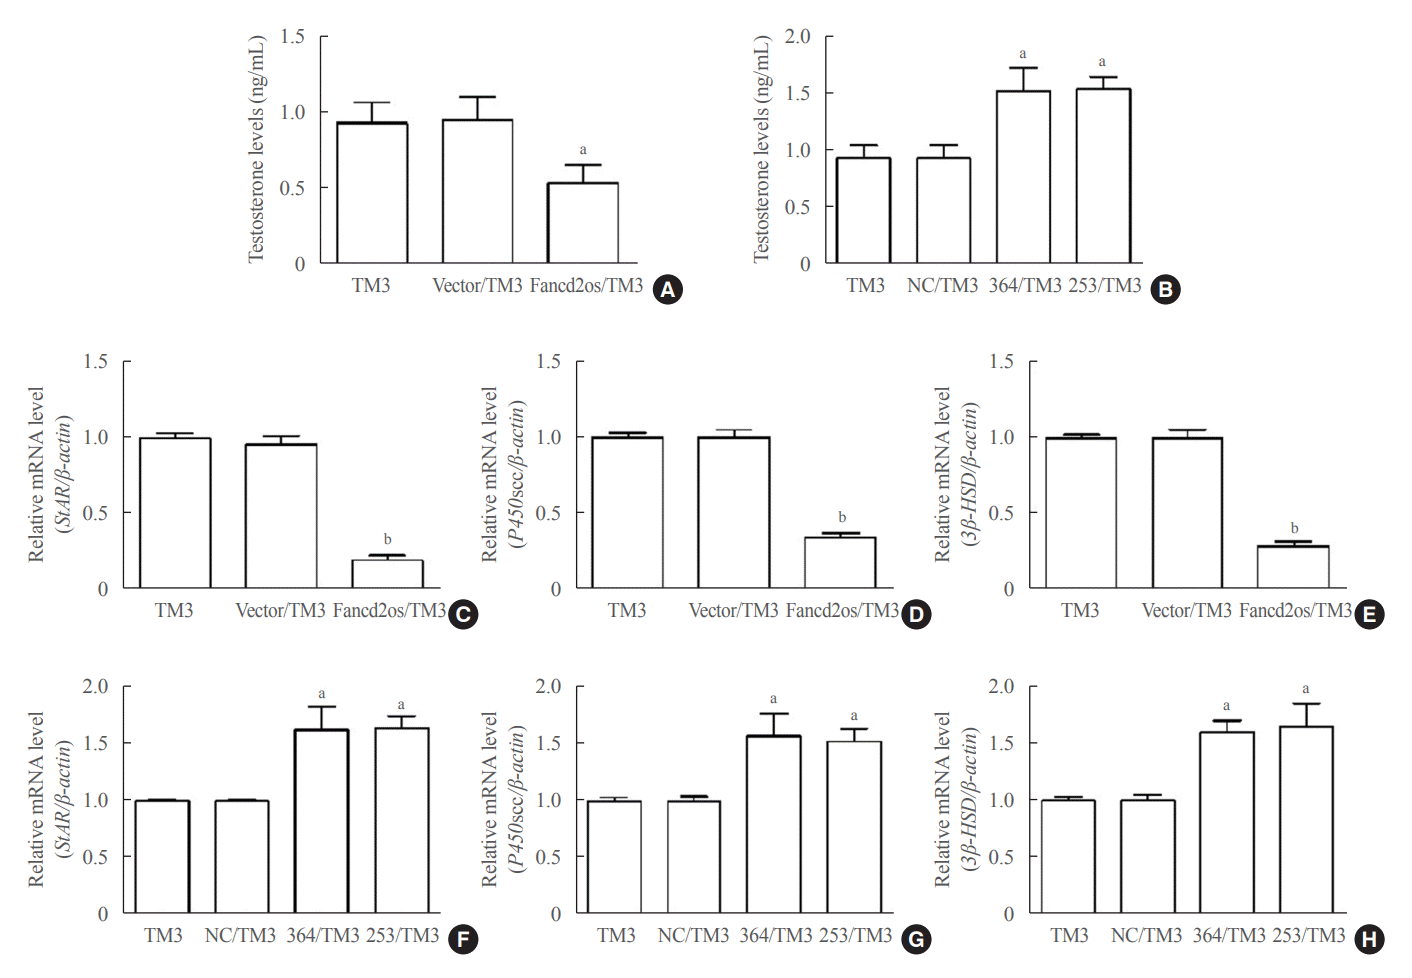 | Fig. 4.Fancd2 opposite-strand (Fancd2os) reduces testosterone production and steroidogenic enzyme expression in TM3 cells. The testosterone levels in Fancd2os-overexpressing (A) or knockdown TM3 cells (B) were detected by enzyme-linked immunosorbent assays (n=3 per group). (C, D, E) Relative quantities of mRNA expression of steroidogenic acute regulatory protein (StAR), P450 cholesterol side-chain cleavage (P450scc), and 3β-hydroxysteroid dehydrogenase (3β-HSD) in Fancd2os-overexpressing TM3 cells or Fancd2os knockdown TM3 cells (F, G, H) were determined real-time polymerase chain reaction using β-actin as a housekeeping gene. Each bar represents the mean±standard deviation from three separate experiments. Significant difference compared to TM3, vector/TM3 or NC/TM3. aP<0.05; bP<0.01. |
Fancd2os decreases testosterone levels in TM3 cells by promoting cellular apoptosis
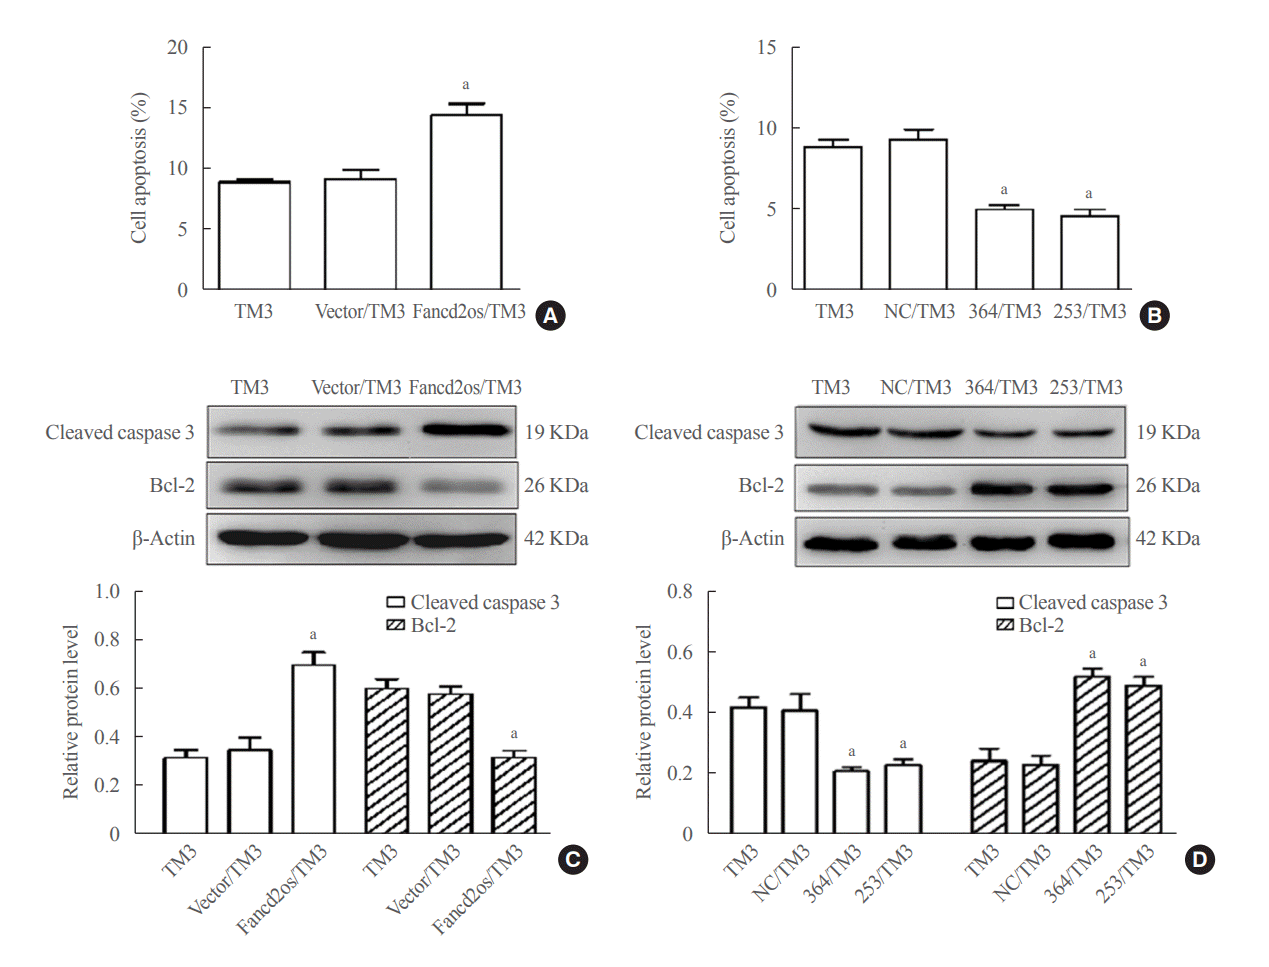 | Fig. 5.Fancd2 opposite-strand (Fancd2os) evokes cellular apoptosis and then attenuates testosterone levels in TM3 cells. Fancd2os-overexpressing (A, C) or knockdown TM3 cells (B, D) were stimulated with 20 J/m2 ultraviolet (UV) for 6 hours, and then double-stained with annexin V-fluorescein isothiocyanate (FITC) and propidium iodide for analyzing apoptosis by flow cytometry assay (A, B), and apoptosis related proteins were determined using Western blots (C, D). Each bar represents the mean±standard deviation from three separate experiments. Significant difference compared to TM3, vector/TM3, or NC/TM3. aP<0.05. |
Higher levels of Fancd2os are correlated with apoptosis and lower testosterone production in mouse testicular Leydig cells
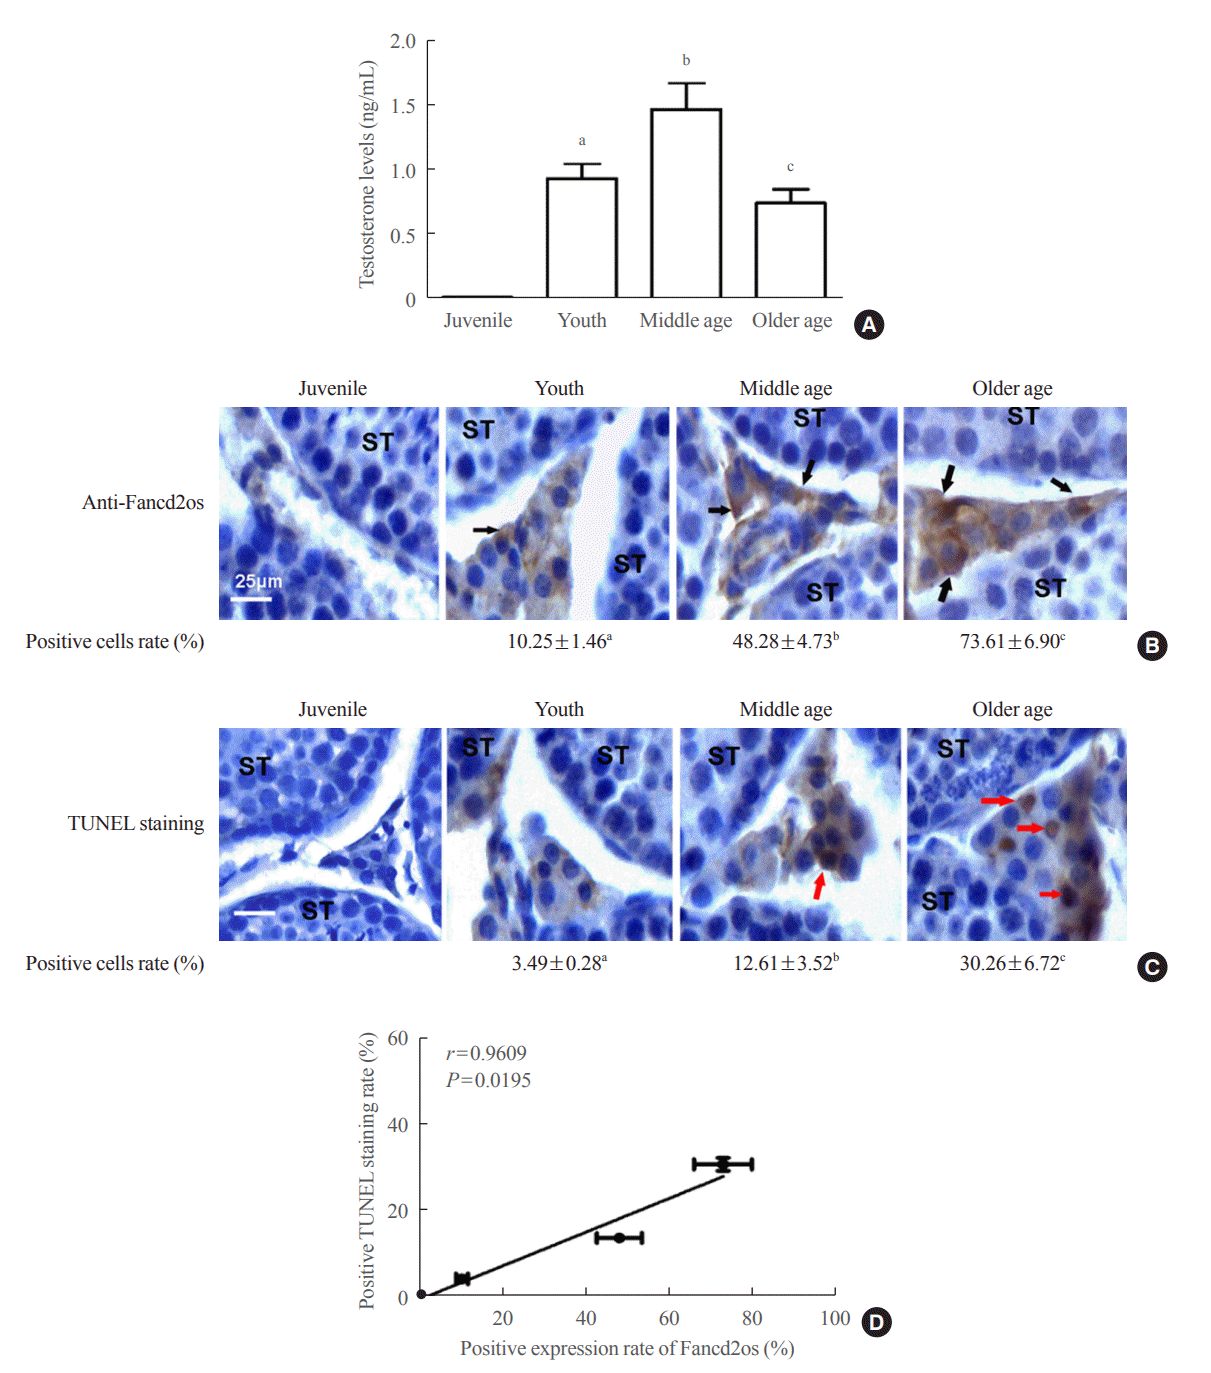 | Fig. 6.Higher Fancd2 opposite-strand (Fancd2os) levels in older mouse Leydig cells result in cellular apoptosis and lower serum testosterone production. (A) The serum testosterone levels from mice of different ages were measured using enzyme-linked immunosorbent assays. (B, C) The testis tissues from different aged mice were sliced and then Fancd2os protein expression and apoptosis were analyzed using immunochemistry and the terminal deoxynucleotidyl transferase-mediated dUTP-biotin nick end labeling (TUNEL) assay, respectively. ST represents seminiferous tubule. Black arrows and red arrows indicate Fancd2os-positive cells and TUNEL-positive cells, respectively. Scale bar represents 25 μm. The results are given as the mean±standard deviation (n=3). (D) The correlations between Fancd2os expression (B) and the TUNEL-positive staining rate (C) were analyzed using Pearson correlation coefficients. An r≥0.5 was considered to indicate a strong correlation, and P<0.05 was considered statistically significant. aP<0.05 compared with juvenile mice; bP<0.05 compared with young mice; cP<0.05 compared with middle-aged mice. |


 PDF
PDF Citation
 Print
Print


 XML Download