Journal List > Endocrinol Metab > v.37(2) > 1516079180

Cho, Kim, Shin, Jang, Kim, Jung, Kim, Kim, Chung, Han, and Kim: Graves’ Disease and the Risk of End-Stage Renal Disease: A Korean Population-Based Study

Abstract

Background

Hyperthyroidism is associated with an increased glomerular filtration rate (GFR) in the hyperdynamic state, which is reversible after restoring euthyroidism. However, long-term follow-up of renal dysfunction in patients with hyperthyroidism has not been performed.

Methods

This was a retrospective cohort study using the Korean National Health Insurance database and biannual health checkup data. We included 41,778 Graves’ disease (GD) patients and 41,778 healthy controls, matched by age and sex. The incidences of end-stage renal disease (ESRD) were calculated in GD patients and controls. The cumulative dose and duration of antithyroid drugs (ATDs) were calculated for each patient and categorized into the highest, middle, and lowest tertiles.

Results

Among 41,778 GD patients, 55 ESRD cases occurred during 268,552 person-years of follow-up. Relative to the controls, regardless of smoking, drinking, or comorbidities, including chronic kidney disease, GD patients had a 47% lower risk of developing ESRD (hazard ratio [HR], 0.53; 95% confidence interval [CI], 0.37 to 0.76). In particular, GD patients with a higher baseline GFR (≥90 mL/min/1.73 m2; HR, 0.33; 95% CI, 0.11 to 0.99), longer treatment duration (>33 months; HR, 0.31; 95% CI, 0.17 to 0.58) or higher cumulative dose (>16,463 mg; HR, 0.29; 95% CI, 0.15 to 0.57) of ATDs had a significantly reduced risk of ESRD.

Conclusion

This was the first epidemiological study on the effect of GD on ESRD, and we demonstrated that GD population had a reduced risk for developing ESRD.

GRAPHICAL ABSTRACT

INTROUDUCTION

The thyroid and kidneys interact with each other [1,2]. Thyroid hormones are essential for the growth and development of the kidney and for the maintenance of water and electrolyte homeostasis [3]. The kidney plays a role in the metabolism and elimination of thyroid hormones. Thus, thyroid dysfunction leads to marked changes in glomerular and tubular functions, water and electrolyte homeostasis, and cardiovascular function [4]. In turn, various kidney diseases, including acute kidney disease, chronic kidney disease (CKD) and nephrotic syndrome, are related to alterations in the synthesis, secretion, metabolism, and elimination of thyroid hormones.
Both hyperthyroidism and hypothyroidism cause significant changes in renal blood flow, the glomerular filtration rate (GFR), tubular function and electrolyte homeostasis, which are reversible after appropriate treatment. Hypothyroidism is associated with a decrease in the GFR that normalizes after levothyroxine treatment [5-7]. Conversely, hyperthyroidism leads to an increase in the GFR and a reduction in the serum creatinine level, and these changes have been reported even in patients with subclinical hyperthyroidism [8-10]. However, the majority of studies regarding the effect of thyroid dysfunction on renal function were conducted with a small number of patients and a limited study period. Moreover, studies on hyperthyroidism are scarce, probably due to its low prevalence [11,12].
To the best of our knowledge, there has been no epidemiological study investigating the effect of hyperthyroidism on renal dysfunction with long-term follow-up. Thus, the present study evaluated the risk of end-stage renal disease (ESRD) in Korean patients with Graves’ disease (GD) using nationally representative data from the National Health Information Database (NHID) and health checkup data. We also assessed the association of the risk of developing ESRD with the GD treatment modality and the cumulative dose and duration of antithyroid drug (ATD) treatment.

METHODS

Data source

Data were retrieved from the Korean NHID, which is maintained by the National Health Insurance Service (NHIS). The NHIS is the only public medical insurance system in Korea and covers approximately 97% of the 50 million Korean citizens, with the other 3% being covered by Medicaid. The NHID contains nationally representative data and includes diagnostic codes based on the standard International Classification of Diseases 10th Revision (ICD-10); prescriptions; patient demographic data, including age, sex, region; and data on billing for medical expenses [13].
The NHIS also manages a biannual health checkup program for all insured Koreans who are ≥40 years old, employee subscribers who are ≥20 years old are recommended to have the NHIS health checkup. The NHIS health checkup program has four possible components: general health checkup, baby/infant health checkup, cancer checkup, and lifetime transition period health checkup. The NHIS health checkup programs collect anthropometric measurements, including height, body weight, body mass index, waist circumference, and systolic blood pressure (SBP)/diastolic blood pressure (DBP); laboratory test results, such as fasting blood glucose, the GFR, total cholesterol, high density lipoprotein cholesterol, low density lipoprotein cholesterol, and triglycerides; and medical, surgical, and social histories. Hospitals perform the health checkups after being certified by the NHIS, which also regularly qualifies trained examiners.

Study population

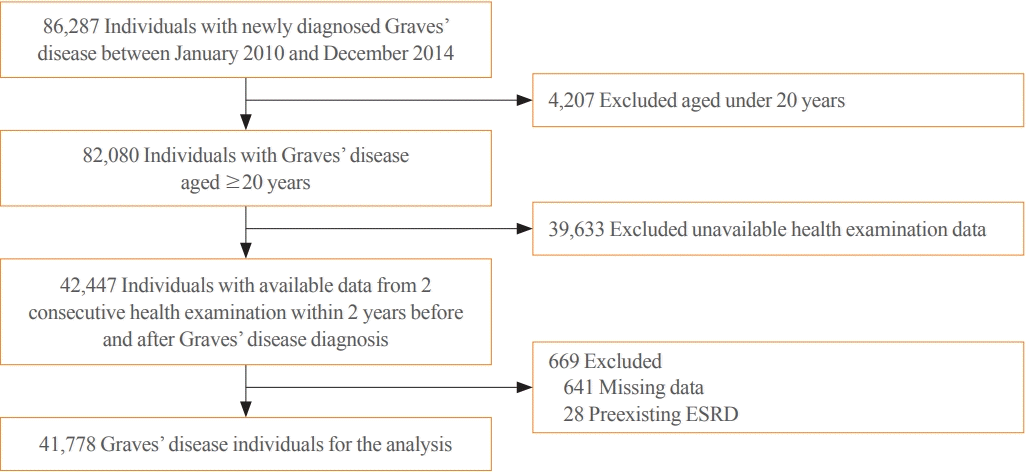
We identified 86,287 individuals who were diagnosed with GD between January 2010 and December 2014 using the ICD-10 code for hyperthyroidism (E05). To find the cases with GD, individuals who had received ATDs ≥60 consecutive days or who had undergone thyroid surgery or radioactive iodine therapy (RAIT) were enrolled. We adopted the definition for case detection which has been used in previous epidemiologic studies for GD in Korea [11,14]. To exclude pre-existing GD or ESRD, a washout period was applied from January 2006 to study enrollment. We also excluded patients who were <20 years old, patients who were diagnosed with thyroid carcinoma (C73.9), or patients who were missing data for the NHIS health checkup (Fig. 1). Thus, the analysis included 41,778 GD patients who were matched with 41,778 controls (1:1 ratio) according to age and sex. The study period ended in December 2018.
The method of treatment for GD was classified according to whether patients had received ATDs for ≥60 consecutive days (medical treatment), had undergone RAIT, or had undergone thyroid surgery. Patients who had undergone RAIT or surgery for GD were assigned to the RAIT group or surgery group, respectively, regardless of whether they had received ATDs.
The retrospective study protocol was approved by the Samsung Medical Center’s Institutional Review Board (2019-01-034). The need to obtain informed patient consent was waived based on the use of publicly available and deidentified patient data. All procedures for this study complied with the relevant patient confidentiality guidelines.

Definitions of CKD and ESRD

CKD was defined based on the ICD-10 codes of N00–N19 or N25. Newly diagnosed ESRD was defined based on the special ICD-10 codes for hemodialysis (V001), peritoneal dialysis (V003), or kidney transplantation (V005) [15]. The NHIS health checkup data, including the GFR, were collected within the 2 years prior to study enrollment. The GFR was calculated using the Modification of Diet in Renal Disease (MDRD) study equation as follows: GFR (mL/min/1.73 m²)=175×(Scr)−1.154×(age)−0.203×(0.742, if female)×(1.212, if African American) [16].

Definitions of covariates

Diabetes was defined as the combination of the ICD-10 codes (E11, E12, E13, and E14) and the prescription of anti-diabetic drugs and/or fasting blood glucose ≥126 mg/dL. Hypertension was defined as the combination of the ICD-10 codes (I10, I11, I12, I13, and I15) and the prescription of anti-hypertensive drugs and/or SBP ≥140 mm Hg or DBP ≥90 mm Hg. Dyslipidemia was defined as the combination of the ICD-10 code (E78) and the prescription of drugs for dyslipidemia and/or total cholesterol ≥240 mg/dL. Household income was divided into quartiles. Absolute property was defined when monthly house income was less than the minimum cost of living. Smoking status was classified into three categories, nonsmokers, former smokers, and current smokers. People who had smoked more than five packs in lifetime were defined as smokers. Former smokers were distinguished from current smokers, based on their present smoking status, as individuals who stopped smoking at the survey time, regardless of duration. Heavy drinker was defined as a man who drank more than 30 g of alcohol per day and a woman who drank more than 20 g of alcohol a day. Mild drinker was defined as a man who drank <30 g of alcohol per day and a woman who drank <20 g of alcohol per day. Nondrinker was defined as people who drank 0 g of alcohol per day. Regular exercise was defined as exercising more than three times a week, and for more than 30 minutes at a time.

Cumulative doses of ATDs and duration of ATD treatment

Based on the ICD-10 codes for drug prescriptions, the cumulative doses of ATDs and duration of ATD treatment were calculated. Methimazole, carbimazole, and propylthiouracil (PTU) have been available in Korea. According to the American Thyroid Association guidelines for thyrotoxicosis [17,18], 10 mg of carbimazole was calculated as the same dose of 6 mg of methimazole, and 100 mg of PTU was calculated as the equal dose of 5 mg of methimazole. The cumulative ATD dose was determined for each patient and classified as <4,658 mg (lowest tertile), 4,658–16,463 mg (middle tertile), and >16,463 mg (highest tertile). The ATD treatment duration was also determined for each patient and classified as <11.5 months (lowest tertile), 11.5–32.9 months (middle tertile), and >32.9 months (highest tertile).

Statistical analyses

Categorical baseline characteristics were compared using the chi-square test. Conventional Cox proportional hazard regression analyses were performed to evaluate the association between GD and incident ESRD. The hazard ratio (HR) was not adjusted in model 1, while model 2 was adjusted for income, diabetes, hypertension, and dyslipidemia, and model 3 was adjusted for income, diabetes, hypertension, dyslipidemia, smoking, drinking, exercise, and CKD. A P<0.05 was regarded as significant. All statistical analyses were performed using SAS software version 9.4 (SAS Institute Inc., Cary, NC, USA).

RESULTS

Demographic characteristics

The study included 41,778 GD patients and 41,778 matched healthy controls. The mean age was 50 years and 32% of the subjects in both groups were men. The GD patients had higher prevalences of diabetes and hypertension and a lower prevalence of dyslipidemia. SBP and fasting glucose tended to be higher and cholesterol levels tended to be lower in GD patients than in controls. The prevalence of CKD in GD patients was higher than that in controls (6.7% vs. 4.6%). The baseline GFR was 95 mL/min/1.73 m2 in GD patients and 84 mL/min/1.73 m2 in controls (Table 1). The median follow-up period was 6.5 years in each group.

Association of GD and ESRD

Among 41,778 GD patients, 55 cases of ESRD were diagnosed during 268,255 person-years (PYs) (incidence ratio [IR], 0.20 per 1,000 PYs). Relative to the controls, GD patients had an 18% lower risk of ESRD (HR, 0.82; 95% confidence interval [CI], 0.57 to 1.12), and the reduction in risk was more prominent after adjustment for other demographic factors, including CKD (HR, 0.53; 95% CI, 0.37 to 0.76) (Table 2).

Association of GD and ESRD according to age, sex, and comorbidities

We conducted subgroup analysis according to age group, sex, and the presence of diabetes, hypertension, and dyslipidemia. In general, GD patients had a lower risk of ESRD than controls, regardless of age group, sex, and the presence of comorbidities. However, the statistical significance did not reach in population who aged ≥65, aged 20 to 39, population without diabetes or hypertension, and population with dyslipidemia (Table 3).

Association of GD and ESRD stratified by baseline GFR

According to the baseline GFR, GD patients and controls were divided into three groups: (1) GFR <60 mL/min/1.73 m2: 5.9% (GD) and 7.8% (controls); (2) 60–89 mL/min/1.73 m2: 46.5% (GD) and 62.3% (controls); and (3) ≥90 mL/min/1.73 m2: 47.6% (GD) and 29.9% (controls). Regardless of the baseline GFR, the risk of ESRD in GD patients tended to be lower than that in controls (P for interaction=0.24). In particular, GD patients with a higher GFR (≥90 mL/min/1.73 m2) had a significantly reduced risk of developing ESRD (HR, 0.33; 95% CI, 0.11 to 0.99) (Table 4).

Association of GD and ESRD according to cumulative ATD dose and treatment duration

Approximately 96% of the GD patients were treated with ATDs in this population. The proportions of patients in the RAIT (1,231 patients, 2.9%) and surgical treatment (325 patients, 0.8%) groups were very low, and these two groups were not appropriate to evaluate the effect of ATD treatment for incident ESRD; thus, these two treatment groups were not included in the subgroup analysis.
As with the entire GD population, medically treated GD patients had a lower risk of ESRD (HR, 0.53; 95% CI, 0.37 to 0.77). When we classified GD patients according to cumulative ATD dose and treatment duration, a reduced risk of ESRD was observed across the GD subgroups relative to the controls. In particular, subgroups with a higher cumulative dose (>16,463 mg) or longer treatment duration (>32.9 months) with ATDs had the lowest risks of developing ESRD (HR, 0.29 and 0.31 in each group) (Table 5). Median duration and cumulative dose of ATDs were 18.5 months and 8,085 mg, respectively.

DISCUSSION

This was the first epidemiological study on the effect of GD on ESRD, and we observed a 47% reduction in the risk of developing ESRD in the GD population compared to the healthy controls. The reduction in the risk of ESRD was greater when the model was adjusted for various demographic factors, including CKD. In addition, the GD population with a higher baseline GFR ≥90 mL/min/1.73 m2 had a significantly reduced risk of developing ESRD. Interestingly, ATD users with longer treatment durations or higher cumulative doses had the lowest risk of ESRD. Thus, GD itself may be an independent factor reducing the risk of incident ESRD.
Thyroid hormones directly influence renal tubular function and the cardiovascular system. Thyroid hormones affect the activity of renal tubular ion transporters, and hyperthyroidism stimulates the activity of most transporters, except for aquaporins [19,20]. Moreover, thyroid hormones increase cardiac contractility by regulating the genes responsible for myocardial contraction and electrochemical signaling and decrease vascular smooth muscle tone and reactivity by stimulating nitric oxide synthase activity in the heart, kidney, and aorta [21,22]. The combination of the downregulation of aquaporins 1 and 2; increased SBP, cardiac output, and renal blood flow; and increased food and water intake in the hyperthyroid state lead to an increased urine flow rate [4].
While many studies have investigated the effect of hypothyroidism on renal function, there have been only a few clinical studies on the effect of hyperthyroidism on renal function during the short-term period after treatment [8,9]. den Hollander et al. [8] reported an approximately 30% decrease in the GFR (from 135 to 96 mL/min, calculated by the MDRD formula) in 14 patients with GD after treatment, which was in contrast to an approximately 19% increase in the GFR (from 70 to 83 mL/min) in 37 patients with Hashimoto’s thyroiditis after hormone supplementation. Sonmez et al. [9] observed an approximately 12% decline in the GFR (from 103 to 91 mL/min/1.73 m2, calculated by the MDRD formula) in 433 patients with hyperthyroidism (367 overt and 66 subclinical) after achieving euthyroidism. In this study, GD patients had the higher baseline GFR than controls (95 mL/min/1.73 m2 vs. 84 mL/min/1.73 m2), which might be associated with the increased GFR in uncontrolled hyperthyroidism before treatment. Two previous studies [8,9] observed similar results, reporting that the elevated GFR in the hyperdynamic state in patients with hyperthyroidism normalizes after euthyroidism is achieved; however, the long-term effects of hyperthyroidism on renal function have not been studied.
In this study, GD patients with a higher baseline GFR were at a reduced risk of developing ESRD. GD patients with a baseline GFR less than 60 mL/min/1.73 m2 also had a relatively lower risk of ESRD; however, the difference was not significant. As it involves impaired glomerular filtration, CKD is the most important predictor of ESRD [23], and the effect of hyperthyroidism on the GFR might be less pronounced in these patients. Whereas, both the GD population and healthy controls with preserved renal function (≥60 mL/min/1.73 m2) had very low incidences of developing ESRD (IR, 0.05 to 0.1 per 1,000 PY). Among these individuals, the reduction in the risk of ESRD was most pronounced in the GD patients with a higher GFR (≥90 mL/ min/1.73 m2) (Table 4). As another contributing factors for ESRD, controls with diabetes or hypertension had higher IRs (1.78 per 1,000 PYs in diabetes and 0.73 per 1,000 PYs in hypertension) than controls without comorbidities (0.11 per 1,000 PYs without diabetes and 0.07 per 1,000 PYs without hypertension). Even in GD population with diabetes or hypertension had lower risks of ESRD (HR of 0.35 with diabetes and 0.55 with hypertension) compared to controls with comorbidities (Table 3).
It is noteworthy that a longer treatment duration (>33 months) and a higher cumulative dose of ATDs (>16,400 mg; for example, a patient who has been taking at 15 mg per day ATDs for more than 36 months) had marked reductions in the risk of ESRD. Although thyroid function tests were not available from the NHIS health checkup data and the exact status of the thyroid could not be assessed, noticeably lower risks of ESRD in the groups with a longer treatment duration and a higher cumulative dose of ATDs than in the groups with a shorter duration and a lower cumulative of ATDs, even after statistical correction for significant factors for renal function, including age, the baseline GFR, and other comorbidities may indicate that a prolonged hyperthyroid state affects renal function. We cannot fully explain the reason of risk reduction of ESRD in patients with prolonged ATD treatment. There is no evidence regarding renal protective effect of ATDs or thyroid autoimmunity related to GD in the literature. A recent experimental study [24] suggested the relationship between phospholipase A2 receptor (PLA2R) antibodies in Hashimoto’s thyroiditis and idiopathic membranous nephropathy; however, the association was not identified in GD. Sonmez et al. [9] reported that higher free triiodothyronine and free thyroxine levels were positively correlated with an elevated GFR. We attentively speculated that insufficient control of hyperthyroidism needing prolonged ATD therapy might be related to hyperdynamic status of kidney. It is interesting that GD patients who need sustained medical treatment have a lower risk of ESRD.
This study has several limitations. First, the NHID does not include information about thyroid function or autoantibody titers (e.g., antibodies against the thyroid stimulating hormone receptor), which precluded the performance of related analyses. Therefore, the exact thyroid function status or whether thyroid autoimmunity is a pathogenic mechanism of renal dysfunction cannot be evaluated based on this study population. Nevertheless, we included clinical variables relevant to the development of ESRD, such as the presence of diabetes and hypertension, smoking, and the baseline GFR, and adjusted for these variables in the multivariate analysis. Second, diagnosis of hyperthyroidism was based on ICD-10 codes and information regarding the etiology of hyperthyroidism was insufficient. To exclude transient thyrotoxicosis, consecutive prescription of ATD was also used as definition of the ATD group. The etiology of hyperthyroidism in an iodine-sufficient area, including Korea is known as GD, and toxic adenoma account for less than 1% of the etiology of hyperthyroidism in Korea [25]. Therefore, the present results may be interpreted as the results of GD. Third, the MDRD equation was used to estimate the GFR, although the measurement of the GFR with 125I-iothalamate is regarded as the gold standard. Kimmel et al. [10] compared various methods of measuring the GFR both in hyperthyroid and hypothyroid individuals, and they concluded that most methods, except for the cystatin-C-based equation, were adequate for the measurement of the GFR in patients with thyroid disorders. Fourth, approximately 96% of the Korean GD patients had received medical treatment; thus, it is difficult to generalize our results to GD patients who received other treatments, including RAIT or surgery. Nevertheless, this is the first nationwide cohort study, investigating the relationship between GD and ESRD in a large longitudinal cohort of subjects. The prevalence of GD is very low (<1%) in the general population [11,26]; thus, a population-based database is likely needed to evaluate the association between GD and ESRD, despite the innate limitations of the NHID.
Based on the Korean NHID and health checkup data, the present study showed that the GD population had a lower risk of developing ESRD, and the reduction in the risk was greatest in GD patients with the longer treatment duration and the higher cumulative doses of ATD. The risk of ESRD tended to be reduced even in GD patients with relatively low baseline GFR values. As respects renal function, GD may be a favorable factor for incident ESRD.

Notes

CONFLICTS OF INTEREST

No potential conflict of interest relevant to this article was reported.

AUTHOR CONTRIBUTIONS

Conception or design: Y.Y.C., K.H., T.H.K. Acquisition, analysis, or interpretation of data: Y.Y.C., B.K., K.H., T.H.K. Drafting the work or revising: Y.Y.C., T.H.K. Final approval of the manuscript: Y.Y.C., B.K., D.W.S., H.R.J., BY.K., C.H.J., J.H.K., S. W.K., J.H.C., K.H., T.H.K.

ACKNOWLEDGMENTS

This work was partly supported by the Soonchunhyang University Research Fund.

REFERENCES

1. Kaptein EM, Quion-Verde H, Massry SG. Hemodynamic effects of thyroid hormone. Contrib Nephrol. 1984; 41:151–9.
crossref
2. Kaptein EM, Feinstein EI, Massry SG. Thyroid hormone metabolism in renal diseases. Contrib Nephrol. 1982; 33:122–35.
3. Katz AI, Emmanouel DS, Lindheimer MD. Thyroid hormone and the kidney. Nephron. 1975; 15(3-5):223–49.
crossref
4. Mariani LH, Berns JS. The renal manifestations of thyroid disease. J Am Soc Nephrol. 2012; 23:22–6.
crossref
5. Montenegro J, Gonzalez O, Saracho R, Aguirre R, Gonzalez O, Martinez I. Changes in renal function in primary hypothyroidism. Am J Kidney Dis. 1996; 27:195–8.
crossref
6. Cho YY, Kim SK, Jung JH, Hahm JR, Kim TH, Chung JH, et al. Long-term outcomes of renal function after radioactive iodine therapy for thyroid cancer according to preparation method: thyroid hormone withdrawal vs. recombinant human thyrotropin. Endocrine. 2019; 64:293–8.
crossref
7. Karanikas G, Schutz M, Szabo M, Becherer A, Wiesner K, Dudczak R, et al. Isotopic renal function studies in severe hypothyroidism and after thyroid hormone replacement therapy. Am J Nephrol. 2004; 24:41–5.
crossref
8. den Hollander JG, Wulkan RW, Mantel MJ, Berghout A. Correlation between severity of thyroid dysfunction and renal function. Clin Endocrinol (Oxf). 2005; 62:423–7.
crossref
9. Sonmez E, Bulur O, Ertugrul DT, Sahin K, Beyan E, Dal K. Hyperthyroidism influences renal function. Endocrine. 2019; 65:144–8.
crossref
10. Kimmel M, Braun N, Alscher MD. Influence of thyroid function on different kidney function tests. Kidney Blood Press Res. 2012; 35:9–17.
crossref
11. Kwon H, Jung JH, Han KD, Park YG, Cho JH, Lee DY, et al. Prevalence and annual incidence of thyroid disease in Korea from 2006 to 2015: a nationwide population-based cohort study. Endocrinol Metab (Seoul). 2018; 33:260–7.
crossref
12. Hollowell JG, Staehling NW, Flanders WD, Hannon WH, Gunter EW, Spencer CA, et al. Serum TSH, T(4), and thyroid antibodies in the United States population (1988 to 1994): National Health and Nutrition Examination Survey (NHANES III). J Clin Endocrinol Metab. 2002; 87:489–99.
13. Shin DW, Cho B, Guallar E. Korean National Health Insurance Database. JAMA Intern Med. 2016; 176:138.
crossref
14. Seo GH, Kim SW, Chung JH. Incidence & prevalence of hyperthyroidism and preference for therapeutic modalities in Korea. J Korean Thyroid Assoc. 2013; 6:56–63.
crossref
15. Kim MK, Han K, Koh ES, Kim HS, Kwon HS, Park YM, et al. Variability in total cholesterol is associated with the risk of end-stage renal disease: a nationwide population-based study. Arterioscler Thromb Vasc Biol. 2017; 37:1963–70.
16. Levey AS, Bosch JP, Lewis JB, Greene T, Rogers N, Roth D. A more accurate method to estimate glomerular filtration rate from serum creatinine: a new prediction equation. Modification of Diet in Renal Disease Study Group. Ann Intern Med. 1999; 130:461–70.
crossref
17. Ross DS, Burch HB, Cooper DS, Greenlee MC, Laurberg P, Maia AL, et al. 2016 American Thyroid Association guidelines for diagnosis and management of hyperthyroidism and other causes of thyrotoxicosis. Thyroid. 2016; 26:1343–421.
crossref
18. Alexander EK, Pearce EN, Brent GA, Brown RS, Chen H, Dosiou C, et al. 2017 Guidelines of the American Thyroid Association for the diagnosis and management of thyroid disease during pregnancy and the postpartum. Thyroid. 2017; 27:315–89.
crossref
19. Li X, Misik AJ, Rieder CV, Solaro RJ, Lowen A, Fliegel L. Thyroid hormone receptor alpha 1 regulates expression of the Na+/H+ exchanger (NHE1). J Biol Chem. 2002; 277:28656–62.
20. Santos Ornellas D, Grozovsky R, Goldenberg RC, Carvalho DP, Fong P, Guggino WB, et al. Thyroid hormone modulates ClC-2 chloride channel gene expression in rat renal proximal tubules. J Endocrinol. 2003; 178:503–11.
crossref
21. Razvi S, Jabbar A, Pingitore A, Danzi S, Biondi B, Klein I, et al. Thyroid hormones and cardiovascular function and diseases. J Am Coll Cardiol. 2018; 71:1781–96.
crossref
22. Vargas F, Moreno JM, Rodriguez-Gomez I, Wangensteen R, Osuna A, Alvarez-Guerra M, et al. Vascular and renal function in experimental thyroid disorders. Eur J Endocrinol. 2006; 154:197–212.
crossref
23. Iseki K, Ikemiya Y, Fukiyama K. Risk factors of end-stage renal disease and serum creatinine in a community-based mass screening. Kidney Int. 1997; 51:850–4.
crossref
24. Huang B, Zhang Y, Wang L, Wu Q, Li T, Zhang J, et al. Phospholipase A2 receptor autoantibodies as a novel serological biomarker for autoimmune thyroid disease associated nephropathy. Front Immunol. 2020; 11:837.
crossref
25. Moon JH, Yi KH. The diagnosis and management of hyperthyroidism in Korea: consensus report of the Korean Thyroid Association. Endocrinol Metab (Seoul). 2013; 28:275–9.
crossref
26. Nystrom HF, Jansson S, Berg G. Incidence rate and clinical features of hyperthyroidism in a long-term iodine sufficient area of Sweden (Gothenburg) 2003-2005. Clin Endocrinol (Oxf). 2013; 78:768–76.
crossref

Fig. 1.
Selection of the study population. ESRD, end-stage renal disease.
enm-2021-1333f1.tif
enm-2021-1333f2.tif
Table 1.
Baseline Demographics of Patients with Graves’ Disease and Controls
Variable Controls (n=41,778) Graves’ disease patients (n=41,778) P value
Male sex 13,189 (32) 13,189 (32) 1.00
Age, yr 50±12 50±12 1.00
Age ≥65 years 5,493 (13) 5,493 (13) 1.00
Comorbidities
Chronic kidney disease 1,924 (5) 2,783 (7) <0.01
Diabetes 3,715 (9) 5,260 (13) <0.01
Hypertension 11,437 (27) 15,104 (36) <0.01
Dyslipidemia 9,302 (22) 7,653 (18) <0.01
BMI, kg/m2 23.6±3.3 23.0±3.2 <0.01
Waist circumference, cm 78.9±9.2 77.8±8.9 <0.01
SBP, mm Hg 121±15 122±15 <0.01
DBP, mm Hg 76±10 75±10 <0.01
GFR, mL/min/1.73 m2 84±31 95±39 <0.01
Fasting glucose, mg/dL 97±23 100±24 <0.01
Total cholesterol, mg/dL 197±37 177±40 <0.01
HDL cholesterol, mg/dL 57±23 54±19 <0.01
LDL cholesterol, mg/dL 116±44 102±74 <0.01
Triglycerides, mg/dL 106 (105–106) 98 (98–99) <0.01
Area of residence, rural 22,681 (54) 22,747 (54) 0.65
Income <0.01
Absolute poverty 1,637 (4) 1,725 (4) 0.12
First quartile 7,952 (19) 7,595 (18) <0.01
Second quartile 8,422 (20) 8,301 (20) 0.30
Third quartile 10,498 (25) 10,511 (25) 0.92
Fourth quartile 13,269 (32) 13,646 (33) <0.01
Smoking <0.01
Nonsmoker 30,920 (74) 30,212 (72) <0.01
Former 4,102 (10) 4,601 (11) <0.01
Current 6,756 (16) 6,965 (17) 0.05
Drinking <0.01
Nondrinker 25,580 (61) 27,839 (67) <0.01
Mild 14,038 (34) 12,463 (30) <0.01
Heavy 2,160 (5) 1,476 (3) <0.01
Regular exercise 7,602 (18) 7,357 (18) 0.03

Values are expressed as number (%), mean±standard deviation, or median (interquartile ranges).

BMI, body mass index; SBP, systolic blood pressure; DBP, diastolic blood pressure; GFR, glomerular filtration rate; HDL, high density lipoprotein; LDL, low density lipoprotein.

Table 2.
Risks of ESRD among Patients with Graves’ Disease and Controls
Number ESRD PYs IR per 1,000 PYs Model 1 Model 2 Model 3
Controls 41,778 67 268,255 0.25 Reference Reference Reference
Graves’ disease patients 41,778 55 268,552 0.20 0.82 (0.57–1.12) 0.66 (0.46–0.94) 0.53 (0.37–0.76)

The hazard ratio (95% confidence interval) was not adjusted for model 1, while model 2 was adjusted for income, diabetes, hypertension, and dyslipidemia, and model 3 was adjusted for income, diabetes, hypertension, dyslipidemia, smoking, drinking, exercise, and chronic kidney disease.

ESRD, end-stage renal disease; PY, person-year; IR, incidence rate.

Table 3.
Risks of ESRD among Patients with Graves’ Disease and Controls According to Age, Sex, and Comorbidities
Graves’ disease Number ESRD PY IR per 1,000 PYs Model P for interaction
Age, 20–39 yr No 8,110 2 53,129 0.038 Reference 0.48
Yes 8,110 2 53,159 0.038 0.16 (0.02–1.55)
Age, 40–64 yr No 28,175 46 181,305 0.25 Reference
Yes 28,175 33 181,750 0.18 0.46 (0.29–0.73)
Age, ≥65 yr No 5,493 19 33,821 0.56 Reference
Yes 5,493 20 33,642 0.59 0.69 (0.36–1.30)
Male sex No 13,189 25 84,280 0.30 Reference 0.27
Yes 13,189 16 84,477 0.19 0.39 (0.20–0.74)
Female sex No 28,589 42 183,975 0.23 Reference
Yes 28,589 39 184,075 0.21 0.63 (0.41–0.98)
Diabetes, no No 38,063 26 245,240 0.11 Reference 0.01
Yes 36,518 30 235,456 0.13 0.87 (0.51–1.48)
Diabetes, yes No 3,715 41 23,015 1.78 Reference
Yes 5,260 25 33,096 0.76 0.35 (0.21–0.58)
Hypertension, no No 30,341 14 195,854 0.07 Reference 0.44
Yes 26,674 6 172,035 0.03 0.41 (0.16–1.09)
Hypertension, yes No 11,437 53 72,401 0.73 Reference
Yes 15,104 49 96,517 0.51 0.55 (0.37–0.82)
Dyslipidemia, no No 32,476 34 209,631 0.16 Reference 0.46
Yes 34,125 28 220,658 0.13 0.48 (0.29–0.80)
Dyslipidemia, yes No 9,302 33 58,624 0.56 Reference
Yes 7,653 27 47,894 0.56 0.60 (0.36–1.01)

The hazard ratio (95% confidence interval) was adjusted for income, diabetes, hypertension, dyslipidemia, smoking, drinking, exercise, and chronic kidney disease for model.

ESRD, end-stage renal disease; PY, person-year; IR, incidence rate.

Table 4.
Risks of ESRD among Patients with Graves’ Disease and Controls According to Baseline GFR
Baseline GFR, mL/min/1.73 m2 Graves’ disease No. ESRD PY IR per 1,000 PYs Model 1 P for interaction Model 2 P for interaction Model 3 P for interaction
<60 No 3,264 42 21,196 1.98 Reference 0.17 Reference 0.25 Reference 0.24
Yes 2,469 39 15,924 2.45 1.24 (0.80–1.91) 0.86 (0.56–1.34) 0.73 (0.47–1.14)
60–89 No 26,029 17 167,956 0.10 Reference Reference Reference
Yes 19,435 10 125,610 0.08 0.79 (0.36–1.72) 0.62 (0.28–1.37) 0.58 (0.26–1.28)
≥90 No 12,485 8 79,102 0.10 Reference Reference Reference
Yes 19,874 6 127,018 0.05 0.46 (0.16–1.32) 0.35 (0.12–1.03) 0.33 (0.11–0.99)

The hazard ratio (95% confidence interval) was not adjusted for model 1, while model 2 was adjusted for income, diabetes, hypertension, and dyslipidemia, and model 3 was adjusted for income, diabetes, hypertension, dyslipidemia, smoking, drinking, exercise, and chronic kidney disease.

ESRD, end-stage renal disease; GFR, glomerular filtration rate; PY, person-year; IR, incidence rate.

Table 5.
Risks of ESRD among Patients with Graves’ Disease According to Cumulative ATD Dose and Treatment Duration
Number ESRD PY IR per 1,000 PYs Model 1 Model 2 Model 3
Controls 41,778 67 268,255 0.25 Reference Reference Reference
ATD 40,222 53 258,661 0.20 0.82 (0.57–1.18) 0.66 (0.46–0.95) 0.53 (0.37–0.77)
Cumulative dose, mg
 Lowest 13,409 21 82,773 0.25 1.02 (0.63–1.67) 0.81 (0.49–1.32) 0.65 (0.40–1.07)
 Middle 13,406 22 84,634 0.26 1.05 (0.65–1.69) 0.81 (0.50–1.32) 0.70 (0.41–1.09)
 Highest 13,407 10 91,254 0.11 0.43 (0.22–0.84) 0.37 (0.19–0.71) 0.29 (0.15–0.57)
Cumulative duration, day
 Lowest 13,422 20 85,439 0.23 0.94 (0.57–1.55) 0.84 (1.51–1.38) 0.64 (0.39–1.06)
 Middle 13,390 21 85,441 0.25 0.98 (0.60–1.61) 0.86 (0.52–1.40) 0.70 (0.42–1.14)
 Highest 13,410 12 87,781 0.14 0.55 (0.30–1.01) 0.37 (0.20–0.69) 0.31 (0.17–0.58)

The cumulative ATD doses were <4,658 mg (lowest), 4,658–16,463 mg (middle), and >16,463 mg (highest); Cumulative ATD treatment durations were <11.5 months (lowest), 11.5–32.9 months (middle), and >32.9 months (highest). The hazard ratio (95% confidence interval) was not adjusted for model 1, while model 2 was adjusted for income, diabetes, hypertension, and dyslipidemia, and model 3 was adjusted for income, diabetes, hypertension, dyslipidemia, smoking, drinking, exercise, and chronic kidney disease.

ESRD, end-stage renal disease; ATD, antithyroid drug; PY, person-year; IR, incidence rate.

TOOLS
Similar articles