Journal List > Endocrinol Metab > v.37(2) > 1516079175

Seo, Moon, Kim, and Park: Associations of Phthalate Metabolites and Bisphenol A Levels with Obesity in Children: The Korean National Environmental Health Survey (KoNEHS) 2015 to 2017

Abstract

Background

Phthalates and bisphenol A (BPA) are synthetic chemicals widely used in daily life. This study investigated urinary phthalate and BPA levels in Korean children and their associations with obesity.

Methods

A total of 2,351 children aged 3 to 17 years who participated in the Korean National Environmental Health Survey 2015 to 2017 were included. Urinary dilution was corrected using covariate-adjusted standardization (CAS). We examined the geometric mean (GM) concentrations of urinary phthalate metabolites, including di (2-ethylhexyl) phthalate (DEHP) metabolites (mono [2-ethyl-5-hydroxyhexyl] phthalate, mono [2-ethyl-5-oxohexyl] phthalate, and mono [2-ethyl-5-carboxypentyl] phthalate [MECPP]), mono-benzyl-phthalate (MBzP), mono (carboxyoctyl) phthalate (MCOP), mono (carboxy-isononyl) phthalate (MCNP), mono (3-carboxypropyl) phthalate, and mono-n-butyl-phthalate (MnBP), and BPA. We also analyzed the odds ratio (OR) for obesity according to the quartiles of each analyte.

Results

The urinary GM levels of DEHP metabolites and MnBP were notably higher among Korean children than among American, Canadian, and German children. The CAS-applied GM concentrations of most analytes, except for MBzP, MCOP, and MCNP, were higher in children aged 3 to 5 years than in those aged 6 to 17 years. The OR for obesity in the highest quartile of MECPP was significantly higher than in the lowest quartile after adjusting for covariates. However, the other phthalate metabolites and BPA were not significantly associated with obesity.

Conclusion

The concentrations of urinary DEHP metabolites and MnBP were higher in Korean children than in children in Western countries. Urinary MECPP exposure, but not other phthalates or BPA, showed a positive association with obesity in Korean children. Further studies are required to elucidate the causal relationships.

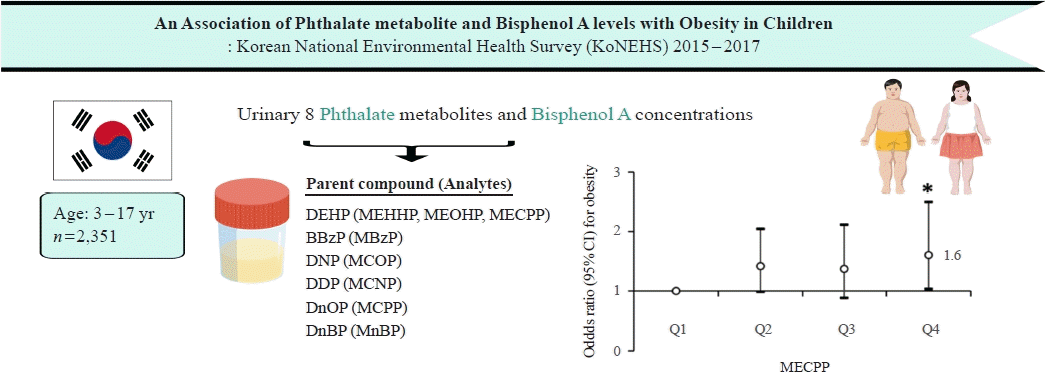
GRAPHICAL ABSTRACT

INTRODUCTION

Phthalates are synthetic organic chemicals that are diesters of 1,2-benzenedicarboxylic acid [1,2] and are categorized by their molecular weight [2]. High-molecular-weight phthalates (HMWPs) are mainly used in household products (polyvinyl chloride [PVC] plastics for food packaging, medical devices, building materials, and children’s toys), whereas low-molecular-weight phthalates (LMWPs) are mainly used in personal care products (shampoo, lotions, deodorants, perfumes, and makeup products) [3]. HMWPs are classified as di (2-ethylhexyl) phthalate (DEHP) and non-DEHP compounds, depending on the parent compound [3]. Bisphenol A (BPA) is a synthetic chemical widely used in polycarbonate plastics for food packaging, epoxy resins for canned beverages, and thermal paper [4].
Phthalates and BPA have been reported to have various effects on the human body [4,5]. In particular, extensive studies are being conducted on their obesogenic effects in response to increasing obesity worldwide [3,6]. Previous studies have shown that both phthalates and BPA can cause obesity by promoting adipogenesis by activating peroxisome proliferator-activated receptors (PPARs), binding to estrogen receptors (ERs), and interfering with thyroid hormone receptors (TRs) [6]. However, studies on the association between phthalates and BPA exposure with obesity have reported inconsistent results [1,7]. Moreover, much research on this issue has been conducted in Western populations, and studies on other ethnic groups, especially among pediatric populations, are insufficient [2,7].
Urinary creatinine (Ucr) was adjusted as an independent covariate to account for urinary dilution of analyte concentrations in most of the previous studies. However, as Ucr is affected by urine dilution, age, sex, and body mass index (BMI), adjusting Ucr as an independent covariate in BMI-based obesity studies might cause collider stratification bias [8-10]. Given that creatinine is predominantly produced by skeletal muscle and excreted in the urine, Ucr levels are higher in obese people with relatively more skeletal muscle than in lean people [8]. Therefore, adjusting only for Ucr leads to a risk of offsetting significance in the results of obesity risk analyses [8]. To overcome this problem, covariate-adjusted standardization (CAS) has recently been introduced [8-10]. CAS may contribute to an adequate assessment of BMI-related obesity risk in epidemiological studies using endocrine-disrupting chemical (EDC) levels as exposure biomarkers [9].
This study aimed to determine the urinary concentrations of phthalates and BPA in Korean children and adolescents and to identify their associations with pediatric obesity by analyzing national representative data using the CAS method.

METHODS

Study population

The Korean National Environmental Health Survey (KoNEHS) was conducted by the National Institute of Environmental Research (NIER) to assess the general population’s exposure to environmentally hazardous substances [11].
Data from the third cycle of the KoNEHS, which included the pediatric population for the first time, were used in this study [11]. Before participation, all participants and their parents provided informed consent. The study protocol was approved by the Institutional Review Board of Inje University Sanggye Paik Hospital (approval number: SGPAIK 2019-11-018). Informed consent was waived by the board.
In total, 2,380 participants aged 3 to 17 years were surveyed. After excluding participants who had not been tested for urinary phthalate metabolites and BPA, the final sample contained 2,351 individuals (1,163 boys and 1,188 girls).

Study variables

Height and weight were measured by qualified surveyors to the nearest 0.1 cm and 0.1 kg, respectively, using a stadiometer and a weighing scale while the participants wore light clothing and no shoes. BMI was calculated by dividing the weight (in kilograms) by the square of the height (in meters), and BMI status was determined using the sex- and age-specific percentile values presented in the 2017 Korean National Growth Charts for children and adolescents: underweight (<5th percentile), normal (≥5th percentile and <85th percentile), overweight (≥85th percentile and <95th percentile), and obesity (≥95th percentile) [12].
The survey included questionnaires on household income and health behaviors. The mean monthly household income for the past year was classified into the following seven categories: <1,000,000, 1,000,000–<2,000,000, 2,000,000–<3,000,000, 3,000,000–<5,000,000, 5,000,000–<7,000,000, ≥7,000,000 South Korean won (KRW), and unknown. For health behavior, the survey asked participants whether they ate hamburgers or pizza more than twice a week and played or exercised enough to sweat more than three times a week. Urine cotinine concentrations were measured using gas chromatography-mass spectrometry (Clarus 600T, PerkinElmer, Waltham, MA, USA). Ucr was measured by colorimetry (ADVIA 1800, Siemens Healthineers, Erlangen, Germany) using the Jaffe reaction method.

Measurement of urinary phthalate metabolites and BPA

Eight urinary phthalate metabolites, including mono (2-ethyl5-hydroxyhexyl) phthalate (MEHHP), mono (2-ethyl-5-oxohexyl) phthalate (MEOHP), mono (2-ethyl-5-carboxypentyl) phthalate (MECPP), mono-benzyl-phthalate (MBzP), mono (carboxyoctyl) phthalate (MCOP), mono (carboxy-isononyl) phthalate (MCNP), mono (3-carboxypropyl) phthalate (MCPP), and mono-n-butyl-phthalate (MnBP), and BPA were analyzed. After collecting the participants’ midstream voided urine, the collection container was shielded, immediately stored at 2°C to 6°C, and frozen at –20°C until analysis. Ultra-performance liquid chromatography-mass spectrometry (Agilent 6490, Agilent Technologies Inc., Santa Clara, CA, USA) was used to analyze the concentrations of urinary phthalate metabolites and BPA. Quality control procedures for the analytes were carried out in accordance with the recommendations of the NIER [11].
Before statistical analysis, each concentration below the limit of detection (LOD) was imputed as the LOD value divided by √2. The LOD values were as follows: MEHHP, 0.056 µg/L; MEOHP, 0.048 µg/L; MECPP, 0.141 µg/L; MBzP, 0.066 µg/L; MCOP, 0.048 µg/L; MCNP, 0.139 µg/L; MCPP, 0.078 µg/L; MnBP, 0.040 µg/L; and BPA, 0.075 µg/L [11].

Adjustment of urinary dilution

To account for the urinary dilution effect, we used a novel method known as CAS [8-10,13]. First, the natural log-transformed urinary creatinine level (LnUcr) was regressed on variables that were considered to affect Ucr levels (age, sex, and BMI). Second, the predicted LnUcr levels for each study participant were calculated using this model [9]: predicted LnUcr=0.990+sex (boys=1, girls=2)×(–0.237)+age (year)×(–0.033)+BMI (kg/m2)×(0.014).
The CAS-applied urinary phthalate metabolite and BPA concentrations were calculated as the measured urinary phthalate metabolite and BPA level divided by the observed-to-predicted Ucr ratio [9,13].

Statistical analysis

The KoNEHS used a proportionate, stratified two-stage sampling design. Sample weights were needed for a design-based analysis to consider the differential potential of selection and non-response bias. The data were then post-stratified using the 2010 Population and Housing Census of Korea. In all statistical analyses, data on strata (administrative region and socioeconomic status) and clusters (unit of sampling) were employed.
The complex-sample crosstabs procedure and the complex-sample general linear model were used to analyze categorical and continuous variables, respectively. The geometric mean (GM) concentrations of urinary phthalate metabolites and BPA were analyzed using a complex-sample descriptive procedure. Differences in the concentrations of urinary phthalate metabolites and BPA by age group were analyzed using a complex-sample general linear model. To determine the odds ratios (ORs) of the associations of phthalate and BPA exposure with pediatric obesity, a complex-sample logistic regression procedure was used after adjustment for covariates.
Statistical analyses were performed using SPSS software version 27.0 for Windows (IBM Corp., Armonk, NY, USA). For all statistical tests, a P value of <0.05, was considered statistically significant.

RESULTS

General characteristics of study participants

The general characteristics of the study participants according to sex and age groups are presented in Table 1. The study included participants aged 3–5 years (n=571), 6–11 years (n=884), and 12–17 years (n=896). Overall, the prevalence of obesity was 18.2% in boys and 13.3% in girls. Eating hamburgers or pizza more than twice a week was reported in 4.8% of boys and 2.0% of girls. Playing or exercising enough to sweat more than three times a week was reported in 61.1% of boys and 35.9% of girls.

Detection rates and concentrations of phthalate metabolites and BPA

The detection rates and GM concentrations of each urinary phthalate metabolite and BPA by sex are shown in Table 2. The detection rates of each urinary phthalate metabolite and BPA ranged from 95.4% (MBzP) to 100.0% (MEHHP and MECPP). The GM concentrations of each urinary phthalate metabolites were 22.7 µg/L for MEHHP, 15.6 µg/L for MEOHP, 37.7 µg/L for MECPP, 2.9 µg/L for MBzP, 1.9 µg/L for MCOP, 0.5 µg/L for MCNP, 1.6 µg/L for MCPP, and 41.5 µg/L for MnBP. The GM concentration of BPA was 1.7 µg/L. Although the GM concentration of MBzP was significantly higher in boys than in girls (3.2 µg/L vs. 2.6 µg/L, P<0.01), the concentrations of other analytes did not show sex-associated differences.
The GM concentrations of urinary phthalate metabolites and BPA in pediatric populations from various countries are presented in Table 3. The Korean children included in our study had higher urinary concentrations of DEHP metabolites and MnBP than the pediatric populations in the United States [14], Canada [15], and Germany [16]. The levels of the other HMWPs (MBzP, MCOP, MCNP, and MCPP) and BPA did not differ significantly across countries [14-16].

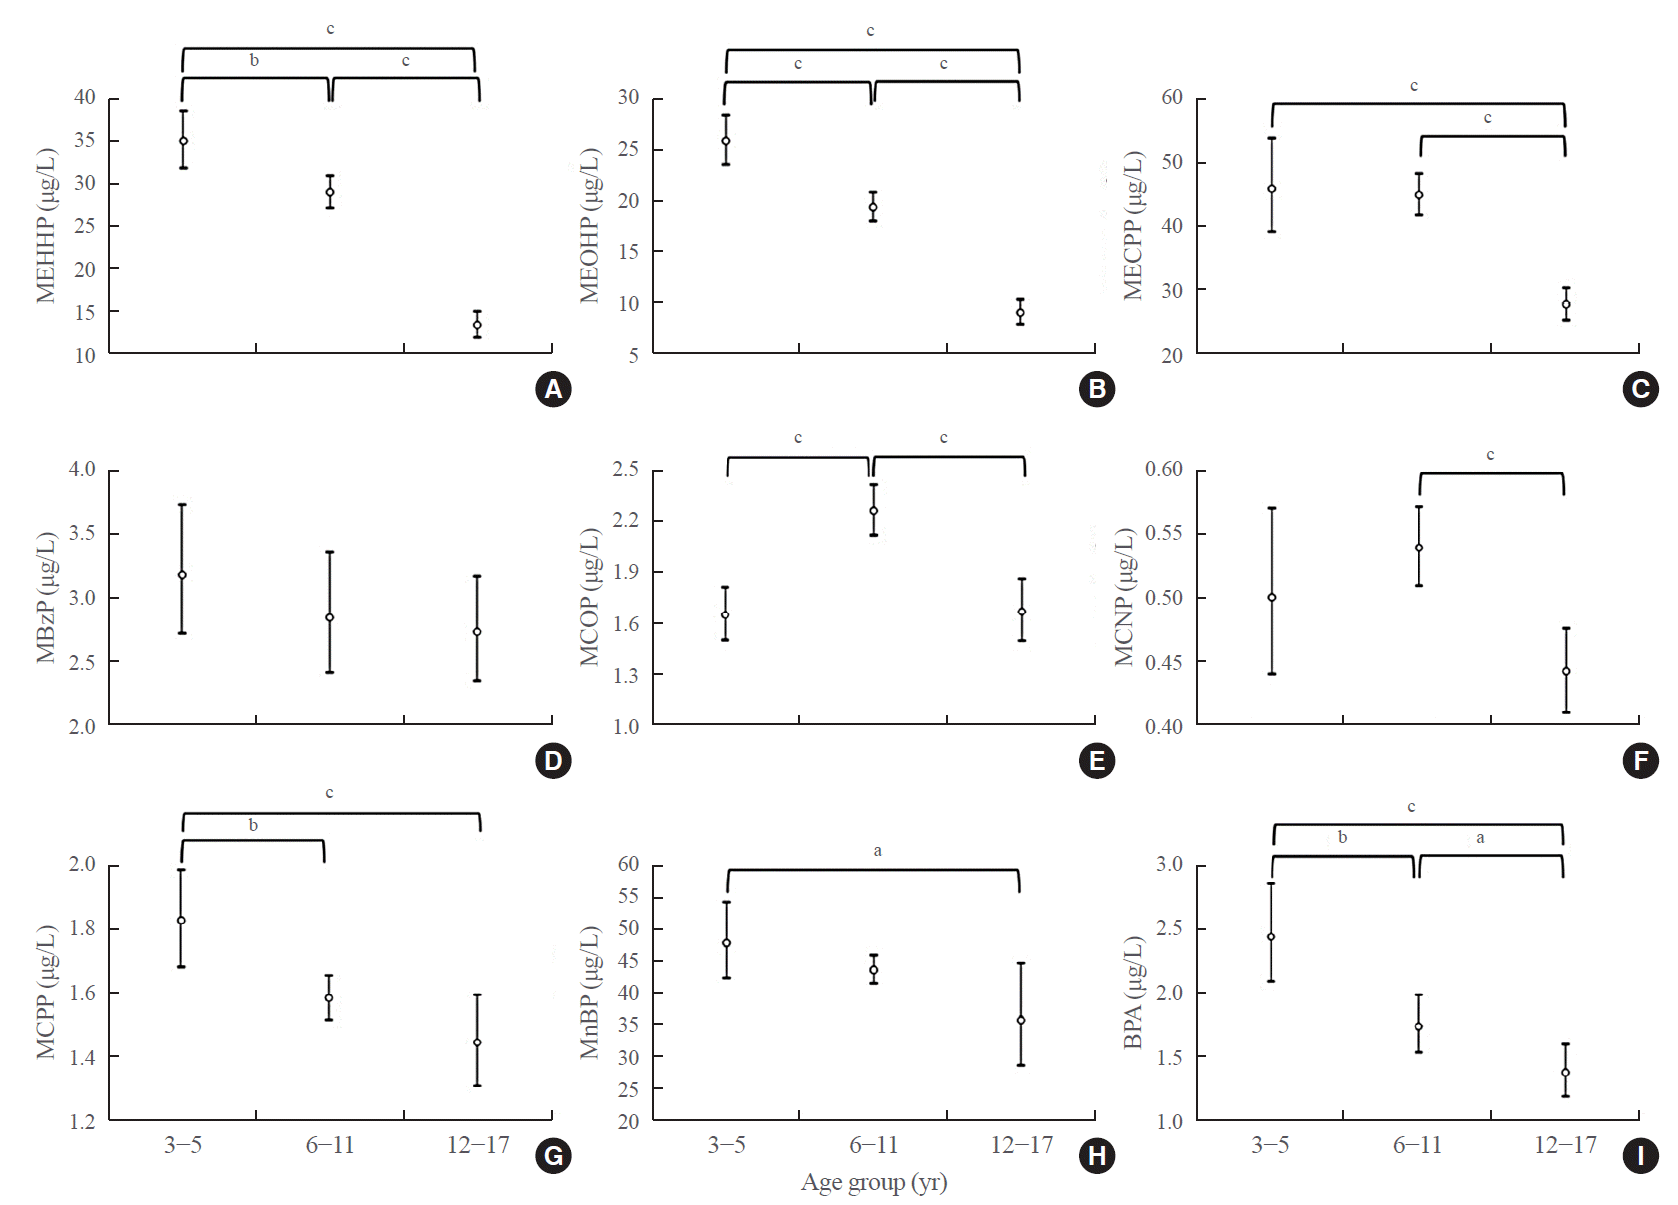
Comparisons of concentrations of phthalate metabolites and BPA by age

Fig. 1. presents the CAS-applied GM concentrations of urinary phthalate metabolites and BPA by age group. Phthalates and BPA levels were generally higher in younger age groups. The concentrations of MEHHP, MEOHP, MECPP, MCPP (P<0.001), MnBP (P<0.05), and BPA (P<0.001) were significantly higher in children aged 3 to 5 years than in those aged 12 to 17 years. Moreover, the concentrations of MEHHP (P<0.01), MEOHP (P<0.001), MCPP, and BPA (P<0.01) were significantly higher in children aged 3 to 5 years than in children aged 6 to 11 years. Meanwhile, both MCOP and MCNP levels were the highest in children aged 6 to 11 years.

Risk of obesity according to concentrations of phthalate metabolites and BPA

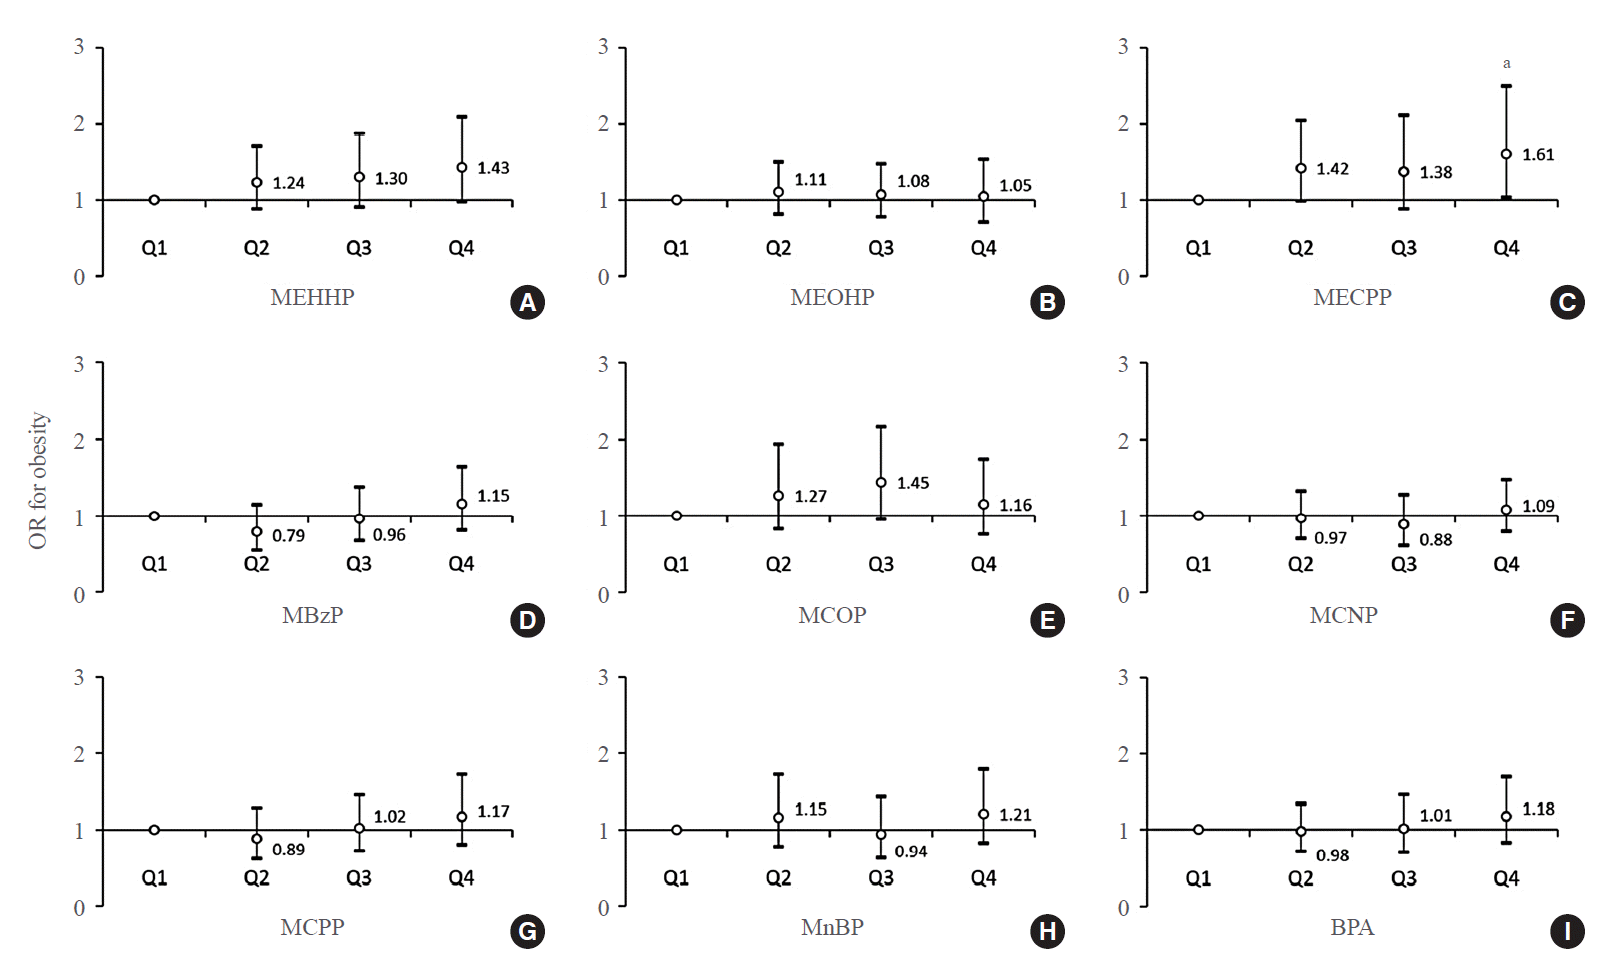
The crude and adjusted ORs with 95% confidence intervals (CIs) for obesity, according to the quartiles of urinary phthalate metabolites and BPA, are presented in Table 4. After adjusting for Ucr, none of the substances showed a significant association with obesity, regardless of covariate adjustment. However, following CAS, after adjusting for age and sex (model 1), none of the analytes except MECPP showed a significant association with obesity. Only MECPP showed a significant positive association with obesity (OR, 1.61; 95% CI, 1.04 to 2.48) in the highest quartile compared with the lowest quartile. After further adjustment for household income, urinary cotinine, junk food intake, and physical activity (model 2), a significantly higher OR remained in quartile 4 of MECPP (OR, 1.61; 95% CI, 1.03 to 2.50) than in quartile 1 (Fig. 2).

DISCUSSION

In this study, the concentrations of most urinary phthalate metabolites and BPA were higher in the younger participants. The concentrations of urinary DEHP metabolites and MnBP were higher in Korean children than in children in Western countries. Although MECPP concentrations showed a positive association with obesity, the other phthalate metabolites and BPA were not significantly associated with obesity in Korean children. This was the largest nationally representative study on phthalate and BPA exposure levels and their association with pediatric obesity in Asia. To the best of our knowledge, this is the first study to investigate the difference in phthalate and BPA concentrations by age group and their associations with childhood obesity, using the novel CAS method.
The urinary concentrations of DEHP metabolites and MnBP in Korean children in our study were notably higher than those in the United States [14], Canada [15], and Germany [16]. In contrast, the levels of the other HMWPs (MBzP, MCOP, MCNP, and MCPP) and BPA were not noticeably different across countries [14-16]. Differences in lifestyle patterns may explain disparities in exposure levels between countries [17]. In Korea, most residential settings have underfloor heating systems, which increase the DEHP emissions from PVC flooring materials. For this reason, DEHP exposure levels in Korea may be higher than those in most other countries that do not use underfloor heating [18]. Moreover, the inhabitants of countries such as Korea with a high consumption of delivered food may consume more food contaminated by DEHP and MnBP, which are often used in plastic food packaging, compared to countries that do not [19]. In addition, differences in phthalate regulations in each country may contribute to the differences in exposure levels [20].
We also demonstrated that most urinary phthalate metabolites and BPA showed significantly higher exposure levels at a younger age. These age-specific concentration differences are consistent with previously published studies in the United States [21] and Germany [16]. Younger children may be more vulnerable to phthalate exposure than older children, presumably because of more hand-to-mouth behavior and immature immune and metabolic systems [22].
Studies on phthalates and obesity are increasingly being reported, concomitantly with the rapidly increasing prevalence of obesity [3,6]. Multiple mechanisms by which phthalates cause obesity have been proposed. First, phthalates can induce obesity by influencing adipocyte differentiation and proliferation via PPARs or by binding to ERs [6]. Second, phthalates can lead to obesity by interfering with thyroid hormones by binding to TRs or by influencing the processes of thyroid hormone synthesis, secretion, transport, and metabolism [5,23]. Third, phthalates may contribute to obesity by interfering with the hypothalamic control of appetite and satiety [23,24].
In our study, most phthalate metabolites were not associated with obesity risk in Korean children, except for MECPP, which is one of the major DEHP metabolites. Although animal studies have generally observed positive associations with obesity [23,25-30], the major HMWPs, including DEHP metabolites, did not show any difference in urinary levels between obese and normal-weight groups among American [31,32], Chinese [33], Canadian [34], and Korean [35] children (Supplemental Table S1). Previously, we also reported nonsignificant differences in urinary phthalate metabolite levels according to obesity status, but showed a higher percentage fraction of MEHHP in urinary total DEHP metabolites in obese Korean girls than in controls [36]. Meanwhile, a recent study in Iranian children reported that most DEHP metabolites were positively related to obesity [37], which is consistent with the findings of our study.
MnBP, the only LMWP among the KoNEHS analytes, was not associated with obesity in this study. MnBP alone did not show a significant association with obesity in American children, but the sum of LMWP metabolites was positively related to obesity [38]. These positive associations between LMWP and obesity were also observed in non-Hispanic Blacks [31], American girls [32], and Chinese children [33,39].
However, as some studies have found negative associations between urinary phthalate metabolites and obesity in Chinese [39,40] and Taiwanese [41] children, the relationship between phthalate exposure and pediatric obesity has not yet been established.
In this study, no significant association was noted between BPA and obesity among Korean children, which is consistent with the findings of prior research from the United States [42], Germany [43], and India [44]. However, previous studies from the United States [45,46], Spain [47], Italy [48], and China [49] have reported positive associations between BPA and childhood obesity. In the United States, a positive association was observed in a previous National Health and Nutrition Examination Survey-based study [45,46], but no significant association was demonstrated in a more recent study [42]. Owing to the lack of large-scale longitudinal studies from diverse ethnic groups, it is unclear whether these disparities are due to racial differences in the metabolism e or degree of exposure to EDCs. As the dose-response associations of EDCs and health outcomes are mainly nonlinear, different associations may be derived in populations with varying levels of exposure [8]. In addition, the association may have been offset by applying traditional Ucr adjustment rather than CAS in most previous studies as an adjustment method for dilution [9]. Further research is warranted to understand the heterogeneity of the obesogenic effects of phthalates and BPA in epidemiological studies.
Unlike most previous studies, we used the CAS method instead of the conventional Ucr adjustment method to correct for urinary dilution. As Ucr has a positive association with BMI, collider stratification bias was a concern; therefore, adjusting Ucr as an independent covariate could neutralize or distort the association between urinary EDC concentrations and BMI-based obesity [8-10,50]. According to a regression model study examining the association between urinary arsenic exposure and BMI, a null association was observed when adjustment for urinary flow rate or the CAS method was performed without concern for collider stratification bias [10]. However, when Ucr was adjusted owing to concern over collider stratification bias, a negative association was observed, confirming the distortion of the actual association [10]. Our study findings demonstrate that the true association between MECPP exposure and obesity can be attenuated by Ucr adjustment, highlighting the necessity of using a urine dilution method appropriate for the study design. In particular, in studies of the association between urinary EDC levels and BMI-based obesity, it is advisable to adopt the CAS method to avoid collider stratification bias [10].
This study had some limitations. First, it is difficult to determine a causal relationship because of the nature of a cross-sectional study. Second, as spot urine samples were used, the findings cannot reflect the effects of long-term exposure [8]. Nevertheless, the main strength of this study is that it included the most recent data from large-scale pediatric population in Asia. Furthermore, to the best of our knowledge, this is the first study to highlight the association between phthalate/BPA exposure and childhood obesity using the CAS method.
In conclusion, Korean children had higher urinary levels of DEHP and MnBP than children in Western countries. In addition, most urinary phthalate metabolites and BPA showed higher levels at younger ages. The CAS-applied MECPP levels were positively associated with obesity in Korean children. This study facilitates endocrinologists’ understanding of the obesogenic effects of EDCs in children, provides a rationale for individuals to make an effort to prevent exposure to these substances, and suggests the need to reconsider appropriate age-specific regulations.

Supplementary Information

Supplemental Table S1.
Association between DEHP Exposure and Obesity in Animal Studies
enm-2021-1235-suppl.pdf

Notes

CONFLICTS OF INTEREST

No potential conflict of interest relevant to this article was reported.

AUTHOR CONTRIBUTIONS

Conception or design: M.Y.S., S.H.K., M.J.P. Acquisition, analysis, or interpretation of data: M.Y.S., S.M., S.H.K. Drafting the work or revising: M.Y.S., S.H.K., M.J.P. Final approval of the manuscript: M.Y.S., S.M., S.H.K., M.J.P.

ACKNOWLEDGMENTS

This study was supported by a research grant (Grant No. KSSO201902) from the Korean Society for the Study of Obesity. We thank the National Institute of Environmental Research (NIER-2016-BR-003-01, NIER-2016-BR-003-03), supported by the Ministry of Environment, Republic of Korea, for allowing us to use the data from the Korean National Environmental Health Survey.

REFERENCES

1. Ribeiro C, Mendes V, Peleteiro B, Delgado I, Araujo J, Aggerbeck M, et al. Association between the exposure to phthalates and adiposity: a meta-analysis in children and adults. Environ Res. 2019; 179(Pt A):108780.
crossref
2. Golestanzadeh M, Riahi R, Kelishadi R. Association of exposure to phthalates with cardiometabolic risk factors in children and adolescents: a systematic review and meta-analysis. Environ Sci Pollut Res Int. 2019; 26:35670–86.
crossref
3. Kim SH, Park MJ. Phthalate exposure and childhood obesity. Ann Pediatr Endocrinol Metab. 2014; 19:69–75.
crossref
4. Gore AC, Chappell VA, Fenton SE, Flaws JA, Nadal A, Prins GS, et al. EDC-2: the Endocrine Society’s second scientific statement on endocrine-disrupting chemicals. Endocr Rev. 2015; 36:E1–150.
crossref
5. Kim MJ, Park YJ. Bisphenols and thyroid hormone. Endocrinol Metab (Seoul). 2019; 34:340–8.
crossref
6. Stojanoska MM, Milosevic N, Milic N, Abenavoli L. The influence of phthalates and bisphenol A on the obesity development and glucose metabolism disorders. Endocrine. 2017; 55:666–81.
crossref
7. Kim KY, Lee E, Kim Y. The association between bisphenol A exposure and obesity in children: a systematic review with meta-analysis. Int J Environ Res Public Health. 2019; 16:2521.
crossref
8. Moon S, Seo MY, Choi K, Chang YS, Kim SH, Park MJ. Urinary bisphenol A concentrations and the risk of obesity in Korean adults. Sci Rep. 2021; 11:1603.
crossref
9. O’Brien KM, Upson K, Cook NR, Weinberg CR. Environmental chemicals in urine and blood: improving methods for creatinine and lipid adjustment. Environ Health Perspect. 2016; 124:220–7.
crossref
10. Bulka CM, Mabila SL, Lash JP, Turyk ME, Argos M. Arsenic and obesity: a comparison of urine dilution adjustment methods. Environ Health Perspect. 2017; 125:087020.
crossref
11. Hwang M, Choi K, Park C. Urinary levels of phthalate, bisphenol, and paraben and allergic outcomes in children: Korean National Environmental Health Survey 2015-2017. Sci Total Environ. 2022; 818:151703.
crossref
12. Kim JH, Yun S, Hwang SS, Shim JO, Chae HW, Lee YJ, et al. The 2017 Korean National Growth Charts for children and adolescents: development, improvement, and prospects. Korean J Pediatr. 2018; 61:135–49.
crossref
13. Geller RJ, Brotman RM, O’Brien KM, Fine DM, Zota AR. Phthalate exposure and odds of bacterial vaginosis among U.S. reproductive-aged women, NHANES 2001-2004. Reprod Toxicol. 2018; 82:1–9.
crossref
14. Centers for Disease Control and Prevention. Fourth National Report on Human Exposure to Environmental Chemicals 2019 [Internet]. Atlanta: CDC;2019. [cited 2022 Mar 21]. Available from: https://www.cdc.gov/exposurereport/pdf/FourthReport_UpdatedTables_Volume1_Jan2019-508.pdf.
15. Health Canada. Fifth Report on Human Biomonitoring of Environmental Chemicals in Canada: results of the Canadian Health Measures Survey Cycle 5 (2016-2017) [Internet]. Ottawa: Health Canada;2019. [cited 2022 Mar 21]. Available from: https://www.canada.ca/en/health-canada/services/environmental-workplace-health/reports-publications/environmental-contaminants/fifth-report-human-biomonitoring.html.
16. Schwedler G, Rucic E, Lange R, Conrad A, Koch HM, Palmke C, et al. Phthalate metabolites in urine of children and adolescents in Germany. Human biomonitoring results of the German Environmental Survey GerES V, 2014-2017. Int J Hyg Environ Health. 2020; 225:113444.
crossref
17. Park C, Hwang M, Baek Y, Jung S, Lee Y, Paek D, et al. Urinary phthalate metabolite and bisphenol A levels in the Korean adult population in association with sociodemographic and behavioral characteristics: Korean National Environmental Health Survey (KoNEHS) 2012-2014. Int J Hyg Environ Health. 2019; 222:903–10.
crossref
18. Jeon S, Kim KT, Choi K. Migration of DEHP and DINP into dust from PVC flooring products at different surface temperature. Sci Total Environ. 2016; 547:441–6.
crossref
19. Ding S, Zhang Z, Chen Y, Qi W, Zhang Y, Xu Q, et al. Urinary levels of phthalate metabolites and their association with lifestyle behaviors in Chinese adolescents and young adults. Ecotoxicol Environ Saf. 2019; 183:109541.
crossref
20. Lee J, Lee JH, Kim CK, Thomsen M. Childhood exposure to DEHP, DBP and BBP under existing chemical management systems: a comparative study of sources of childhood exposure in Korea and in Denmark. Environ Int. 2014; 63:77–91.
crossref
21. Lehmler HJ, Liu B, Gadogbe M, Bao W. Exposure to bisphenol A, bisphenol F, and bisphenol S in U.S. adults and children: the National Health and Nutrition Examination Survey 2013-2014. ACS Omega. 2018; 3:6523–32.
crossref
22. Liao C, Liu W, Zhang J, Shi W, Wang X, Cai J, et al. Associations of urinary phthalate metabolites with residential characteristics, lifestyles, and dietary habits among young children in Shanghai, China. Sci Total Environ. 2018; 616-617:1288–97.
crossref
23. Lv Z, Cheng J, Huang S, Zhang Y, Wu S, Qiu Y, et al. DEHP induces obesity and hypothyroidism through both central and peripheral pathways in C3H/He mice. Obesity (Silver Spring). 2016; 24:368–78.
crossref
24. Yilmaz B, Terekeci H, Sandal S, Kelestimur F. Endocrine disrupting chemicals: exposure, effects on human health, mechanism of action, models for testing and strategies for prevention. Rev Endocr Metab Disord. 2020; 21:127–47.
crossref
25. Su H, Yuan P, Lei H, Zhang L, Deng D, Zhang L, et al. Long-term chronic exposure to di-(2-ethylhexyl)-phthalate induces obesity via disruption of host lipid metabolism and gut microbiota in mice. Chemosphere. 2022; 287(Pt 4):132414.
crossref
26. Fan Y, Qin Y, Chen M, Li X, Wang R, Huang Z, et al. Prenatal low-dose DEHP exposure induces metabolic adaptation and obesity: role of hepatic thiamine metabolism. J Hazard Mater. 2020; 385:121534.
crossref
27. Chen MY, Liu HP, Cheng J, Chiang SY, Liao WP, Lin WY. Transgenerational impact of DEHP on body weight of Drosophila. Chemosphere. 2019; 221:493–9.
crossref
28. Campioli E, Martinez-Arguelles DB, Papadopoulos V. In utero exposure to the endocrine disruptor di-(2-ethylhexyl) phthalate promotes local adipose and systemic inflammation in adult male offspring. Nutr Diabetes. 2014; 4:e115.
crossref
29. Schmidt JS, Schaedlich K, Fiandanese N, Pocar P, Fischer B. Effects of di(2-ethylhexyl) phthalate (DEHP) on female fertility and adipogenesis in C3H/N mice. Environ Health Perspect. 2012; 120:1123–9.
crossref
30. Hao C, Cheng X, Xia H, Ma X. The endocrine disruptor mono-(2-ethylhexyl) phthalate promotes adipocyte differentiation and induces obesity in mice. Biosci Rep. 2012; 32:619–29.
31. Trasande L, Attina TM, Sathyanarayana S, Spanier AJ, Blustein J. Race/ethnicity-specific associations of urinary phthalates with childhood body mass in a nationally representative sample. Environ Health Perspect. 2013; 121:501–6.
crossref
32. Deierlein AL, Wolff MS, Pajak A, Pinney SM, Windham GC, Galvez MP, et al. Longitudinal associations of phthalate exposures during childhood and body size measurements in young girls. Epidemiology. 2016; 27:492–9.
crossref
33. Xia B, Zhu Q, Zhao Y, Ge W, Zhao Y, Song Q, et al. Phthalate exposure and childhood overweight and obesity: urinary metabolomic evidence. Environ Int. 2018; 121(Pt 1):159–68.
crossref
34. Ashley-Martin J, Dodds L, Arbuckle TE, Lanphear B, Muckle G, Foster WG, et al. Urinary phthalates and body mass index in preschool children: the MIREC Child Development Plus study. Int J Hyg Environ Health. 2021; 232:113689.
crossref
35. On J, Kim SH, Lee J, Park MJ, Lee SW, Pyo H. Urinary di(2-ethylhexyl)phthalate metabolite ratios in obese children of South Korea. Environ Sci Pollut Res Int. 2021; 28:29590–600.
crossref
36. Kim SH, On JW, Pyo H, Ko KS, Won JC, Yang J, et al. Percentage fractions of urinary di(2-ethylhexyl) phthalate metabolites: association with obesity and insulin resistance in Korean girls. PLoS One. 2018; 13:e0208081.
crossref
37. Amin MM, Ebrahimpour K, Parastar S, Shoshtari-Yeganeh B, Hashemi M, Mansourian M, et al. Association of urinary concentrations of phthalate metabolites with cardiometabolic risk factors and obesity in children and adolescents. Chemosphere. 2018; 211:547–56.
crossref
38. Buser MC, Murray HE, Scinicariello F. Age and sex differences in childhood and adulthood obesity association with phthalates: analyses of NHANES 2007-2010. Int J Hyg Environ Health. 2014; 217:687–94.
crossref
39. Zhang Y, Meng X, Chen L, Li D, Zhao L, Zhao Y, et al. Age and sex-specific relationships between phthalate exposures and obesity in Chinese children at puberty. PLoS One. 2014; 9:e104852.
crossref
40. Wu W, Wu P, Yang F, Sun DL, Zhang DX, Zhou YK. Association of phthalate exposure with anthropometric indices and blood pressure in first-grade children. Environ Sci Pollut Res Int. 2018; 25:23125–34.
crossref
41. Lien GW, Chen JH, Tien FW, Chen PC, Chen HW, Hwa HL, et al. Dilute-and-shoot enhances sensitivity of phthalate urinary concentrations for assessing the exposure in children. J Hazard Mater. 2018; 351:124–30.
crossref
42. Jacobson MH, Woodward M, Bao W, Liu B, Trasande L. Urinary bisphenols and obesity prevalence among U.S. children and adolescents. J Endocr Soc. 2019; 3:1715–26.
crossref
43. Kasper-Sonnenberg M, Koch HM, Wittsiepe J, Bruning T, Wilhelm M. Phthalate metabolites and bisphenol A in urines from German school-aged children: results of the Duisburg birth cohort and Bochum cohort studies. Int J Hyg Environ Health. 2014; 217:830–8.
crossref
44. Xue J, Wu Q, Sakthivel S, Pavithran PV, Vasukutty JR, Kannan K. Urinary levels of endocrine-disrupting chemicals, including bisphenols, bisphenol A diglycidyl ethers, benzophenones, parabens, and triclosan in obese and non-obese Indian children. Environ Res. 2015; 137:120–8.
crossref
45. Trasande L, Attina TM, Blustein J. Association between urinary bisphenol A concentration and obesity prevalence in children and adolescents. JAMA. 2012; 308:1113–21.
crossref
46. Eng DS, Lee JM, Gebremariam A, Meeker JD, Peterson K, Padmanabhan V. Bisphenol A and chronic disease risk factors in US children. Pediatrics. 2013; 132:e637–45.
crossref
47. Mustieles V, Casas M, Ferrando-Marco P, Ocon-Hernandez O, Reina-Perez I, Rodriguez-Carrillo A, et al. Bisphenol A and adiposity measures in peripubertal boys from the INMA-Granada cohort. Environ Res. 2019; 173:443–51.
crossref
48. D’Aniello R, Troisi J, D’Amico O, Sangermano M, Massa G, Moccaldo A, et al. Emerging pathomechanisms involved in obesity. J Pediatr Gastroenterol Nutr. 2015; 60:113–9.
crossref
49. Wang HX, Zhou Y, Tang CX, Wu JG, Chen Y, Jiang QW. Association between bisphenol A exposure and body mass index in Chinese school children: a cross-sectional study. Environ Health. 2012; 11:79.
crossref
50. Lee I, Park YJ, Kim MJ, Kim S, Choi S, Park J, et al. Associations of urinary concentrations of phthalate metabolites, bisphenol A, and parabens with obesity and diabetes mellitus in a Korean adult population: Korean National Environmental Health Survey (KoNEHS) 2015-2017. Environ Int. 2021; 146:106227.
crossref

Fig. 1.
The geometric mean concentrations of urinary phthalate metabolites and bisphenol A by age group. Covariate-adjusted standardization was applied to the analysis of the geometric mean concentration of the substances. (A) Mono (2-ethyl-5-hydroxyhexyl) phthalate (MEHHP), (B) mono (2-ethyl-5-oxohexyl) phthalate (MEOHP), (C) mono (2-ethyl-5-carboxypentyl) phthalate (MECPP), (D) mono-benzylphthalate (MBzP), (E) mono (carboxyoctyl) phthalate (MCOP), (F) mono (carboxy-isononyl) phthalate (MCNP), (G) mono (3-carboxypropyl) phthalate (MCPP), (H) mono-n-butyl-phthalate (MnBP), (I) bisphenol A (BPA). aP<0.05; bP<0.01; cP<0.001.
enm-2021-1235f1.tif
Fig. 2.
Adjusted odds ratios (95% confidence intervals) for obesity by quartiles of phthalate metabolite and bisphenol A (BPA) levels. Adjusted for age, sex, household income, urinary cotinine level, eating hamburgers or pizza ≥twice a week, and play/exercise with sweating ≥ 3 times a week. Covariate-adjusted standardization was applied to the analysis of the geometric mean concentration of each substance. The quartile values of urinary phthalate metabolite and BPA levels were as follows: (A) mono (2-ethyl-5-hydroxyhexyl) phthalate (MEHHP; <14.18, 14.19–23.65, 23.67–38.75, >38.78 µg/L), (B) mono (2-ethyl-5-oxohexyl) phthalate (MEOHP; <9.70, 9.70–16.10, 16.14–26.32, >26.34 µg/L), (C) mono (2-ethyl-5-carboxypentyl) phthalate (MECPP; <23.97, 24.02–36.28, 36.29–57.26, 7gt;57.32 µg/L), (D) mono-benzyl-phthalate (MBzP; <1.49, 1.49–3.00, 3.00–6.41, >6.43 µg/L), (E) mono (carboxyoctyl) phthalate (MCOP; <1.18, 1.18–1.78, 1.78–2.82, >2.83 µg/L), (F) mono (carboxy-isononyl) phthalate (MCNP; <0.33, 0.33–0.48, 0.48–0.71, >0.71 µg/L), (G) mono (3-carboxypropyl) phthalate (MCPP; <1.09, 1.09–1.51, 1.51–2.13, >2.13 µg/L), (H) mono-n-butyl-phthalate (MnBP; <26.65, 26.80–41.77, 41.80–63.13, >63.18 µg/L), (I) BPA (<0.97, 0.97–1.89, 1.90–3.44, >3.44 µg/L). aP<0.05.
enm-2021-1235f2.tif
enm-2021-1235f3.tif
Table 1.
General Characteristics of the Study Participants (n=2,351)
Variable Boys (n=1,163) Girls (n=1,188) P value
Age, yr 9.8±0.4 9.7±0.4 0.669
School age 0.740
Preschoolers (3–5 yr, n=571) 285 (24.0) 286 (24.7)
Elementary schoolers (6–11 yr, n=884) 451 (37.3) 433 (38.1)
Middle-high schoolers (12–17 yr, n=896) 427 (38.7) 469 (37.2)
Body mass index status 0.030
Underweight 51 (4.3) 46 (4.2)
Normal 769 (67.0) 852 (72.2)
Overweight 133 (10.5) 134 (10.3)
Obese 210 (18.2) 156 (13.3)
Household income, KRW 0.462
<1,000,000 21 (1.6) 14 (1.1)
1,000,000–<2,000,000 81 (7.5) 102 (7.6)
2,000,000–<3,000,000 184 (14.6) 156 (12.2)
3,000,000–<5,000,000 393 (33.0) 439 (37.5)
5,000,000–<7,000,000 277 (25.2) 275 (23.9)
≥7,000,000 155 (14.1) 148 (13.3)
Unknown 52 (4.0) 54 (4.4)
Eating hamburgers or pizza ≥twice a week 0.002
No 1,112 (95.2) 1,162 (98.0)
Yes 51 (4.8) 26 (2.0)
Play/Exercise with sweating ≥3 times a week 0.000
No 453 (38.9) 750 (64.1) -
Yes 710 (61.1) 438 (35.9) -
Urine cotinine, µg/L 21.5±5.3 7.6±3.5 0.006
Urine creatinine, mg/dL 1.5±0.1 1.3±0.0 0.000

Values are expressed as mean±standard error or number (%a).

KRW, Korean won.

a Weighted percentages after accounting for the sampling design.

Table 2.
Distribution of Concentrations of Phthalate Metabolites and Bisphenol A
Parent compound of analytes Analytes LOD, μg/L Detection rate, % Geometric mean (95% confidence interval), μg/L
P value
Total (n=2,351) Boys (n=1,163) Girls (n=1,188)
HMWPs
 DEHP MEHHP 0.056 100.0 22.7 (20.7–24.8) 23.6 (21.2–26.4) 21.8 (19.5–24.2) 0.172
MEOHP 0.048 99.9 15.6 (14.2–17.2) 16.2 (14.3–18.3) 15.0 (13.5–16.8) 0.265
MECPP 0.141 100.0 37.7 (35.0–40.6) 39.1 (35.8–42.6) 36.4 (33.3–39.7) 0.108
 BBzP MBzP 0.066 95.4 2.9 (2.6–3.2) 3.2 (2.8–3.6) 2.6 (2.3–2.9) 0.003
 DNP MCOP 0.048 99.2 1.9 (1.8–2.0) 1.9 (1.7–2.0) 1.9 (1.7–2.0) 0.655
 DDP MCNP 0.139 96.8 0.5 (0.5–0.5) 0.5 (0.5–0.5) 0.5 (0.5–0.5) 0.175
 DnOP MCPP 0.078 99.7 1.6 (1.5–1.7) 1.6 (1.5–1.7) 1.5 (1.5–1.6) 0.094
LMWPs
 DnBP MnBP 0.040 99.8 41.5 (37.8–45.6) 43.3 (38.7–48.4) 39.8 (35.9–44.1) 0.130
BPA BPA 0.075 97.3 1.7 (1.6–1.9) 1.7 (1.5–1.9) 1.7 (1.6–1.9) 0.996

Phthalate metabolite concentrations are shown after substituting the < LOD values by LOD/√2.

LOD, limit of detection; HMWP, high-molecular-weight phthalate; DEHP, di (2-ethylhexyl) phthalate; MEHHP, mono (2-ethyl-5-hydroxyhexyl) phthalate; MEOHP, mono (2-ethyl-5-oxohexyl) phthalate; MECPP, mono (2-ethyl-5-carboxypentyl) phthalate; BBzP, benzylbutyl phthalate; MBzP, monobenzyl-phthalate; DNP, di-isononyl phthalate; MCOP, mono (carboxyoctyl) phthalate; DDP, di-isodecyl phthalate; MCNP, mono (carboxy-isononyl) phthalate; DnOP, di-n-octyl phthalate; MCPP, mono (3-carboxypropyl) phthalate; LMWP, low-molecular-weight phthalate; DnBP, di-n-butyl phthalate; MnBP, mono-n-butyl-phthalate; BPA, bisphenol A.

Table 3.
Comparison of the Geometric Mean Concentrations of Urinary Phthalate Metabolites and Bisphenol A by Country
Data source Korea United States Canada Germany
KoNEHS (2015–2017)
NHANES (2015–2016)
CHMS (2016–2017)
GerES (2014–2017)
Age: 3–17 years Age: 3–19 years Age: 3–19 years Age: 3–17 years
Male: 49.5% Male: 49.5% Male: not described Male: 51.6%
n=2,351 n=2,975 n=1,615 n=2,256
Age, yr 3–5 6–11 12–17 3–5 6–11 12–19 3–5 6–11 12–19 3–17
MEHHP, µg/L 34.5 28.7 13.7 8.7 8.8 5.8 12.0 9.7 5.9 NA
MEOHP, µg/L 25.5 19.2 9.3 5.8 6.0 3.8 8.5 7.0 4.0 7.6
MECPP, µg/L 45.2 44.5 28.4 14.9 14.6 9.4 15.0 13.0 6.9 11.9
MBzP, µg/L 3.1 2.8 2.8 8.3 10.7 6.1 7.7 10.0 5.3 3.1
MCOP, µg/L 1.6 2.2 1.7 9.1 11.1 10.3 1.3 1.3 1.2 NA
MCNP, µg/L 0.5 0.5 0.5 2.1 2.3 2.2 Could not be calculated because >40% of samples were below the LOD NA
MCPP, µg/L 1.8 1.6 1.5 1.7 1.8 1.3 1.3 1.3 0.9 1.5
MnBP, µg/L 47.3 43.2 36.7 10.9 14.4 11.6 20.0 20.0 16.0 20.9
BPA, µg/L 2.4 1.7 1.4 NAa 1.4a 1.3a 0.9 1.0 1.0 1.9

KoNEHS, Korean National Environmental Health Survey; NHANES, National Health and Nutrition Examination Survey; CHMS, Canadian Health Measures Survey; GerES, German Environmental Survey; MEHHP, mono (2-ethyl-5-hydroxyhexyl) phthalate; NA, not applicable; MEOHP, mono (2-ethyl-5-oxohexyl) phthalate; MECPP, mono (2-ethyl-5-carboxypentyl) phthalate; MBzP, mono-benzyl-phthalate; MCOP, mono (carboxyoctyl) phthalate; MCNP, mono (carboxy-isononyl) phthalate; LOD, limit of detection; MCPP, mono (3-carboxypropyl) phthalate; MnBP, mono-n-butyl-phthalate; BPA, bisphenol A.

a Exceptionally based on the 2013–2014 NHANES, which was not included in the Fourth National Report on Human Exposure to Environmental Chemicals by the 2015–2016 NHANES.

Table 4.
Risk for Obesity According to the Quartiles of Phthalate Metabolites and Bisphenol A levels
Variable Ucr adjustment P value CAS P value
MEHHP
 Crude 1.19 (0.81–1.75) 0.381 1.33 (0.89–1.98) 0.167
 Model 1 1.07 (0.71–1.60) 0.758 1.43 (0.98–2.09) 0.065
 Model 2 1.06 (0.70–1.60) 0.783 1.43 (0.98–2.10) 0.063
MEOHP
 Crude 1.13 (0.78–1.63) 0.531 1.05 (0.71–1.54) 0.818
 Model 1 0.98 (0.66–1.44) 0.911 1.07 (0.72–1.57) 0.741
 Model 2 0.96 (0.65–1.42) 0.838 1.05 (0.72–1.54) 0.796
MECPP
 Crude 1.12 (0.76–1.63) 0.569 1.55 (1.04–2.29) 0.030
 Model 1 1.02 (0.67–1.55) 0.937 1.61 (1.04–2.48) 0.033
 Model 2 1.01 (0.66–1.55) 0.955 1.61 (1.03–2.50) 0.035
MBzP
 Crude 0.98 (0.65–1.47) 0.901 1.21 (0.85–1.71) 0.294
 Model 1 0.90 (0.59–1.39) 0.632 1.16 (0.82–1.65) 0.410
 Model 2 0.89 (0.58–1.37) 0.595 1.16 (0.81–1.64) 0.420
MCOP
 Crude 1.07 (0.76–1.51) 0.683 1.18 (0.79–1.77) 0.417
 Model 1 1.00 (0.71–1.42) 0.994 1.17 (0.78–1.76) 0.433
 Model 2 0.99 (0.69–1.43) 0.975 1.16 (0.77–1.75) 0.486
MCNP
 Crude 1.01 (0.64–1.60) 0.962 1.11 (0.82–1.52) 0.485
 Model 1 0.99 (0.63–1.57) 0.969 1.11 (0.81–1.51) 0.519
 Model 2 0.98 (0.62–1.55) 0.924 1.09 (0.80–1.48) 0.589
MCPP
 Crude 1.04 (0.69–1.55) 0.855 1.19 (0.82–1.72) 0.364
 Model 1 1.00 (0.65–1.53) 0.996 1.17 (0.80–1.71) 0.416
 Model 2 0.98 (0.64–1.50) 0.940 1.17 (0.80–1.72) 0.421
MnBP
 Crude 0.92 (0.63–1.34) 0.658 1.24 (0.85–1.80) 0.258
 Model 1 0.81 (0.53–1.23) 0.312 1.21 (0.82–1.78) 0.345
 Model 2 0.80 (0.52–1.22) 0.302 1.21 (0.78–1.71) 0.341
BPA
 Crude 1.14 (0.75–1.73) 0.543 1.16 (0.78–1.72) 0.450
 Model 1 1.10 (0.74–1.63) 0.651 1.17 (0.81–1.69) 0.392
 Model 2 1.11 (0.74–1.64) 0.622 1.18 (0.82–1.69) 0.362

Values are expressed as odds ratios (95% confidence intervals) for the highest quartile relative to the lowest quartile. The covariate-adjusted standardization was applied to the analysis of the geometric mean concentration of the study substance. Model 1: adjusted for age and sex (+urinary creatinine in the Ucr adjustment method); Model 2: adjusted for model 1+household income, urinary cotinine, eating hamburger or pizza ≥twice a week, play/exercise with sweating ≥3 times a week (+urinary creatinine in the Ucr adjustment method).

Ucr, urinary creatinine; CAS, covariate-adjusted standardization; MEHHP, mono (2-ethyl-5-hydroxyhexyl) phthalate; MEOHP, mono (2-ethyl-5-oxohexyl) phthalate; MECPP, mono (2-ethyl-5-carboxypentyl) phthalate; MBzP, mono-benzyl-phthalate; MCOP, mono (carboxyoctyl) phthalate; MCNP, mono (carboxy-isononyl) phthalate; MCPP, mono (3-carboxypropyl) phthalate; MnBP, mono-n-butyl-phthalate; BPA, bisphenol A.

TOOLS
Similar articles