Journal List > Endocrinol Metab > v.37(2) > 1516079174

Choi, Seo, Lee, Lee, Yoon, and Park: Association between Elevated Plasma Homocysteine and Low Skeletal Muscle Mass in Asymptomatic Adults

Abstract

Background

Homocysteine has been drawing attention with a closed linkage with skeletal muscle. However, the association of hyperhomocysteinemia with decreased skeletal muscle mass remains unclear. We aimed to investigate the association of hyperhomocysteinemia with low skeletal muscle mass (LMM) in asymptomatic adults.

Methods

This was a cross-sectional study of 114,583 community-dwelling adults without cancer, stroke, or cardiovascular diseases who underwent measurements of plasma homocysteine and body composition analysis from 2012 to 2018. Hyperhomocysteinemia was defined as >15 μmol/L. Skeletal muscle mass index (SMI) was calculated based on appendicular muscle mass (kg)/height (m)2. Participants were classified into three groups based on SMI: “normal,” “mildly low,” and “severely low.”

Results

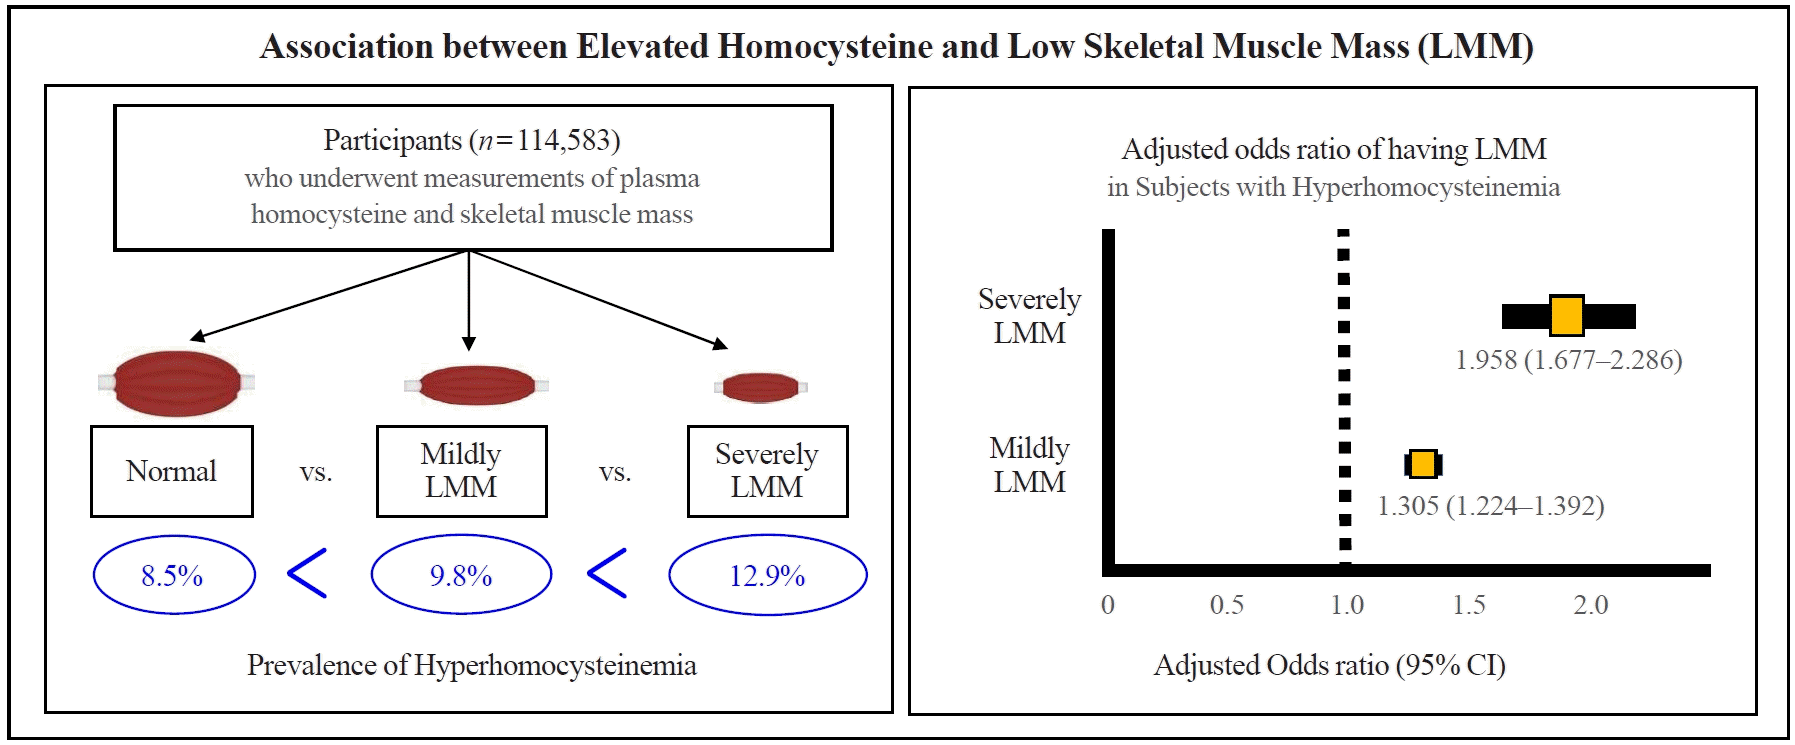
The prevalence of hyperhomocysteinemia was the highest in subjects with severely LMM (12.9%), followed by those with mildly LMM (9.8%), and those with normal muscle mass (8.5%) (P for trend <0.001). In a multivariable logistic regression model, hyperhomocysteinemia was significantly associated with having a mildly LMM (odds ratio [OR], 1.305; 95% confidence interval [CI], 1.224 to 1.392) and severely LMM (OR, 1.958; 95% CI, 1.667 to 2.286), respectively. One unit increment of log-transformed homocysteine was associated with 1.360 and 2.169 times higher risk of having mildly LMM and severely LMM, respectively.

Conclusion

We demonstrated that elevated homocysteine has an independent association with LMM in asymptomatic adults, supporting that hyperhomocysteinemia itself can be a risk for decline in skeletal musculature.

Graphical abstract

INTRODUCTION

Loss of skeletal muscle mass has unfavorable consequences on chronic diseases and is an emerging health challenge of the global aging population [1]. Skeletal muscle loss and wasting can be accompanied by a decline in muscle strength, thus increasing risks of falls, fracture, disability, and mortality [24]. Furthermore, a low skeletal muscle mass (LMM) has known to be associated with negative outcomes in cardiovascular diseases [5], stroke [6], chronic obstructive lung disease [7], and cancer [8]. Many studies have reported that aging, physical inactivity, nutritional factor, hormonal changes, and chronic metabolic diseases are risk factors for LMM or sarcopenia [9].
Recently, metabolic risk factor such as increased plasma homocysteine level has been drawing attention with a closed linkage with skeletal muscle. Elevated plasma homocysteine is known to be as a metabolic risk factor for coronary heart diseases or cerebrovascular disease [10,11]. Excess of homocysteine can affect multiple organs by triggering the formation of active oxygen species and provocation of endothelial and smooth muscle cell dysfunction, resulting in atherogenesis of multiple vessels [10,11]. A few recent studies have suggested that high homocysteine is associated with an increased risk of osteoporotic fractures, renal dysfunction, dementia [10,11]. Furthermore, a close relation of increased homocysteine with physical performance has been noted [12]. Although there are some studies on the association between sarcopenia and homocysteine [1317], but these studies show conflicting results regarding the association between skeletal muscle mass and homocysteine level. Furthermore, these studies limited the age of the subjects to the old age. However, several past studies reported that although sarcopenic obesity is generally described as an age-related phenomenon, it is a multifactorial disease including physical inactivity that can occur in young and middle-aged populations [18,19]. Therefore, to elucidate the relationship between skeletal muscle loss and homocysteine levels, young and middle-aged populations should be included. Lastly, previous studies had small sample sizes with limited consideration of confounding factors associated with sarcopenia [9,20,21] or homocysteine level [22,23]. Therefore, it is necessary to confirm the association between elevated plasma homocysteine level and LMM with a large-scaled study.
The aim of this study was to assess the association of elevated homocysteine level with skeletal muscle mass in asymptomatic adults. Additionally, we evaluated the association between hyperhomocysteinemia and LMM in various subgroup analyses by clinically relevant factors.

METHODS

Study subjects

This was a two-center, cross-sectional study. It was conducted to investigate the association of LMM with the presence of hyperhomocysteinemia in Korean population. Study subjects were recruited from a medical health screening program at the two health promotion centers of university hospital in South Korea. From September 1, 2012 to December 31, 2018, a total of 121,454 participants (18 to 95 years old) who were examined for both body composition analysis and total plasma homocysteine value were included. Exclusion criteria were as follows: (1) history of malignancy, (2) history of stroke and/or current medication of stroke, and (3) history of cardiovascular disease and/or current medication of cardiovascular disease. Exclusion criteria were established based on previous studies to evaluate the independent association of plasma homocysteine with LMM. Stroke and cardiovascular disease have been reported to be associated not only with sarcopenia itself [9,21], but also with elevated homocysteine levels regardless of muscle mass [23]. Subjects with malignancy are also known to be associated with LMM because of multiple causes including chemotherapy and malnutrition [24,25]. Cases missing the following continuous variables were excluded to have accurate statistical analysis by biostatistics expert: age, systolic blood pressure, C-reactive protein (CRP), glycosylated hemoglobin (HbA1c), creatinine, and low-density lipoprotein cholesterol (LDL-C). Finally, a total of 114,583 subjects were analyzed to determine the association between hyperhomocysteinemia and LMM (Supplemental Fig. S1).
This study protocol was approved by the Institutional Review Board (IRB) of Kangbuk Samsung Hospital (IRB No. 2021-01-025). The requirement for informed consent was exempted by the IRB since we only accessed de-identified datasets routinely collected as part of the health screening exam.

Measurements

Demographic characteristics, health associated behavior variables (alcohol history, smoking status, physical activity), and medical history (history of hypertension, diabetes mellitus, heart disease, stroke, and hyperlipidemia) were collected by examining physicians using standardized questionnaires. Subjects with smoking history were categorized into never-smokers, former smokers, and current smokers. Those with alcohol consumption over 20 g/day were categorized into a heavy drinking group [26,27]. Physical activity was assessed using the International Physical Activity Questionnaire-Short Form. Subjects who performed vigorous exercise ≥three times a week for over 20 min/session were categorized as a regular physical activity group [28].
Blood sample and anthropometric measurements were done by trained nurses or medical laboratory technologists. Biochemical parameters included total plasma homocysteine, serum creatinine, CRP, total cholesterol, LDL-C, high-density lipoprotein cholesterol, triglycerides, fasting glucose, HbA1c, and alanine aminotransferase. Hyperhomocysteinemia was defined as more than 15 μmol/L of plasma total homocysteine level [2931]. The distribution of plasma homocysteine levels was positively skewed. Therefore, we used natural log-transformed (Ln) homocysteine values which provided the best-fitting model for analysis in which homocysteine level was treated as a continuous variable.
Appendicular skeletal muscle mass (ASM, kg) as the sum of muscle mass of arms and legs was measured using bioelectrical impedance analysis (BIA, InBody 720, Biospace, Seoul, Korea). The BIA was calibrated every morning prior to the test and validated for reproducibility and accuracy for analysis of skeletal muscle mass. Skeletal muscle mass index (SMI) was calculated using the following formula: SMI (kg/m2)=ASM (kg)/height (m)2 [32].

Classification according to skeletal muscle mass

Subjects were classified into three groups according to muscle mass: “normal,” “mildly low,” and “severely low.” These classification criteria were based on several previous studies [32,33]. Normal muscle mass was defined as SMI value higher than −1 standard deviation (SD) of the gender-specific mean of young adults (age, 18 to 39 years). Mildly LMM was defined as SMI value within −1 to −2 SD of gender-specific mean of young adults. Severely LMM was defined as SMI value >2 SD below the gender-specific mean of young adults. Gender-specific cutoff values for mildly and severely LMM were 7.39 and 6.69 kg/m2 in men, and 5.44 and 4.78 kg/m2 in women, respectively.

Statistical analysis

Baseline characteristics of study groups were compared by one-way analysis of variance (ANOVA) for continuous variables and chi-square test for categorical variables. Proportion of hyperhomocysteinemia in each group classified by skeletal muscle mass was compared by chi-square test and post hoc analysis corrected by Bonferroni method. Multivariable logistic regression analyses were conducted to assess the association between hyperhomocysteinemia and LMM using three models adjusting for possible confounding variables. These confounding variables were selected based on baseline characteristics and previous studies of the risk factor of sarcopenia [9,20]. The first model (model 1) was adjusted for age, sex, and health care screening center (2 in total). The second model (model 2) was additionally adjusted for laboratory and biochemical variables such as systolic blood pressure, HbA1c, LDL-C, CRP, and creatinine. Model 3 was additionally adjusted for health behavioral factors such as smoking status, alcohol drinking, and regular physical activity. Odds ratios (ORs) were calculated as risks of having mildly or severely LMM in subjects with hyperhomocysteinemia compared to that in subjects with normal plasma homocysteine levels. We introduced homocysteine level as both categorical (normal homocysteine vs. hyperhomocysteinemia) and continuous (natural log-transformed homocysteine) variables in each multivariable logistic regression analysis. We repeated multivariable logistic regression analysis by using the model 3 for subgroup analyses in subjects stratified by the following variables: age (<40 years vs. 40≤ age <60 years vs. ≥60 years), gender (male vs. female), smoking status (current smoker vs. non- or ex-smoker), alcohol intake (heavy alcohol drinking vs. non-heavy alcohol drinking), physical activity (health enhancing regular physical activity vs. low activity), and HbA1c (≥6.5% vs. <6.5%). Interactions by subgroup were conducted using likelihood ratio tests comparing models with and without multiplicative interaction terms. Lastly, adjusted means of Ln (homocysteine) value in each group classified by skeletal muscle mass were compared by analysis of covariance (ANCOVA) using model 3. The level of statistical significance was set at two-tailed P<0.05. All analyses were conducted using IBM SPSS version 26.0 (IBM Co., Armonk, NY, USA).

RESULTS

Baseline demographic characteristics

Baseline demographic characteristics of study subjects are shown in Table 1. The mean age of all subjects was 38.39±10.84 years. The proportion of men was 94.6% (108,396 subjects). Proportions of subjects with normal muscle mass, mildly LMM, and severely LMM were 85.4% (97,820 subjects), 13.0% (14,904 subjects), and 1.6% (1,859 subjects), respectively. Between group differences of baseline characteristics were significant for all variables (P<0.001) except for chronic kidney disease (P=0.089).

Plasma homocysteine level of each group classified based on skeletal muscle mass

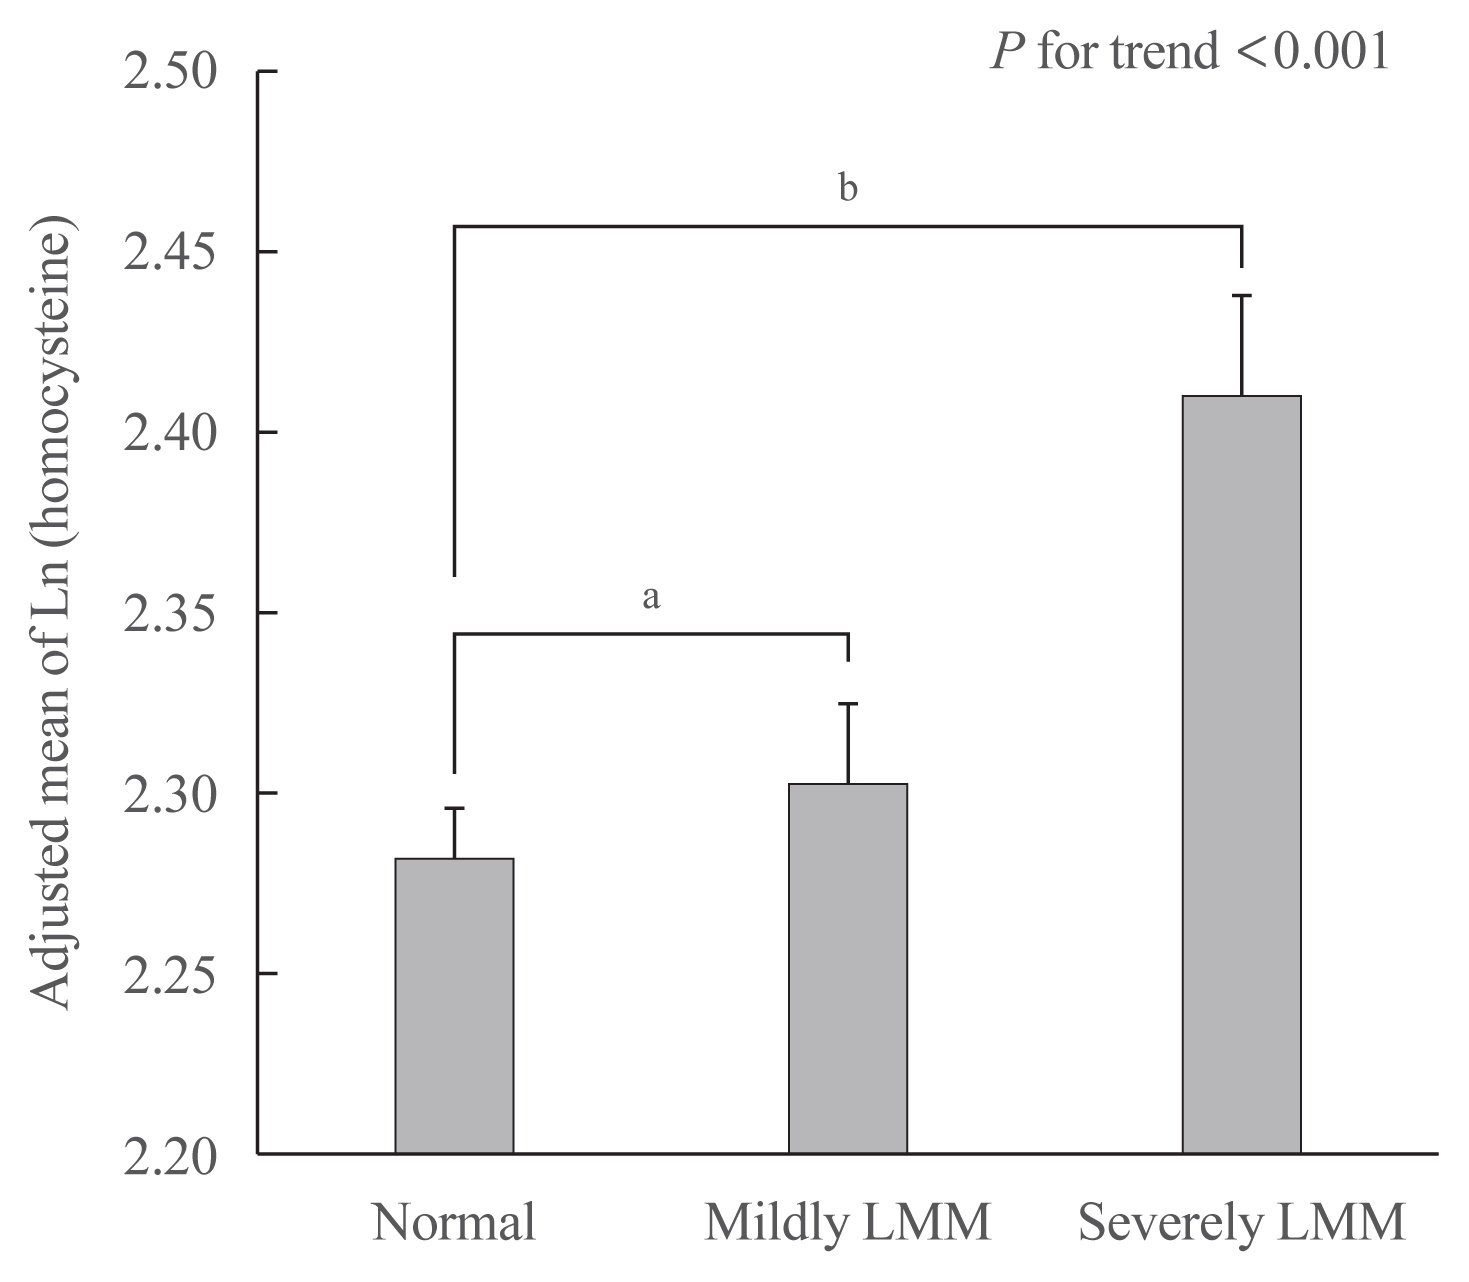
The prevalence of hyperhomocysteinemia was highest in subjects with severely LMM (12.9%), followed by that in subjects with mildly LMM (9.8%) and that in subjects with normal muscle mass (8.5%) (P for trend <0.001). There were significant differences in all group comparisons (all P<0.001; post hoc analysis) (Table 2). Adjusted mean of Ln (homocysteine) was highest in subjects with severely LMM, followed by that in subjects with mildly LMM and that in subjects with normal muscle mass (P for trend <0.001) (Fig. 1). In post hoc analysis, there were significant group differences of adjusted means of Ln (homocysteine) between normal muscle mass and mildly LMM groups (P=0.009) and between normal and severely LMM groups (P<0.001).

Association between increased plasma homocysteine and low skeletal muscle mass

Results of univariable and multivariable logistic regression analyses assessing the association between the hyperhomocysteinemia and LMM are presented in Table 3. In Model 1 adjusting for age, sex, and center, there were significant associations between hyperhomocysteinemia and LMM (OR, 1.135; 95% confidence interval [CI], 1.070 to 1.203 for the risk of mildly LMM and OR, 1.441; 95% CI, 1.254 to 1.656 for the risk of severely LMM). Analysis using model 2, additionally adjusting for possible clinical confounders (systolic blood pressure, HbA1c, LDL-C, CRP, creatinine), showed that hyperhomocysteinemia was associated with a lower skeletal muscle mass (OR, 1.333; 95% CI, 1.255 to 1.416 for mildly LMM and OR, 1.918; 95% CI, 1.664 to 2.211 for severely LMM). In model 3, additionally adjusting for possible health-behavior confounder such as smoking status, heavy drinking, and regular physical activity, hyperhomocysteinemia was significantly associated with having mildly LMM (OR, 1.305; 95% CI, 1.224 to 1.392) and severely LMM (OR, 1.958; 95% CI, 1.667 to 2.286).
We conducted multivariable logistic regression analysis by introducing homocysteine level as a continuous variable (Table 4). In Model 1, there was a significant association between higher Ln (homocysteine) and LMM (OR, 1.384; 95% CI, 1.187 to 1.614 for severely LMM). Model 2 analysis showed that higher level of Ln (homocysteine) was associated with lower skeletal muscle mass (OR, 1.367; 95% CI, 1.284 to 1.455 for mildly LMM and OR, 2.131; 95% CI, 1.833 to 2.477 for severely LMM). Model 3 analysis revealed a significant association of higher Ln (homocysteine) with a lower skeletal muscle mass (OR, 1.360; 95% CI, 1.273 to 1.453 for mildly LMM and OR, 2.169; 95% CI, 1.843 to 2.554 for severely LMM).

Subgroup analysis of clinically relevant factors

Subgroup analyses between hyperhomocysteinemia and LMM were conducted in groups stratified by age, sex, smoking status, alcohol intake, physical activity, and HbA1c. Results are presented in Table 5. In each subgroup, logistic regression analyses showed significant associations of hyperhomocysteinemia with LMM (all P value <0.001). Subgroups by age were analyzed (<40 years vs. 40≤ age <60 years vs. ≥60 years). The adjusted ORs showing the association of hyperhomocysteinemia with LMM was highest in old-aged subgroup (≥60 years) compared to other subgroups (P for interaction <0.001). Furthermore, the adjusted ORs were significantly higher in female, current smoker, heavy alcohol drinking group, low physical activity and increased HbA1c (≥6.5%) than those in each other subgroups, respectively (all P for interaction <0.001).

DISCUSSION

Summary

Using a large number of subjects without cardiovascular disease, the present study revealed that hyperhomocysteinemia was strongly associated with decreased muscle mass in asymptomatic community dwelling adults, even after adjusting for possible confounding factors. Furthermore, this association persisted in subgroup analyses by various clinically relevant factors such as age, sex, smoking, alcohol intake, physical activity, and HbA1c.

Previous clinical studies reporting the association between hyperhomocysteinemia and skeletal muscle loss

Hyperhomocysteinemia is a metabolic disease characterized by defects in homocysteine metabolism that are caused by genetic or nutritional defects [34]. Under normal conditions, the synthesis and clearance of homocysteine is balanced. However, in a diseased state, homocysteine synthesis is faster than clearing, resulting in excessive release of homocysteine into the blood, a condition called hyperhomocysteinemia [35].
Although pathophysiological pathways supporting the association between hyperhomocysteinemia and LMM remain unclear, a few clinical studies have assessed the association between elevated plasma homocysteine and sarcopenia or its component (skeletal muscle mass, strength, or walking speed). Swart et al. [36] have reported that higher plasma homocysteine level is associated with weak grip strength. Vidoni et al. [14] have shown a correlation between plasma homocysteine level and grip strength in their follow-up study of 1,101 subjects. Besides grip strength, muscle mass is also associated with homocysteine. Wang et al. [13] have demonstrated a significant association between hyperhomocysteinemia and LMM in elderly hemodialysis patients. In 2020, Lee et al. [15] of Taiwan conducted a retrospective study of 1,582 aged over 50 years. They reported an association between log-transformed homocysteine and sarcopenia including grip strength, walking speed, and muscle mass. However, all these studies had small sample sizes with limited consideration of confounding factors associated with sarcopenia [9,20,21] or homocysteine level [22,23]. To the best of our knowledge, the present study is the first large-scaled study showing an association between elevated plasma homocysteine and LMM in community-dwelling adults without known cardiovascular diseases. Furthermore, our study adjusted various confounding variables such as demographic, laboratory, metabolic, and health-behavioral factors, signifying more reliable results of the present study. Lastly, previous studies limited the age of the subjects to the old age. Although sarcopenia is generally described as an age-related loss of skeletal muscle, but several past studies on sarcopenic obesity reported that it is a multifactorial disease including physical inactivity that can occur in young and middle-aged populations [18,19]. Therefore, we included young and middle-aged populations in the study subjects to elucidate the relationship between skeletal muscle loss and homocysteine levels.

Mechanism by which hyperhomocysteinemia causes skeletal muscle loss

A few in vivo studies have reported the effect of hyperhomocysteinemia on skeletal muscle, in line with our study. One research was conducted using cystathionine beta-synthase deficient mice (CBS+/−), a model for hyperhomocysteine condition. Stellate cells of this model showed diminished in vitro proliferative capability and increased oxidative stress. In addition, enhanced p38-mitogen-activated protein kinase (MAPK) activation was observed, which undermined the repair process after injury. After treatment with a P38-MAPK inhibitor, tissue regeneration after injury was repaired to some degree [37]. Another study has investigated the mechanism by which hyperhomocysteinemia causes skeletal muscle weakness and fatigability. In that study, the large muscle fiber number of CBS+/− mice was decreased. In addition, reduced adenosine triphosphate (ATP) levels were observed, suggesting mitochondrial dysfunction [38]. Singh et al. [39] have investigated the effect of high methionine diet on skeletal muscle in CBS+/− mice and concluded that the hyperhomocysteinemia model is more susceptible to skeletal muscle injury and subsequent dysfunction. Therefore, in rodent models, the process by which hyperhomocysteinemia leads to skeletal muscle dysfunction has been partially identified. Likewise, in the present study, in asymptomatic adults with hyperhomocysteinemia, the status of skeletal muscle mass could have a downward slope, which may predispose to loss of muscle strength and function.

Subgroup analysis

We performed a subgroup analysis by relevant factors affecting the association between hyperhomocysteinemia and LMM. There were stronger associations between hyperhomocysteinemia and LMM in the old-aged, females, current smokers, heavy drinkers, those with low physical activity, and those with HbA1c ≥6.5%. The reason for a higher association in the female group than that in the male group is unclear. However, sex-specific hormones such as estrogen and testosterone might play critical roles [14]. Estrogen and testosterone are known to be inversely and positively correlated with homocysteine concentrations, respectively [40], which could differently affect skeletal musculature by gender. In a Taiwan elderly study from a cross-sectional analysis of I-Lan Longitudinal Aging Study (ILAS), stronger associations between high levels of homocysteine and sarcopenia were shown in younger subjects, women, and non-smokers, respectively [15]. The results were in line with our study that women had a higher association between homocysteine and LMM. However, the conflicting results were shown in subgroup analysis of age and smoking status. In the ILAS study [15], the study was conducted in only elderly individuals, in which young and middle aged subjects were not included. However, in our study, participants were of all ages including young and middle-aged adults. Furthermore, there was a substantial difference in the sample size (n=64 vs. n=114,583). Therefore, it is difficult to infer that the association of homocysteine with sarcopenia is stronger in the younger and non-smoking group from the past study. A possible pathomechanism for a higher OR in the elderly is that homocysteine metabolism is impaired with aging, which frequently occur hyperhomocysteinemia in elderly population [41]. Moreover, a high homocysteine level can lead to more cellular structural and functional impairments such as deterioration in muscle function and strength [3739,41]. Therefore, older-aged subjects under the condition of elevated homocysteine may accelerate loss of skeletal muscle. Smoking and alcohol are known to be associated with increased plasma homocysteine [42,43]. Furthermore, smoking and chronic alcohol drinking can affect the balance of anabolic and catabolic mechanisms which maintain skeletal muscle mass and integrity [44]. This pro-catabolic state caused by smoking and alcohol as toxic chemical components may consequently accelerate muscle loss with hyperhomocysteinemia [44]. The subjects with HbA1c ≥6.5% showed higher ORs probably because diabetes could increase homocysteine and complicate age-related effects on muscle [45]. Considering that previous studies have reported preventive and therapeutic effects of exercise on age-related sarcopenia [46], the subgroup with low physical activity might be more susceptible to skeletal muscle loss. It could explain the higher ORs in subjects with low physical activity compared to subjects with regular physical activity.

Limitation and clinical implication of this study

This study has a few limitations. First, there might be a selection bias due to male dominance (94.6%) in participants. To overcome this limitation, subgroup analysis was conducted based on sex and a clear association between hyperhomocysteinemia and LMM was confirmed in each subgroup. Second, the causal relationship cannot be evaluated due to its retrospective nature. Lastly, the diagnosis of sarcopenia is based on evaluation of strength and physical performance in addition to muscle mass [47]. Therefore, although the association between LMM and hyperhomocysteinemia was confirmed in our study, there is a limitation in that it cannot reveal the association of hyperhomocysteinemia with sarcopenia. However, as a two-center study in a large-scale sample, a distinct association between hyperhomocysteinemia and LMM was confirmed. This result is meaningful in that it secures the basis of further studies for assessing therapeutic benefits of lowering homocysteine. Additionally, although several biochemical markers of sarcopenia have been reported [48], definite biochemical markers of muscle loss have not been found yet. Biomarker is a term defined as ‘a characteristic that is objectively measured and evaluated as an indicator of normal biological processes, pathogenic processes, or pharmacologic responses to a therapeutic intervention’ [49]. Its importance is that it can support clinicians in diagnosis and facilitate tracking of changes over time. Furthermore, such biomarkers can increase clinician’s awareness of muscle loss [50].

Conclusions

Our study demonstrated an independent association of hyperhomocysteinemia with LMM in asymptomatic Korean community dwelling adults. This result suggests that increased plasma homocysteine level can serve as a predisposing factor of decline in muscle mass. Therefore, the risk of low muscle mass such as sarcopenia might be reduced through lowering homocysteine. Further studies are needed to assess therapeutic benefits of lowering homocysteine.

Supplementary Information

Supplemental Fig. S1
Selection of the study population.
enm-2021-1202-suppl.pdf

Notes

CONFLICTS OF INTEREST

No potential conflict of interest relevant to this article was reported.

AUTHOR CONTRIBUTIONS

Conception or design: J.H.C., K.J.Y., C.H.P. Acquisition, analysis, or interpretation of data: J.H.C., M.Y.L., Y.T.L. Drafting the work or revising: J.H.C., J.W.S., C.H.P. Final approval of the manuscript: K.J.Y., C.H.P.

ACKNOWLEDGMENTS

This work was supported by the National Research Foundation of Korea (NRF) grant funded by the Korea government (MSIT) (No.2020R1F1A107615712).

REFERENCES

1. Chen LK, Woo J, Assantachai P, Auyeung TW, Chou MY, Iijima K, et al. Asian Working Group for Sarcopenia: 2019 consensus date on sarcopenia diagnosis and treatment. J Am Med Dir Assoc. 2020; 21:300–7.
2. Woo N, Kim SH. Sarcopenia influences fall-related injuries in community-dwelling older adults. Geriatr Nurs. 2014; 35:279–82.
crossref
3. Yu R, Leung J, Woo J. Incremental predictive value of sarcopenia for incident fracture in an elderly Chinese cohort: results from the Osteoporotic Fractures in Men (MrOs) Study. J Am Med Dir Assoc. 2014; 15:551–8.
crossref
4. Szulc P, Munoz F, Marchand F, Chapurlat R, Delmas PD. Rapid loss of appendicular skeletal muscle mass is associated with higher all-cause mortality in older men: the prospective MINOS study. Am J Clin Nutr. 2010; 91:1227–36.
crossref
5. Srikanthan P, Horwich TB, Tseng CH. Relation of muscle mass and fat mass to cardiovascular disease mortality. Am J Cardiol. 2016; 117:1355–60.
crossref
6. Abe T, Iwata K, Yoshimura Y, Shinoda T, Inagaki Y, Ohya S, et al. Low muscle mass is associated with walking function in patients with acute ischemic stroke. J Stroke Cerebrovasc Dis. 2020; 29:105259.
crossref
7. Attaway AH, Welch N, Hatipoglu U, Zein JG, Dasarathy S. Muscle loss contributes to higher morbidity and mortality in COPD: an analysis of national trends. Respirology. 2021; 26:62–71.
crossref
8. Xiao J, Caan BJ, Cespedes Feliciano EM, Meyerhardt JA, Peng PD, Baracos VE, et al. Association of low muscle mass and low muscle radiodensity with morbidity and mortality for colon cancer surgery. JAMA Surg. 2020; 155:942–9.
crossref
9. Kim H, Hirano H, Edahiro A, Ohara Y, Watanabe Y, Kojima N, et al. Sarcopenia: prevalence and associated factors based on different suggested definitions in community-dwelling older adults. Geriatr Gerontol Int. 2016; 16(Suppl 1):110–22.
crossref
10. Tinelli C, Di Pino A, Ficulle E, Marcelli S, Feligioni M. Hyperhomocysteinemia as a risk factor and potential nutraceutical target for certain pathologies. Front Nutr. 2019; 6:49.
crossref
11. Kim J, Kim H, Roh H, Kwon Y. Causes of hyperhomocysteinemia and its pathological significance. Arch Pharm Res. 2018; 41:372–83.
crossref
12. van Schoor NM, Swart KM, Pluijm SM, Visser M, Simsek S, Smulders Y, et al. Cross-sectional and longitudinal association between homocysteine, vitamin B12 and physical performance in older persons. Eur J Clin Nutr. 2012; 66:174–81.
crossref
13. Wang CS, Wong TC, Duong TV, Su CT, Chen HH, Chen TH, et al. Hyperhomocysteinemia associated with low muscle mass, muscle function in elderly hemodialysis patients: an analysis of multiple dialysis centers. Biomed Res Int. 2019; 2019:9276097.
crossref
14. Vidoni ML, Pettee Gabriel K, Luo ST, Simonsick EM, Day RS. Relationship between homocysteine and muscle strength decline: the Baltimore Longitudinal Study of Aging. J Gerontol A Biol Sci Med Sci. 2018; 73:546–51.
crossref
15. Lee WJ, Peng LN, Loh CH, Chen LK. Sex-different associations between serum homocysteine, high-sensitivity C-reactive protein and sarcopenia: results from I-Lan Longitudinal Aging Study. Exp Gerontol. 2020; 132:110832.
crossref
16. Elshorbagy AK, Nurk E, Gjesdal CG, Tell GS, Ueland PM, Nygard O, et al. Homocysteine, cysteine, and body composition in the Hordaland Homocysteine Study: does cysteine link amino acid and lipid metabolism? Am J Clin Nutr. 2008; 88:738–46.
crossref
17. Atkins JL, Whincup PH, Morris RW, Wannamethee SG. Low muscle mass in older men: the role of lifestyle, diet and cardiovascular risk factors. J Nutr Health Aging. 2014; 18:26–33.
crossref
18. Walston JD. Sarcopenia in older adults. Curr Opin Rheumatol. 2012; 24:623–7.
crossref
19. Stevens J, Cai J, Pamuk ER, Williamson DF, Thun MJ, Wood JL. The effect of age on the association between body-mass index and mortality. N Engl J Med. 1998; 338:1–7.
crossref
20. Kurose S, Nishikawa S, Nagaoka T, Kusaka M, Kawamura J, Nishioka Y, et al. Prevalence and risk factors of sarcopenia in community-dwelling older adults visiting regional medical institutions from the Kadoma Sarcopenia Study. Sci Rep. 2020; 10:19129.
crossref
21. Cruz-Jentoft AJ, Sayer AA. Sarcopenia. Lancet. 2019; 393:2636–46.
crossref
22. Homocysteine Studies Collaboration. Homocysteine and risk of ischemic heart disease and stroke: a meta-analysis. JAMA. 2002; 288:2015–22.
23. Wang CY, Chen ZW, Zhang T, Liu J, Chen SH, Liu SY, et al. Elevated plasma homocysteine level is associated with ischemic stroke in Chinese hypertensive patients. Eur J Intern Med. 2014; 25:538–44.
crossref
24. Anjanappa M, Corden M, Green A, Roberts D, Hoskin P, McWilliam A, et al. Sarcopenia in cancer: risking more than muscle loss. Tech Innov Patient Support Radiat Oncol. 2020; 16:50–7.
crossref
25. Bozzetti F. Chemotherapy-induced sarcopenia. Curr Treat Options Oncol. 2020; 21:7.
crossref
26. Devaux M, Sassi F. Alcohol consumption and harmful drinking: trends and social disparities across OECD countries. OECD Health Work Pap. 2015. 79. Available from: https://doi.org/10.1787/5js1qwkz2p9s-en .
crossref
27. Park CH, Do JG, Lee YT, Yoon KJ. Sarcopenic obesity associated with high-sensitivity C-reactive protein in age and sex comparison: a two-center study in South Korea. BMJ Open. 2018; 8:e021232.
crossref
28. World Health Organization. WHO guidelines on physical activity and sedentary behaviour. Geneva: World Health Organization;2020.
29. Kang SS, Wong PW, Malinow MR. Hyperhomocyst(e)inemia as a risk factor for occlusive vascular disease. Annu Rev Nutr. 1992; 12:279–98.
crossref
30. Abai B. StatPearls. Treasure Island: StatPearls Publishing;2021. Chapter, Hyperhomocysteinemia [cited 2021 Dec 21]. Available from: https://www.ncbi.nlm.nih.gov/books/NBK554408 .
31. Hasan T, Arora R, Bansal AK, Bhattacharya R, Sharma GS, Singh LR. Disturbed homocysteine metabolism is associated with cancer. Exp Mol Med. 2019; 51:1–13.
crossref
32. Janssen I, Heymsfield SB, Ross R. Low relative skeletal muscle mass (sarcopenia) in older persons is associated with functional impairment and physical disability. J Am Geriatr Soc. 2002; 50:889–96.
crossref
33. Mijnarends DM, Schols JM, Meijers JM, Tan FE, Verlaan S, Luiking YC, et al. Instruments to assess sarcopenia and physical frailty in older people living in a community (care) setting: similarities and discrepancies. J Am Med Dir Assoc. 2015; 16:301–8.
crossref
34. Brustolin S, Giugliani R, Felix TM. Genetics of homocysteine metabolism and associated disorders. Braz J Med Biol Res. 2010; 43:1–7.
crossref
35. Majumder A, Behera J, Jeremic N, Tyagi SC. Hypermethylation: causes and consequences in skeletal muscle myopathy. J Cell Biochem. 2017; 118:2108–17.
crossref
36. Swart KM, Enneman AW, van Wijngaarden JP, van Dijk SC, Brouwer-Brolsma EM, Ham AC, et al. Homocysteine and the methylenetetrahydrofolate reductase 677C→T polymorphism in relation to muscle mass and strength, physical performance and postural sway. Eur J Clin Nutr. 2013; 67:743–8.
crossref
37. Veeranki S, Lominadze D, Tyagi SC. Hyperhomocysteinemia inhibits satellite cell regenerative capacity through p38 alpha/beta MAPK signaling. Am J Physiol Heart Circ Physiol. 2015; 309:H325–34.
crossref
38. Veeranki S, Winchester LJ, Tyagi SC. Hyperhomocysteinemia associated skeletal muscle weakness involves mitochondrial dysfunction and epigenetic modifications. Biochim Biophys Acta. 2015; 1852:732–41.
crossref
39. Singh M, George AK, Eyob W, Homme RP, Stansic D, Tyagi SC. High-methionine diet in skeletal muscle remodeling: epigenetic mechanism of homocysteine-mediated growth retardation. Can J Physiol Pharmacol. 2021; 99:56–63.
crossref
40. Dierkes J, Jeckel A, Ambrosch A, Westphal S, Luley C, Boeing H. Factors explaining the difference of total homocysteine between men and women in the European Investigation Into Cancer and Nutrition Potsdam study. Metabolism. 2001; 50:640–5.
crossref
41. Ostrakhovitch EA, Tabibzadeh S. Homocysteine and age-associated disorders. Ageing Res Rev. 2019; 49:144–64.
crossref
42. Sobczak A, Wardas W, Zielinska-Danch W, Pawlicki K. The influence of smoking on plasma homocysteine and cysteine levels in passive and active smokers. Clin Chem Lab Med. 2004; 42:408–14.
crossref
43. Gibson A, Woodside JV, Young IS, Sharpe PC, Mercer C, Patterson CC, et al. Alcohol increases homocysteine and reduces B vitamin concentration in healthy male volunteers: a randomized, crossover intervention study. QJM. 2008; 101:881–7.
crossref
44. Petersen AM, Magkos F, Atherton P, Selby A, Smith K, Rennie MJ, et al. Smoking impairs muscle protein synthesis and increases the expression of myostatin and MAFbx in muscle. Am J Physiol Endocrinol Metab. 2007; 293:E843–8.
crossref
45. Veeranki S, Tyagi SC. Defective homocysteine metabolism: potential implications for skeletal muscle malfunction. Int J Mol Sci. 2013; 14:15074–91.
crossref
46. Yoo SZ, No MH, Heo JW, Park DH, Kang JH, Kim SH, et al. Role of exercise in age-related sarcopenia. J Exerc Rehabil. 2018; 14:551–8.
crossref
47. Cruz-Jentoft AJ, Bahat G, Bauer J, Boirie Y, Bruyere O, Cederholm T, et al. Sarcopenia: revised European consensus on definition and diagnosis. Age Ageing. 2019; 48:16–31.
crossref
48. Cesari M, Fielding RA, Pahor M, Goodpaster B, Hellerstein M, van Kan GA, et al. Biomarkers of sarcopenia in clinical trials-recommendations from the International Working Group on Sarcopenia. J Cachexia Sarcopenia Muscle. 2012; 3:181–90.
crossref
49. Biomarkers Definitions Working Group. Biomarkers and surrogate endpoints: preferred definitions and conceptual framework. Clin Pharmacol Ther. 2001; 69:89–95.
50. Tosato M, Marzetti E, Cesari M, Savera G, Miller RR, Bernabei R, et al. Measurement of muscle mass in sarcopenia: from imaging to biochemical markers. Aging Clin Exp Res. 2017; 29:19–27.
crossref

Fig. 1
Comparison of adjusted mean of ln (homocysteine) between the group classified by skeletal muscle mass. Adjusted for age, sex, center, systolic blood pressure, laboratory factor (low-density lipoprotein cholesterol, glycosylated hemoglobin [%], C-reactive protein, creatinine), health behavior factors (smoking status, heavy drinking, regular physical activity). Ln, natural log transformed; LMM, low skeletal muscle mass. aP=0.009; bP<0.001.
enm-2021-1202f1.gif
enm-2021-1202f2.tif
Table 1
Baseline Characteristics of Study Subjects Classified by Skeletal Muscle Mass
Characteristic Total Normal Mildly LMM Severely LMM P value
No. of subjects 114,583 97,820 14,904 1,859
Age, yr 38.39±10.84 38.03±10.34 39.94±12.75 44.90±15.86 <0.001a
Male sex, % 94.6 94.3 96.1 97.9 <0.001b
Height, cm 172.63±7.06 173.17±7.03 169.79±6.34 166.87±6.28 <0.001a
Weight, kg 73.84±11.58 75.97±10.91 62.26±6.01 54.76±5.67 <0.001a
BMI, kg/m2 24.72±3.19 25.29±3.00 21.61±1.89 19.7±2.05 <0.001a
Waist circumference, cm 86.13±8.56 87.39±8.23 79.26±6.31 74.94±6.82 <0.0011
Appendicular skeletal muscle mass, kg 23.84±3.70 24.47±3.51 20.42±2.19 17.83±1.91 <0.001a
SMI, kg/m2 7.95±0.83 8.12±0.77 7.06±0.41 6.39±0.38 <0.001a
SBP, mm Hg 114.82±11.67 115.46±11.56 111.16±11.48 110.59±13.07 <0.001a
Screening center, Seoul, % 54.4 54.7 52.7 54.9 <0.001b
Current smoker, % 29.8 31.3 28.7 33.3 <0.001b
Heavy drinking, % 32.3 34.8 28.3 28.1 <0.001b
Regular physical activity, % 14.9 16.2 10.5 8.5 <0.001b
Hypertension, % 12.9 13.3 10.4 12.4 <0.001b
Diabetes mellitus, % 3.8 3.6 4.3 7.5 <0.001b
Chronic kidney disease, % 2.8 2.8 3.0 2.4 0.089b
Total cholesterol, mg/dL 197.56±35.50 198.11±35.46 194.8±35.52 190.62±35.62 <0.001a
LDL-C, mg/dL 129.65±32.76 130.38±32.64 125.98±33.04 120.49±33.47 <0.001a
HDL-C, mg/dL 54.12±13.79 53.4±13.52 58.05±14.38 60.52±16.07 <0.001a
Triglycerides, mg/dL 131.62±89.93 135.08±92.35 112.17±71.15 105.05±67.92 <0.001a
Fasting glucose, mg/dL 97.34±16.97 97.51±16.58 96.13±18.10 98.05±25.20 <0.001a
HbA1c, % 5.60±0.60 5.61±0.58 5.57±0.66 5.66±0.89 <0.001a
ALT, IU/L 30.90±25.70 31.91±26.70 25.2±17.87 23.46±16.44 <0.001a
Creatinine, mg/dL 0.94±0.19 0.95±0.19 0.92±0.16 0.9±0.33 <0.001a
CRP, mg/dL 0.06 (0.03–0.12) 0.06 (0.03–0.13) 0.05 (0.02–0.10) 0.05 (0.02–0.11) <0.001a

Values are expressed as mean±standard deviation or median (interquartile range). SMI (kg/m2)=appendicular skeletal muscle mass (kg)/height(m)2.

LMM, low muscle mass; BMI, body mass index; SMI, skeletal muscle mass index; SBP, systolic blood pressure; LDL-C, low-density lipoprotein cholesterol; HDL-C, high-density lipoprotein cholesterol; HbA1c, glycosylated hemoglobin; ALT, alanine aminotransferase; CRP, C-reactive protein.

P values for between group difference by

a one-way analysis of variance (ANOVA) in continuous variables or by

b chi-square test in categorical variables.

Table 2
Proportion of Hyperhomocysteinemia for the Subjects Classified by Skeletal Muscle Mass (n=114,583)
Variable Normal Mildly LMMa Severely LMMb,c P for trend
Classification according to homocysteine level
 Normal (<15 μmol/L), % 91.5 90.2 87.1 <0.001
 Hyperhomocysteinemia (≥15 μmol/L), % 8.5 9.8 12.9

LMM, low skeletal muscle mass.

a,b P<0.001 for vs. normal muscle mass in post hoc analysis;

c P<0.001 for vs. mildly LMM in post hoc analysis

Table 3
Multivariable Regression Analyses Showing Associations of Hyperhomocysteinemia with LMM
Variable OR (95% CI)

Mildly LMM Severely LMM
Crude
 Normal (<15 μmol/L) 1 (reference) 1 (reference)
 Hyperhomocysteinemia (≥15 μmol/L) 1.167 (1.101–1.238) 1.591 (1.387–1.825)

Model 1
 Normal (<15 μmol/L) 1 (reference) 1 (reference)
 Hyperhomocysteinemia (≥15 μmol/L) 1.135 (1.070–1.203) 1.441 (1.254–1.656)

Model 2
 Normal (<15 μmol/L) 1 (reference) 1 (reference)
 Hyperhomocysteinemia (≥15 μmol/L) 1.333 (1.255–1.416) 1.918 (1.664–2.211)

Model 3
 Normal (<15 μmol/L) 1 (reference) 1 (reference)
 Hyperhomocysteinemia (≥15 μmol/L) 1.305 (1.224–1.392) 1.958 (1.677–2.286)

ORs were calculated as the risks of having mildly low or severely low skeletal muscle mass according to the presence of hyperhomocysteinemia. Model 1: adjusted for age, sex, screening center; Model 2: adjusted for age, sex, screening center, systolic blood pressure (SBP), low-density lipoprotein cholesterol (LDL-C), glycosylated hemoglobin (HbA1c), C-reactive protein (CRP), creatinine; Model 3: adjusted for age, sex, screening center, SBP, LDL-C, HbA1c, CRP, creatinine, smoking status, heavy drinking, and regular physical activity.

LMM, low skeletal muscle mass; OR, odds ratio; CI, confidence interval.

Table 4
Multivariable Regression Analyses Showing the Association of Ln (Homocysteine) with LMM
Variable OR (95% CI)
Mildly LMM Severely LMM
Crude 1.115 (1.050–1.183) 1.629 (1.411–1.881)
Model 1 1.039 (0.977–1.105) 1.384 (1.187–1.614)
Model 2 1.367 (1.284–1.455) 2.131 (1.833–2.477)
Model 3 1.360 (1.273–1.453) 2.169 (1.843–2.554)

ORs were calculated as the risk of having mildly or severely LMM according to ln (homocysteine). Model 1: adjusted for age, sex, screening center; Model 2: adjusted for age, sex, screening center, systolic blood pressure (SBP), low-density lipoprotein cholesterol (LDL-C), glycosylated hemoglobin (HbA1c), C-reactive protein (CRP), creatinine; Model 3: adjusted for age, sex, screening center, SBP, LDL-C, HbA1c, CRP, creatinine, smoking status, heavy drinking, and regular physical activity.

Ln, natural log transformed; LMM, low skeletal muscle mass; OR, odds ratio; CI, confidence interval.

Table 5
Subgroup Analyses for Associations of Hyperhomocysteinemia (≥15 umol/L) with Low Skeletal Muscle Mass
Variable OR (95% CI) P for interaction

Mildly LMM Severely LMM
Age, yr <0.001
 <40 (n=80,297) 1.214 (1.124–1.312) 1.605 (1.301–1.981)
 40≤ age <60 (n=25,940) 1.281 (1.109–1.479) 1.898 (1.332–2.704)
 ≥60 (n=8,346) 1.657 (1.335–2.057) 2.544 (1.827–3.544)

Sex <0.001
 Female (n=6,210) 1.494 (0.664–3.359) 13.419 (3.654–49.276)
 Male (n=108,373) 1.306 (1.224–1.393) 1.933 (1.653–2.259)

Smoking <0.001
 Current smoker (n=34,170) 1.414 (1.273–1.572) 2.089 (1.642–2.658)
 Non- or ex-smoker (n=75,983) 1.245 (1.147–1.350) 1.834 (1.496–2.249)

Alcohol intake, g/day <0.001
 ≥20 (n=37,022) 1.436 (1.281–1.609) 2.351 (1.795–3.078)
 <20 (n=72,429) 1.248 (1.154–1.349) 1.772 (1.465–2.143)

Physical activity <0.001
 Regular physical activity (n=17,038) 1.451 (1.189–1.772) 1.343 (0.683–2.642)
 Low physical activity (n=94,152) 1.288 (1.204–1.379) 1.993 (1.699–2.337)

HbA1c, % <0.001
 ≥6.5 (n=4,745) 1.542 (1.100–2.162) 2.398 (1.341–4.288)
 <6.5 (n=109,838) 1.296 (1.214–1.384) 1.901 (1.617–2.235)

ORs were calculated as the risks of having mildly low or severely low skeletal muscle mass according to the presence of hyperhomocysteinemia in each subgroup. Adjusted for age, sex, center, systolic blood pressure, laboratory factors (low-density lipoprotein cholesterol, HbA1c, C-reactive protein, creatinine), health behavior factors (smoking status, heavy driking, regular physical activity).

OR, odds ratio; CI, confidence interval; LMM, low muscle mass; HbA1c, glycosylated hemoglobin.

TOOLS
Similar articles