Journal List > Endocrinol Metab > v.36(6) > 1516079144

Choi, Kim, Lee, Park, Pak, and Lee: Clinical Value of Serum Mitochondria-Inhibiting Substances in Assessing Renal Hazards: A Community-Based Prospective Study in Korea

Abstract

Background

Mitochondrial dysfunction is strongly associated with several kidney diseases. However, no studies have evaluated the potential renal hazards of serum mitochondria-inhibiting substance (MIS) and aryl hydrocarbon receptor ligand (AhRL) levels.

Methods

We used serum level of MIS and AhRL and clinical renal outcomes from 1,511 participants of a prospective community-based cohort in Ansung. MIS was evaluated based on intracellular adenosine triphosphate (MIS-ATP) or reactive oxygen species (MIS-ROS) generation measured using cell-based assays.

Results

During a mean 6.9-year follow-up, 84 participants (5.6%) developed a rapid decline in kidney function. In the lowest quartile group of MIS-ATP, patients were older and had metabolically deleterious parameters. In multivariate logistic regression analysis, higher MIS-ATP was associated with decreased odds for rapid decline: the odds ratio (OR) of 1% increase was 0.977 (95% confidence interval [CI], 0.957 to 0.998; P=0.031), while higher MIS-ROS was marginally associated with increased odds for rapid decline (OR, 1.014; 95% CI, 0.999 to 1.028; P=0.055). However, serum AhRL was not associated with the rapid decline in kidney function. In subgroup analysis, the renal hazard of MIS was particularly evident in people with hypertension and low baseline kidney function.

Conclusion

Serum MIS was independently associated with a rapid decline in kidney function, while serum AhRL was not. The clinical implication of renal hazard on serum MIS requires further evaluation in future studies.

INTRODUCTION

Mitochondria produces adenosine triphosphate (ATP) through oxidative phosphorylation and maintain cell energy homeostasis [1]. Mitochondrial dysfunction could result in increased reactive oxygen species (ROS), and high levels of ROS are harmful because they can damage the cell’s own molecules and trigger apoptosis [2]. Many chronic metabolic diseases have been suggested to be associated with mitochondrial dysfunction and are major risk factors for renal disease [35]. Given that the kidney, one of the highest-energy demanding organ, is rich in mitochondria [6], mitochondrial dysfunction has been suggested to be associated with kidney disease, such as inherited glomerulopathy, tubulopathy, and cystic renal diseases [7]. Experimental and human studies have consistently reported a potential association between mitochondrial dysfunction and chronic kidney disease (CKD) [713].
Mitochondrial function could be inhibited by various endogenous or exogenous substances [1416]. Aryl hydrocarbon receptor (AhR) is a multifunctioning nuclear receptor and has various exogenous ligands. By measuring the AhR response to a human blood sample, we could estimate a total of exogenous substances. Biological activity of an aryl hydrocarbon receptor ligand (AhRL) in a serum sample could be measured by a cell-based reporter assay, and it represented toxic equivalence (TEQ total) values of total dioxin-like polychlorinated biphenyls (PCBs) and dioxins [17]. Serum mitochondria-inhibiting substance (MIS) and ROS could be measured by intracellular ATP and ROS levels in cells treated by human sera, and we had reported the correlation between AhRL and serum MIS and their significant associations with development of diabetes and the progression of severity in diabetic CKD [1719]. If MIS or AhRL would damage mitochondria of kidney cells, persons with high level of MIS or AhRL might be expected to show rapid declines of kidney function with age.
This study aimed to identify the potential hazards of MIS and AhRL on the rapid decline in kidney function. We used clinical data and serum levels of MIS and AhRL, measured from a large community-based cohort study, the Korean Genome and Epidemiology Study (KoGES).

METHODS

Participants

The Ansung cohort of the KoGES was established to investigate the genetic and environmental etiology of common complex diseases in Koreans. Participants of the Ansung cohort were recruited in 2001 to 2002, and biennial examinations are ongoing, with the latest follow-up performed in 2015 to 2016. The KoGES data are open to the public and the details of the study design and procedures were described previously [20]. Sera collected for oral glucose tolerance tests for participants in 2008 were available; thus, the visit in 2008 was considered as the baseline in this study. Using serum samples collected in 2008, sera of 1,537 participants were used to measure MIS and AhRL levels. We excluded 26 people whose yearly estimated glomerular filtration rate (eGFR) change could not be calculated. Therefore, 1,511 participants were included in this analysis. This study was approved by the ethics committee of the Nowon Eulji Medical Center, Eulji University (IRB Number: 2019-06-014). Written informed consent was obtained from all participants.

Measurement of AhRL bioactivity, MIS-ATP, and MIS-ROS

Serum AhRL bioactivity was determined as described previously [17,21]. pGL4-DRE-luc (puromycin+)/pRL-mTK double-positive stable cells and heat-inactivated serum were utilized [17]. The AhRL assay was similar to the Chemical Activated Luciferase gene eXpression (CALUX) assay, except that it utilized different recombinant cell lines and an organic solvent extraction-free sample preparation method [22]. All cell-based assays were performed in duplicate on blinded samples. The AhR bioactivity of serum sample-treated cells was presented as fold-induction compared to the AhR bioactivity of the 10% charcoal-stripped sera (CSS)-treated control. AhRL was expressed as 2,3,7,8-tetrachlorodibenzodioxin equivalents (TCDDeq, pM), in which a 0.1-fold induction of AhR bioactivity was equivalent to 0.37 pM TCDDeq [17]. The intra- and inter-assay coefficients of variation for AhRL were less than 5.0% [18].
Levels of MIS in serum samples were evaluated by measuring intracellular ATP content (MIS-ATP) and ROS generation (MIS-ROS), as described previously [17,21]. pRL-mTK-transfected mouse Hepa1c1c7 cells (5×10⁴/well) in a 96-well plate were treated with 10 μL heat-inactivated serum samples for 48 hours. The intracellular ATP content was determined using a CellTiter-Glo luciferase kit (Promega, Madison, WI, USA) with the output normalized to Renilla luciferase activity (% control). The ROS level was determined using 5-(and-6)-chloromethy l–2′, 7′-dichlorodihydrofluorescein diacetate and acetyl ester (CM-H2DCFDA; Molecular Probes, Eugene, OR, USA). Both intracellular ATP and ROS levels were expressed as percentages of CSS-treated control (% control). The intra- and inter-assay coefficients of variation for these methods were less than 6.0% [18]. MIS-ATP ranged from 50.7% to 166.4% of control, while MIS-ROS ranged from 82.9% to 174.3%. Since intracellular ATP content decreases while ROS level increases in mitochondrial dysfunction, decreasing MIS-ATP and increasing MIS-ROS signified increased MIS exposure [1,6].

Renal outcome

The eGFR was calculated using the equation from the Chronic Kidney Disease Epidemiology Collaboration for serum creatinine measurements [23]. At least two eGFR measurements were required to estimate the yearly eGFR change. For each individual, the yearly eGFR change (mL/min/1.73 m2/year) was determined with a regression coefficient using linear regression analysis. The mean±standard deviation follow-up period for eGFR measurements was 6.9±1.9 years. The definition of rapid decline in kidney function was a yearly eGFR change <−4 mL/min/1.73 m2/year [24].

Other measurements and definitions

Clinical data were downloaded from the KoGES database with permission. KoGES investigators measured anthropometric parameters and blood pressure (BP) by standard methods. Body mass index (BMI) was calculated as (weight in kg)/(height in m2). Waist circumference (WC, cm) was measured at the narrowest point between the lower rib and the iliac crest (measured to the nearest 0.1 cm), and the average of three repeated measurements was recorded. Blood and urine samples were obtained in the morning after at least 8 hours of overnight fasting. The specimens were sent to a central laboratory (Seoul Clinical Laboratories, Seoul, Korea). The fasting plasma concentrations of glucose, creatinine, and total cholesterol were measured using a Hitachi 747 chemistry analyzer (Hitachi Ltd., Tokyo, Japan) in a central laboratory. The hemoglobin A1c (HbA1c) level was determined using high-performance liquid chromatography (Variant II, BioRad Laboratories, Hercules, CA, USA). High-sensitivity C-reactive protein (hsCRP) level was measured using an immunoradiometric assay (ADVIA 1650, Bayer Diagnostics, Tarrytown, NY, USA), and plasma insulin concentration was measured using a radioimmunoassay (Linco kit, St. Charles, MO, USA) in a central laboratory. The homeostasis model assessment of insulin resistance (HOMA-IR) index was calculated following the original description [25]. Hypertension was defined as a systolic BP ≥140 mm Hg or diastolic BP ≥90 mm Hg or physician’s diagnosis of hypertension. Diabetes was defined as fasting plasma glucose level ≥126 mg/dL, HbA1c ≥6.5%, or physician’s diagnosis of diabetes. Proteinuria was measured by dipstick urinalysis (URISCAN Pro II, YD Diagnostics Corp., Yongin, Korea) and defined when the result of dipstick urinalysis test was ≥1+. Tobacco smoking and alcohol drinking were defined as current smokers and drinkers, respectively.

Statistical analysis

Continuous variables are expressed as mean±standard deviation and categorical variables are expressed as percentages. Differences were analyzed using one-way analysis of variance (ANOVA) for normally distributed continuous variables and chi-square test for categorical variables. P trends were analyzed by Wilcoxon rank-sum test. Logistic regression analyses were performed to calculate odds ratios (ORs) and 95% confidence intervals for rapid decline in kidney. Multivariate analyses were performed with adjustment for age, sex, behavioral statuses (smoking, drinking, and exercise), metabolic parameters (diabetes, hypertension, BMI, total cholesterol, and hsCRP) and renal parameters (estimated glomerular filtration and proteinuria) based on clinical and statistical relevance. Regarding to exercise, three groups were defined as the number of episodes of exercise per week (none, 1–3 times, 4–7 times a week). P values <0.05 were considered statistically significant. All analyses were performed using Stata Statistical Software Release 16 (StataCorp., College Station, TX, USA).

RESULTS

Baseline characteristic

Of 1,511 participants, the mean age was 60.5 years and 44.1% were men. The prevalence of hypertension and diabetes were 21.3% and 16.7%, respectively. The mean baseline eGFR was 80.3 mL/min/1.73 m2, and 5.1% of participants had eGFR <60 mL/min/1.73 m2. The prevalence of proteinuria was 1.3%. The median AhRL, MIS-ATP, and MIS-ROS were 2.3 pM TCDDeq, 89.0% of control, and 114.0% of control, respectively. During the mean 6.9-year follow-up, the mean yearly eGFR change was −1.6 mL/min/1.73 m2/year, and 84 participants (5.6%) experienced a rapid decline in kidney function. The baseline characteristics of the study population according to the MIS-ATP quartile are depicted in Table 1. In the lowest quartile group of MIS-ATP, patients were older and had more deleterious metabolic parameters, such as high BP, high level of fasting glucose/HbA1c and fasting insulin, high BMI and large WC, and high level of HOMA-IR and hsCRP (Table 1). In contrast, eGFR was higher in those with higher MIS-ATP levels. Persons with lower MIS-ATP levels showed higher levels of AhRL and MIS-ROS.

Associations between yearly eGFR changes and MIS-ATP, AhRL, and MIS-ROS

Yearly changes of eGFR showed positive correlation with MIS-ATP level, while AhRL and MIS-ROS levels were inversely correlated with yearly eGFR changes (Table 2). Multivariate analyses with adjustment for age, sex, and metabolic parameters, also showed significant correlation between MIS-ATP and yearly change of eGFR (Model 2). However, multivariate analyses with additional adjustment for baseline eGFR and the presence of proteinuria did not show significant correlations between the yearly change of eGFR and MIS-ATP (Model 3). MIS-ROS showed inversed correlation with MIS-ATP, in model 1 (univariate) and model 2 (adjustment for age, sex, and metabolic parameters). The correlation between AhRL level and the yearly change of eGFR was significant only in a univariate analysis, whereas it was not significant in multivariate analyses.
MIS-ATP was associated with decreasing risk of rapidly declining eGFR, defined of decreasing of eGFR more than 4 mL/min/1.73 m2/year (Table 3). Multivariate analyses with adjustments for anthropometric or metabolic parameters also showed significant beneficial effect for risk of rapid declining eGFR. In contrast, MIS-ROS showed significant risk effect, and multivariate analyses also showed significant results. AhRL showed an increasing risk effect for rapidly decreasing eGFR in univariate analysis and multivariate analysis with age and sex as covariates, but there were no significant effect in multivariate analyses with covariates, including metabolic or renal parameters.

Subgroup analyses for risk of rapidly declining eGFR

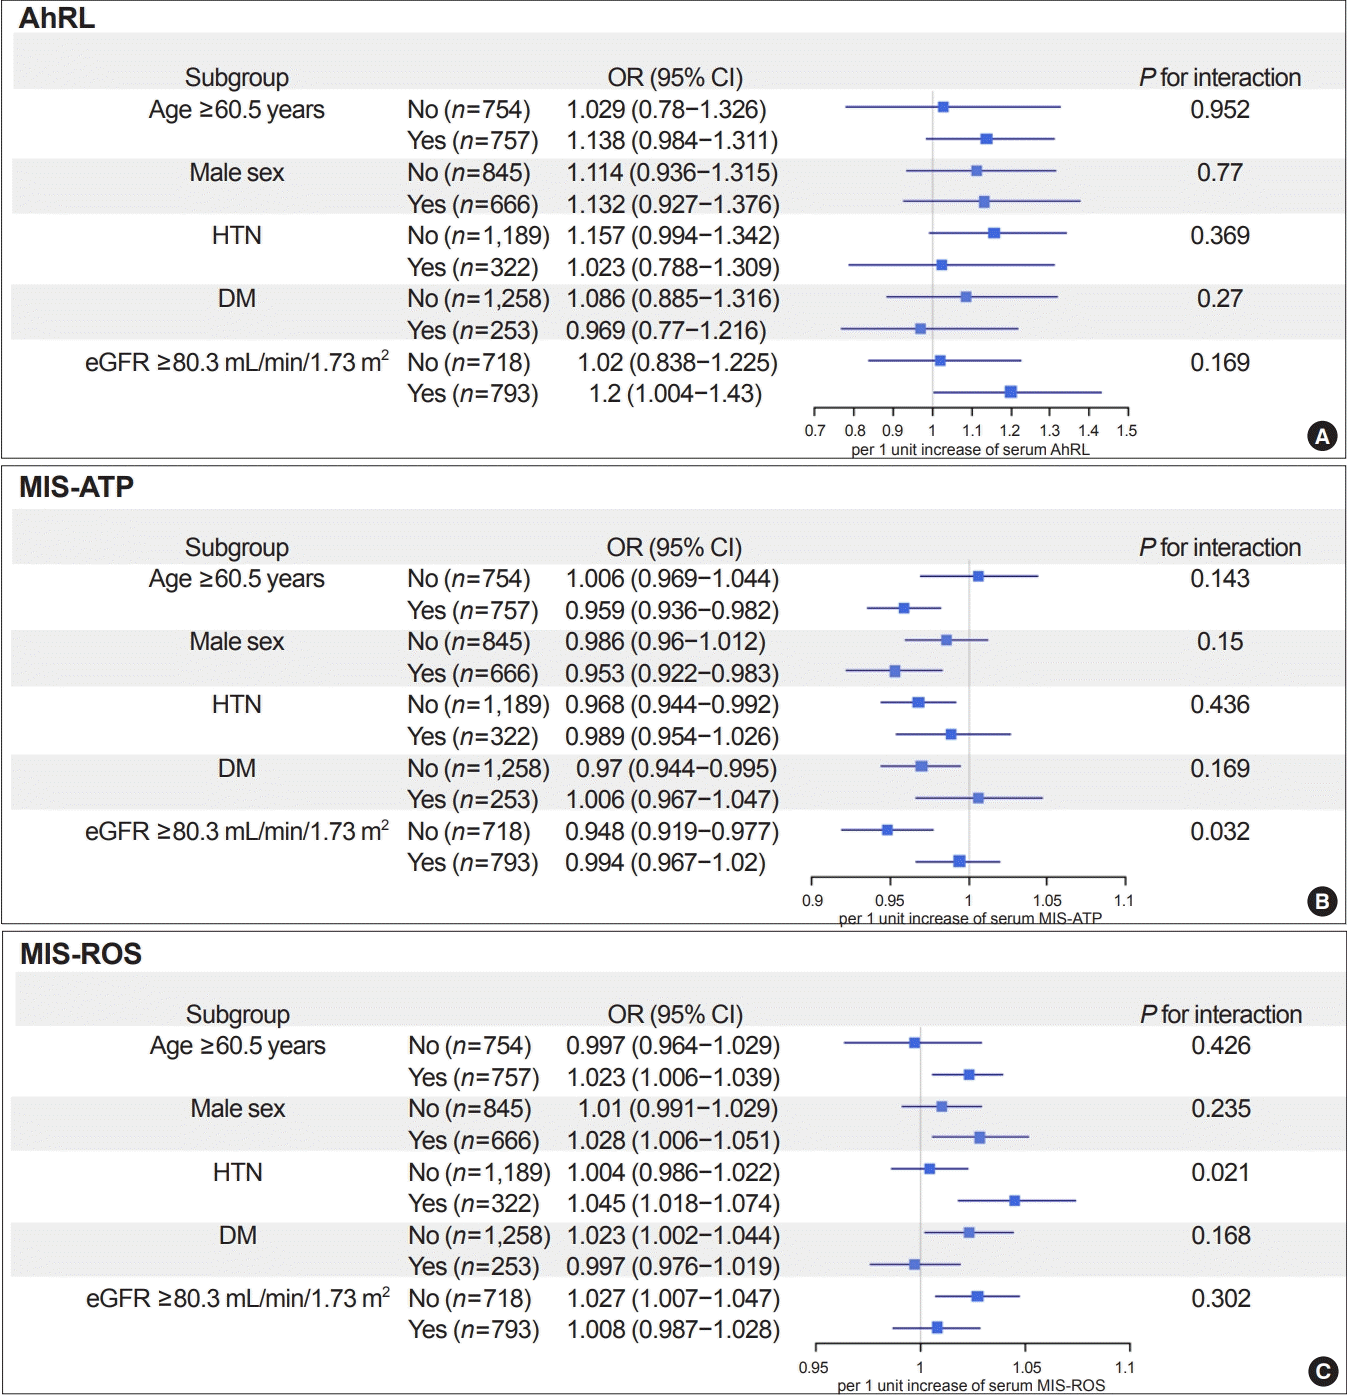
Fig. 1 shows risk of MIS-ATP, AhRL and MIS-ROS in each subgroup divided by age, sex, the presence of hypertension and diabetes, and baseline eGFR. Higher MIS-ATP showed significant beneficial effect for risk of rapidly declining eGFR in subgroups of older age, male sex, the absence of hypertension and diabetes, and lower baseline eGFR <80.3 mL/min/1.73 m2. Among the factors, lower eGFR had significant interaction term with MIS-ATP for rapid eGFR decline (P for interaction = 0.032). The risk effect of MIS-ROS for rapid eGFR decline was significant in the subgroups of old age, male sex, the presence of hypertension and the absence of diabetes, and lower baseline eGFR. Among them, hypertension showed significant interaction term with MIS-ROS (P for interaction =0.021). The risk of AhRL on rapid eGFR decline were not different between subgroups.

DISCUSSION

Mitochondrial dysfunction has been reported to be associated with various metabolic diseases, including metabolic syndrome, diabetes, and obesity [35], as well as other clinical conditions such as vascular thrombosis, immune homeostasis, and aging [2628]. Because the kidneys require large amounts of energy to maintain good tubular function and have abundant mitochondrial content and oxygen consumption [6], mitochondrial dysfunction could be associated with increases the risk of CKD [713]. In this regard, substances inhibiting mitochondrial function could be good candidates as a risk predictor for future renal dysfunction [1416].
This study evaluated serum levels of MIS-ATP and MIS-ROS after treatment with participant sera. Our study showed that MIS-ATP was positively associated with eGFR, while increased MIS-ROS was inversely associated with eGFR. Each 1% control increase in MIS-ATP was associated with 4.3% decreased odds for the occurrence of rapid decline in kidney function, while each 1% control increased MIS-ROS was associated with 2.7% increased odds. Stanifer et al. [29] also reported that perfluorinated chemicals, endocrine-disrupting chemicals (EDCs) with MIS activity, were associated with lower kidney function by causing tubular toxicity after reviewing 21 epidemiologic studies, 13 pharmacokinetic studies, and 40 toxicology studies. In this study, the hazardous effect of MIS was particularly more evident in groups with low kidney function at baseline and with hypertension, both of which were well-known risk factors of CKD progression [30]. Low kidney function and hypertension may simply reflect previous mitochondrial dysfunction. However, it is also possible that low kidney function and hypertension have synergism with MIS for the subsequent renal damage. Future prospective studies need to be followed to confirm the potential synergism among MIS, hypertension, and low kidney function.
Several EDCs, including dioxins, dioxin-like PCBs, and many other chemical pollutants can inhibit the mitochondria via AhR, which is activated by multiple ligands [31]. Environmental contaminants such as EDCs are associated with adverse kidney function [32], and AhRL increased with the progression of severity in diabetic CKD patients [19]. In our study, serum AhRL was not associated with the rapid decline in kidney function, although AhRLs showed potential renal hazard in the subgroup of participants with high baseline eGFR. Because, in AhRL assay, AhR activity represents AhRL amount in sample regardless of whether mitochondria are stimulated or inhibited, high level AhRL might not represent high level of inhibiting substances, which could explain the insignificant association between serum AhRL and rapid decline in kidney function. In other hands, even the same AhR activating chemicals can trigger opposing immune responses. For instance, 6-formylindolo[3,2-b] carbazole activates an immune response, while dioxin suppresses immune response [27]. Our study suggested that kidney function might be affected by MIS, rather than AhR-binding substances.
Our study has several strengths. First, it was based on a prospective observational population study with large numbers of participants. In this study, sera from 89.5% of participants were available, thereby minimizing selection bias. Data on demographic factors and laboratory findings were also available, and all specimens were collected during fasting. Second, we measured serum levels of MIS and AhRL using standardized methods with minor modifications [17,21]. We only used duplicated results with good precision. Third, the follow-up duration was long, and it is sufficient to evaluate the incidence of rapid decline in kidney function. However, the study also has several limitations. First, although we used standardized methods, cell-based assays are labor-intense and their results may vary depending on the person tested. Therefore, reproducibility requires evaluation in future studies. Second, data on the specific chemical natures of the molecules affecting AhRLs and MISs were not available, which could be addressed partly by high-resolution gas chromatography coupled with mass spectroscopy. Third, the results from a single nation and single ethnic group limit their generalizability.
In conclusion, serum MIS was associated with the rapid decline in kidney function, especially in the subjects with low kidney function at baseline and with hypertension. Our study might suggest that MIS could be a clinically useful risk factor for rapid decline of kidney function.

ACKNOWLEDGMENTS

This research was supported by the Korean Health Technology R&D Project (HI14C2700) through the Korea Health Industry Development Institute (KHIDI), the Basic Science Research Program (2018R1A6A1A03025124) through the National Research Foundation of Korea (NRF) funded by the Korean government (to Youngmi Kim Pak) and the National Research Foundation of Korea (Grant No: 2019R1G1A1099753). The funding source had no role in the collection of data or in the decision to submit the manuscript for publication.

Notes

CONFLICTS OF INTEREST

No potential conflict of interest relevant to this article was reported.

AUTHOR CONTRIBUTIONS

Conception or design: J.T.K., H.K.L., S.W.L. Acquisition, analysis, or interpretation of data: H.S.C., J.T.K., H.K.L., W.H.P., Y.K.P., S.W.L. Drafting the work or revising: H.S.C., J.T.K., S.W.L. Final approval of the manuscript: J.T.K., H.K.L., S.W.L.

REFERENCES

1. Lee HK. Mitochondrial dysfunction and insulin resistance: the contribution of dioxin-like substances. Diabetes Metab J. 2011; 35:207–15.
crossref
2. Ray PD, Huang BW, Tsuji Y. Reactive oxygen species (ROS) homeostasis and redox regulation in cellular signaling. Cell Signal. 2012; 24:981–90.
crossref
3. Lee HK, Cho YM, Kwak SH, Lim S, Park KS, Shim EB. Mitochondrial dysfunction and metabolic syndrome-looking for environmental factors. Biochim Biophys Acta. 2010; 1800:282–9.
crossref
4. Lowell BB, Shulman GI. Mitochondrial dysfunction and type 2 diabetes. Science. 2005; 307:384–7.
crossref
5. Bournat JC, Brown CW. Mitochondrial dysfunction in obesity. Curr Opin Endocrinol Diabetes Obes. 2010; 17:446–52.
crossref
6. Bhargava P, Schnellmann RG. Mitochondrial energetics in the kidney. Nat Rev Nephrol. 2017; 13:629–46.
crossref
7. Che R, Yuan Y, Huang S, Zhang A. Mitochondrial dysfunction in the pathophysiology of renal diseases. Am J Physiol Renal Physiol. 2014; 306:F367–78.
crossref
8. Granata S, Dalla Gassa A, Bellin G, Lupo A, Zaza G. Transcriptomics: a step behind the comprehension of the polygenic influence on oxidative stress, immune deregulation, and mitochondrial dysfunction in chronic kidney disease. Biomed Res Int. 2016; 2016:9290857.
crossref
9. Sharma K, Karl B, Mathew AV, Gangoiti JA, Wassel CL, Saito R, et al. Metabolomics reveals signature of mitochondrial dysfunction in diabetic kidney disease. J Am Soc Nephrol. 2013; 24:1901–12.
crossref
10. Gamboa JL, Billings FT 4th, Bojanowski MT, Gilliam LA, Yu C, Roshanravan B, et al. Mitochondrial dysfunction and oxidative stress in patients with chronic kidney disease. Physiol Rep. 2016; 4:e12780.
crossref
11. Granata S, Zaza G, Simone S, Villani G, Latorre D, Pontrelli P, et al. Mitochondrial dysregulation and oxidative stress in patients with chronic kidney disease. BMC Genomics. 2009; 10:388.
crossref
12. Zaza G, Granata S, Masola V, Rugiu C, Fantin F, Gesualdo L, et al. Downregulation of nuclear-encoded genes of oxidative metabolism in dialyzed chronic kidney disease patients. PLoS One. 2013; 8:e77847.
crossref
13. Eirin A, Saad A, Tang H, Herrmann SM, Woollard JR, Lerman A, et al. Urinary mitochondrial DNA copy number identifies chronic renal injury in hypertensive patients. Hypertension. 2016; 68:401–10.
crossref
14. Mutsaers HA, Wilmer MJ, Reijnders D, Jansen J, van den Broek PH, Forkink M, et al. Uremic toxins inhibit renal metabolic capacity through interference with glucuronidation and mitochondrial respiration. Biochim Biophys Acta. 2013; 1832:142–50.
crossref
15. Nadal A, Quesada I, Tuduri E, Nogueiras R, Alonso-Magdalena P. Endocrine-disrupting chemicals and the regulation of energy balance. Nat Rev Endocrinol. 2017; 13:536–46.
crossref
16. Kim JT, Lee HK. Metabolic syndrome and the environmental pollutants from mitochondrial perspectives. Rev Endocr Metab Disord. 2014; 15:253–62.
crossref
17. Park WH, Kang S, Lee HK, Salihovic S, Bavel BV, Lind PM, et al. Relationships between serum-induced AhR bioactivity or mitochondrial inhibition and circulating polychlorinated biphenyls (PCBs). Sci Rep. 2017; 7:9383.
crossref
18. Lee HK, Park WH, Kang YC, Kang S, Im S, Park S, et al. Serum biomarkers from cell-based assays for AhRL and MIS strongly predicted the future development of diabetes in a large community-based prospective study in Korea. Sci Rep. 2020; 10:6339.
crossref
19. Kim JT, Kim SS, Jun DW, Hwang YH, Park WH, Pak YK, et al. Serum arylhydrocarbon receptor transactivating activity is elevated in type 2 diabetic patients with diabetic nephropathy. J Diabetes Investig. 2013; 4:483–91.
crossref
20. Kim Y, Han BG. KoGES group. Cohort profile: the Korean Genome and Epidemiology Study (KoGES) Consortium. Int J Epidemiol. 2017; 46:e20.
crossref
21. Park WH, Jun DW, Kim JT, Jeong JH, Park H, Chang YS, et al. Novel cell-based assay reveals associations of circulating serum AhR-ligands with metabolic syndrome and mitochondrial dysfunction. Biofactors. 2013; 39:494–504.
crossref
22. Vondracek J, Pencikova K, Neca J, Ciganek M, Grycova A, Dvorak Z, et al. Assessment of the aryl hydrocarbon receptor-mediated activities of polycyclic aromatic hydrocarbons in a human cell-based reporter gene assay. Environ Pollut. 2017; 220(Pt A):307–16.
crossref
23. Levey AS, Stevens LA, Schmid CH, Zhang YL, Castro AF 3rd, Feldman HI, et al. A new equation to estimate glomerular filtration rate. Ann Intern Med. 2009; 150:604–12.
crossref
24. National Kidney Foundation. K/DOQI clinical practice guidelines for chronic kidney disease: evaluation, classification, and stratification. Am J Kidney Dis. 2002; 39(2 Suppl 1):S1–266.
25. Matthews DR, Hosker JP, Rudenski AS, Naylor BA, Treacher DF, Turner RC. Homeostasis model assessment: insulin resistance and beta-cell function from fasting plasma glucose and insulin concentrations in man. Diabetologia. 1985; 28:412–9.
crossref
26. Kolachalama VB, Shashar M, Alousi F, Shivanna S, Rijal K, Belghasem ME, et al. Uremic solute-aryl hydrocarbon receptor-tissue factor axis associates with thrombosis after vascular injury in humans. J Am Soc Nephrol. 2018; 29:1063–72.
crossref
27. Shinde R, McGaha TL. The aryl hydrocarbon receptor: connecting immunity to the microenvironment. Trends Immunol. 2018; 39:1005–20.
crossref
28. Brinkmann V, Ale-Agha N, Haendeler J, Ventura N. The aryl hydrocarbon receptor (AhR) in the aging process: another puzzling role for this highly conserved transcription factor. Front Physiol. 2020; 10:1561.
crossref
29. Stanifer JW, Stapleton HM, Souma T, Wittmer A, Zhao X, Boulware LE. Perfluorinated chemicals as emerging environmental threats to kidney health: a scoping review. Clin J Am Soc Nephrol. 2018; 13:1479–92.
30. Kidney Disease: Improving Global Outcomes (KDIGO) CKD Work Group. KDIGO 2012 clinical practice guideline for the evaluation and management of chronic kidney disease. Kidney Int Suppl. 2013; 3:1–150.
31. Avilla MN, Malecki KM, Hahn ME, Wilson RH, Bradfield CA. The Ah receptor: adaptive metabolism, ligand diversity, and the Xenokine Model. Chem Res Toxicol. 2020; 33:860–79.
crossref
32. Kataria A, Trasande L, Trachtman H. The effects of environmental chemicals on renal function. Nat Rev Nephrol. 2015; 11:610–25.
crossref

Fig. 1
Subgroup analysis for the relationship between (A) aryl hydrocarbon receptor ligand (AhRL), (B) mitochondria-inhibiting substance (MIS)-adenosine triphosphate (ATP), and (C) MIS-reactive oxygen species (ROS) with rapid estimated glomerular filtration rate (eGFR) decline. Odd ratios (ORs) and 95% confidence intervals (CIs) were calculated by logistic regression. Covariates were age, sex, smoking, drinking, and exercise status, fasting glucose, systolic and diastolic blood pressure, body mass index, waist circumference, total cholesterol, high-sensitivity C-reactive protein, estimated glomerular filtration rate and proteinuria. When covariates were chosen as subgroup, they were excluded from the model. HTN, hypertension; DM, diabetes mellitus.
enm-2021-1226f1.gif
Table 1
Baseline Characteristics According to the Quartile of MIS-ATP
Characteristic 1st quartile 2nd quartile 3rd quartile 4th quartile P value P trend
MIS-ATP 50.7%–81.0%
control
81.1%–89.0%
control
89.1%–97.0%
control
97.1%–166.4%
control
Cases 377 378 378 378
Age, yr 62.1±8.2 60.6±8.6 60.1±8.2 59.2±8.4 <0.001 <0.001
Male sex 168 (44.6) 160 (42.3) 170 (45.0) 168 (44.4) 0.885 0.841
Tobacco smoking 59 (15.7) 61 (16.2) 69 (18.3) 49 (13.0) 0.256 0.475
Alcohol drinking 153 (40.6) 160 (42.4) 167 (44.2) 169 (44.7) 0.657 0.216
Exercise 133 (35.3) 113 (30.0) 111 (29.4) 121 (32.0) 0.293 0.331
Hypertension 105 (27.9) 72 (19.1) 81 (21.4) 64 (16.9) 0.002 0.001
Diabetes 145 (38.5) 71 (18.8) 34 (9.0) 18 (4.8) <0.001 <0.001
Systolic BP, mm Hg 125.2±17.1 119.7±15.3 120.9±15.4 119.3±15.6 <0.001 <0.001
Diastolic BP, mm Hg 77.0±9.1 75.3±8.6 75.7±8.7 75.5±8.7 0.039 0.057
Body mass index, kg/m2 25.1±3.2 24.2±3.1 24.0±3.3 24.2±3.1 <0.001 <0.001
Waist circumference, cm 91.3±8.4 87.9±8.0 87.3±9.0 87.6±8.6 <0.001 <0.001
FPG, mmol/L 6.3±2.1 5.7±1.7 5.4±1.1 5.3±1.2 <0.001 <0.001
Fasting insulin, pmol/L 75.4±47.3 66.4±44.5 62.6±38.6 64.0±44.8 <0.001 <0.001
HOMA-IR 3.1±2.6 2.5±2.3 2.2±1.5 2.2±1.8 <0.001 <0.001
HbA1c, % 6.2±1.1 5.9±1.0 5.6±0.8 5.5±0.6 <0.001 <0.001
BUN, mmol/L 5.7±1.7 5.8±1.6 5.7±1.6 5.8±1.6 0.689 0.904
Creatinine, μmol/L 80.3±14.4 78.8±13.7 79.1±13.0 80.4±25.7 0.484 0.724
eGFR, mL/min/1.73 m2 78.8±12.9 80.6±12.5 80.9±11.9 81.0±11.9 0.051 0.036
Proteinuria 7 (1.9) 7 (1.9) 3 (0.8) 3 (0.8) 0.353 0.106
Total cholesterol, mmol/L 5.0±0.9 4.9±0.8 4.9±0.9 5.0±0.9 0.838 0.470
hsCRP, mg/L 8.0 (4.4–18.1) 7.6 (3.6–16.4) 6.3 (3.3–14.0) 6.6 (3.7–13.7) 0.007 0.004
AhRL (pM TCDDeq) 3.5±1.7 3.0±1.8 2.3±1.7 1.9±1.6 <0.001 <0.001
MIS-ATP, % control 73.7±5.9 85.1±2.3 92.9±2.4 105.2±8.7 <0.001 <0.001
MIS-ROS, % control 122.7±18.4 115.1±15.8 113.4±12.9 111.7±11.4 <0.001 <0.001

Values are expressed as mean±standard deviation, number (%), or median (interquartile range).

MIS, mitochondria-inhibiting substance; ATP, adenosine triphosphate; BP, blood pressure; FPG, fasting plasma glucose; HOMA-IR, homeostasis model assessment of insulin resistance; HbA1c, hemoglobin A1c; BUN, blood urea nitrogen; eGFR, estimated glomerular filtration rate; hsCRP, high-sensitivity C-reactive protein; AhRL, aryl hydrocarbon receptor ligand; TCDDeq, 2,3,7,8-tetrachlorodibenzodioxin equivalents; ROS, reactive oxygen species.

Table 2
Correlation between Yearly Change of eGFR and AhRL, MIS-ATP, and MIS-ROS
Univariate Model 1 Model 2 Model 3


Beta (95% CI) P value Beta (95% CI) P value Beta (95% CI) P value Beta (95% CI) P value
MIS-ATP, % control 0.013 (0.007 to 0.020) <0.001 0.011 (0.005 to 0.017) <0.001 0.007 (0.001 to 0.013) 0.041 0.006 (−0.003 to 0.012) 0.063

AhRL (pM TCDDeq) −0.058 (−0.102 to −0.014) 0.009 −0.037 (−0.081 to 0.007) 0.096 0.018 (−0.033 to 0.069) 0.497 0.008 (−0.041 to 0.058) 0.750

MIS-ROS, % control −0.009 (−0.014 to −0.004) <0.001 −0.009 (−0.014 to −0.004) <0.001 −0.005 (−0.011 to −0.003) 0.037 −0.004 (−0.010 to 0.001) 0.065

Beta and 95% CI were calculated by linear regression. In model 1, covariates were age and sex. In model 2, covariates were model 1+smoking, drinking, and exercise status, the presense of diabetes and hypertension, body mass index, total cholesterol, and high-sensitivity C-reactive protein. In model 3, model 2+baseline estimated glomerular filtration rate and proteinuria.

eGFR, estimated glomerular filtration rate; AhRL, aryl hydrocarbon receptor ligand; MIS, mitochondria-inhibiting substance; ATP, adenosine triphosphate; ROS, reactive oxygen species; CI, confidence interval; TCDDeq, 2,3,7,8-tetrachlorodibenzodioxin equivalents.

Table 3
Risk Effect of AhRL, MIS-ATP, and MIS-ROS, for the Rapid Decline of Estimated Glomerular Filtration Rate
Univariate Model 1 Model 2 Model 3


OR (95% CI) P value OR (95% CI) P value OR (95% CI) P value OR (95% CI) P value
MIS-ATP, % control 0.957 (0.939–0.975) <0.001 0.961 (0.943–0.980) <0.001 0.978 (0.958–0.998) 0.035 0.977 (0.957–0.998) 0.031

AhRL (pM TCDDeq) 1.237 (1.111–1.373) <0.001 1.193 (1.069–1.331) 0.002 1.017 (0.886–1.167) 0.129 1.034 (0.896–1.193) 0.646

MIS-ROS, % control 1.027 (1.014–1.040) <0.001 1.025 (1.012–1.038) <0.001 1.014 (1.000–1.028) 0.050 1.014 (0.999–1.028) 0.055

OR and 95% CI were calculated by logistic regression. In model 1, covariates were age and sex. In model 2, covariates were model 1+smoking, drinking, and exercise status, the presense of diabetes and hypertension, body mass index, total cholesterol, and high-sensitivity C-reactive protein. In model 3, model 2+baseline estimated glomerular filtration rate and proteinuria.

AhRL, aryl hydrocarbon receptor ligand; MIS, mitochondria-inhibiting substance; ATP, adenosine triphosphate; ROS, reactive oxygen species; OR, odds ratio; CI, confidence interval; TCDDeq, 2,3,7,8-tetrachlorodibenzodioxin equivalents.

TOOLS
Similar articles