INTRODUCTION
METHODS
Data source
Study subjects
Exposure
Outcome
Potential confounders
Statistical analysis
RESULTS
Baseline characteristics
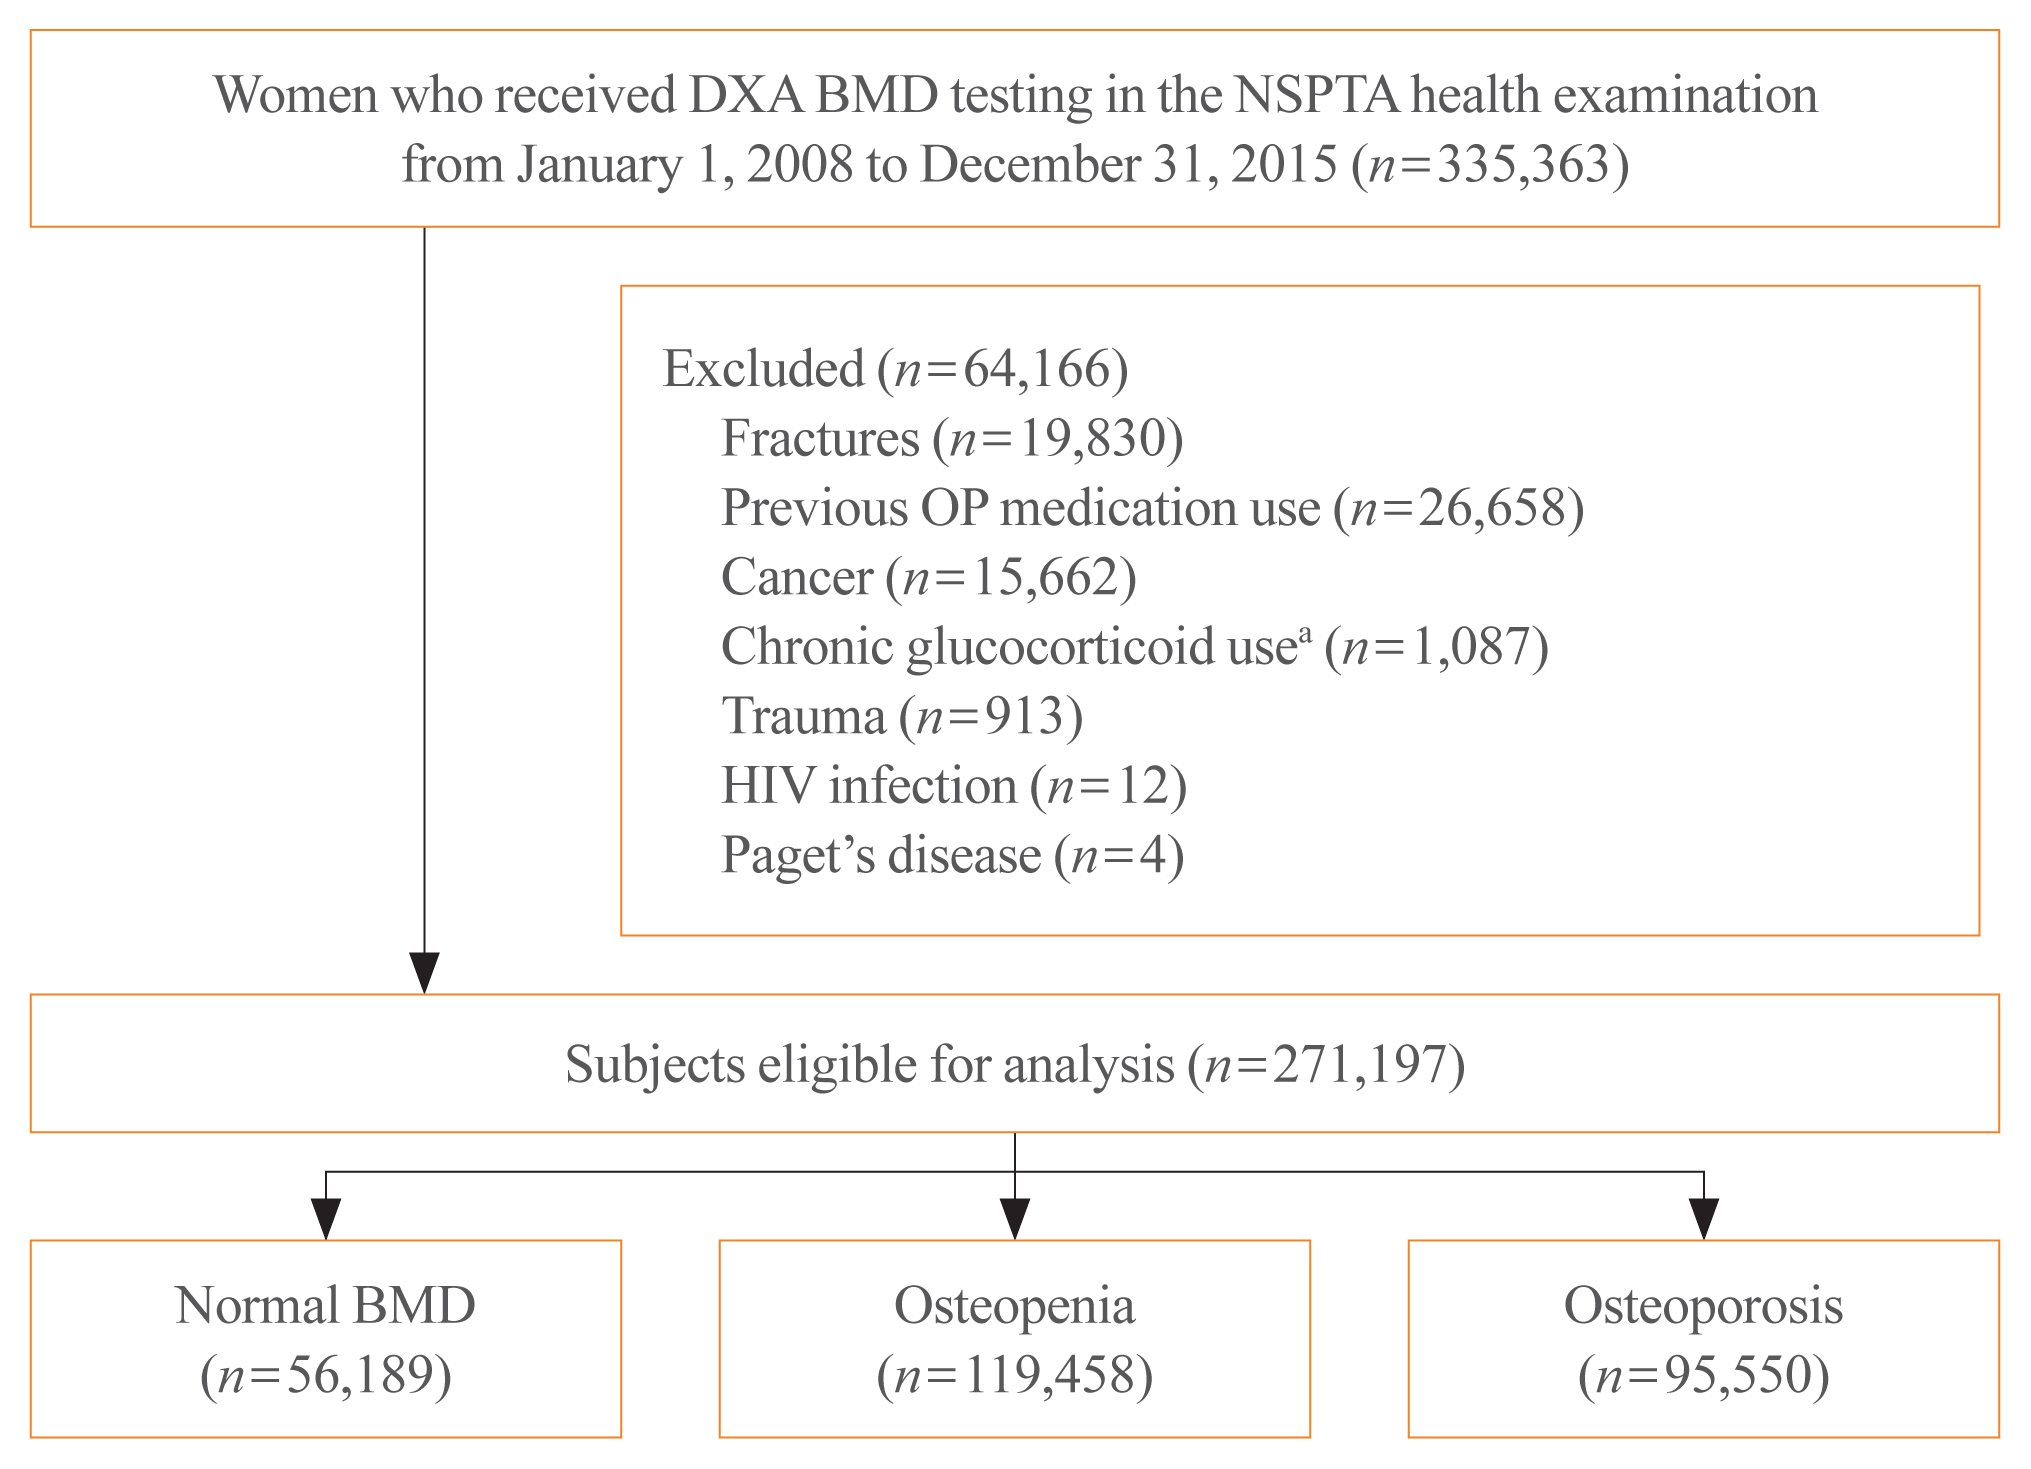
Fig. 1

Table 1
| Characteristica | Normal BMD (n=56,189) | Osteopenia (n=119,458) | Osteoporosis (n=95,550) |
|---|---|---|---|
| BMI | |||
| Underweight (<18.5 kg/m2) | 280 (0.5) | 1,149 (1.0) | 2,855 (3.0) |
| Normal (18.5–22.9 kg/m2) | 11,679 (20.8) | 32,876 (27.5) | 35,604 (37.3) |
| Overweight (23.0–24.9 kg/m2) | 14,389 (25.6) | 32,818 (27.5) | 25,639 (26.8) |
| Obese I (25.0–29.9 kg/m2) | 24,998 (44.5) | 46,326 (38.8) | 28,487 (29.8) |
| Obese II (≥30.0 kg/m2) | 4,833 (8.6) | 6,268 (5.3) | 2,942 (3.1) |
|
|
|||
| Smoking | |||
| Never | 49,625 (88.3) | 104,882 (87.8) | 82,902 (86.8) |
| Past but stopped | 616 (1.1) | 1,191 (1.0) | 802 (0.8) |
| Current | 847 (1.5) | 1,846 (1.6) | 1,929 (2.0) |
|
|
|||
| Alcohol consumption (≥1 time per week) | 4,477 (8.0) | 8,980 (7.5) | 6,421 (6.7) |
|
|
|||
| Baseline clinical condition | |||
| Hypothyroidism | 3,419 (6.1) | 6,380 (5.3) | 4,330 (4.5) |
| Hyperthyroidism | 1,140 (2.0) | 2,465 (2.1) | 1,786 (1.9) |
| Other thyroid disorder | 4,934 (8.8) | 9,808 (8.2) | 6,831 (7.2) |
| Asthma | 8,014 (14.3) | 16,647 (13.9) | 12,517 (13.1) |
| COPD | 10,430 (18.6) | 21,401 (17.9) | 15,300 (16.0) |
| Rheumatoid arthritis | 2,913 (5.2) | 5,709 (4.8) | 3,872 (4.1) |
| Hypertension | 30,919 (55.0) | 58,918 (49.3) | 40,708 (42.6) |
| Diabetes mellitus | 15,226 (27.1) | 27,597 (23.1) | 17,893 (18.7) |
| Dyslipidemia | 25,330 (45.1) | 49,222 (41.2) | 32,760 (34.3) |
| Stroke | 3,682 (6.55) | 7,624 (6.38) | 5,744 (6.0) |
| Chronic kidney disease | 348 (0.6) | 700 (0.6) | 513 (0.5) |
|
|
|||
| Previous medication use | |||
| Thyroid hormones | 2,295 (4.1) | 4,259 (3.6) | 2,759 (2.9) |
| Calcium and vitamin D | 4,227 (7.5) | 12,796 (10.7) | 9,914 (10.4) |
|
|
|||
| Subsequent BMD test within 2 years after cohort entry | |||
| Yes | 15,081 (26.8) | 37,104 (31.1) | 40,860 (42.8) |
Fracture risk in different BMD groups
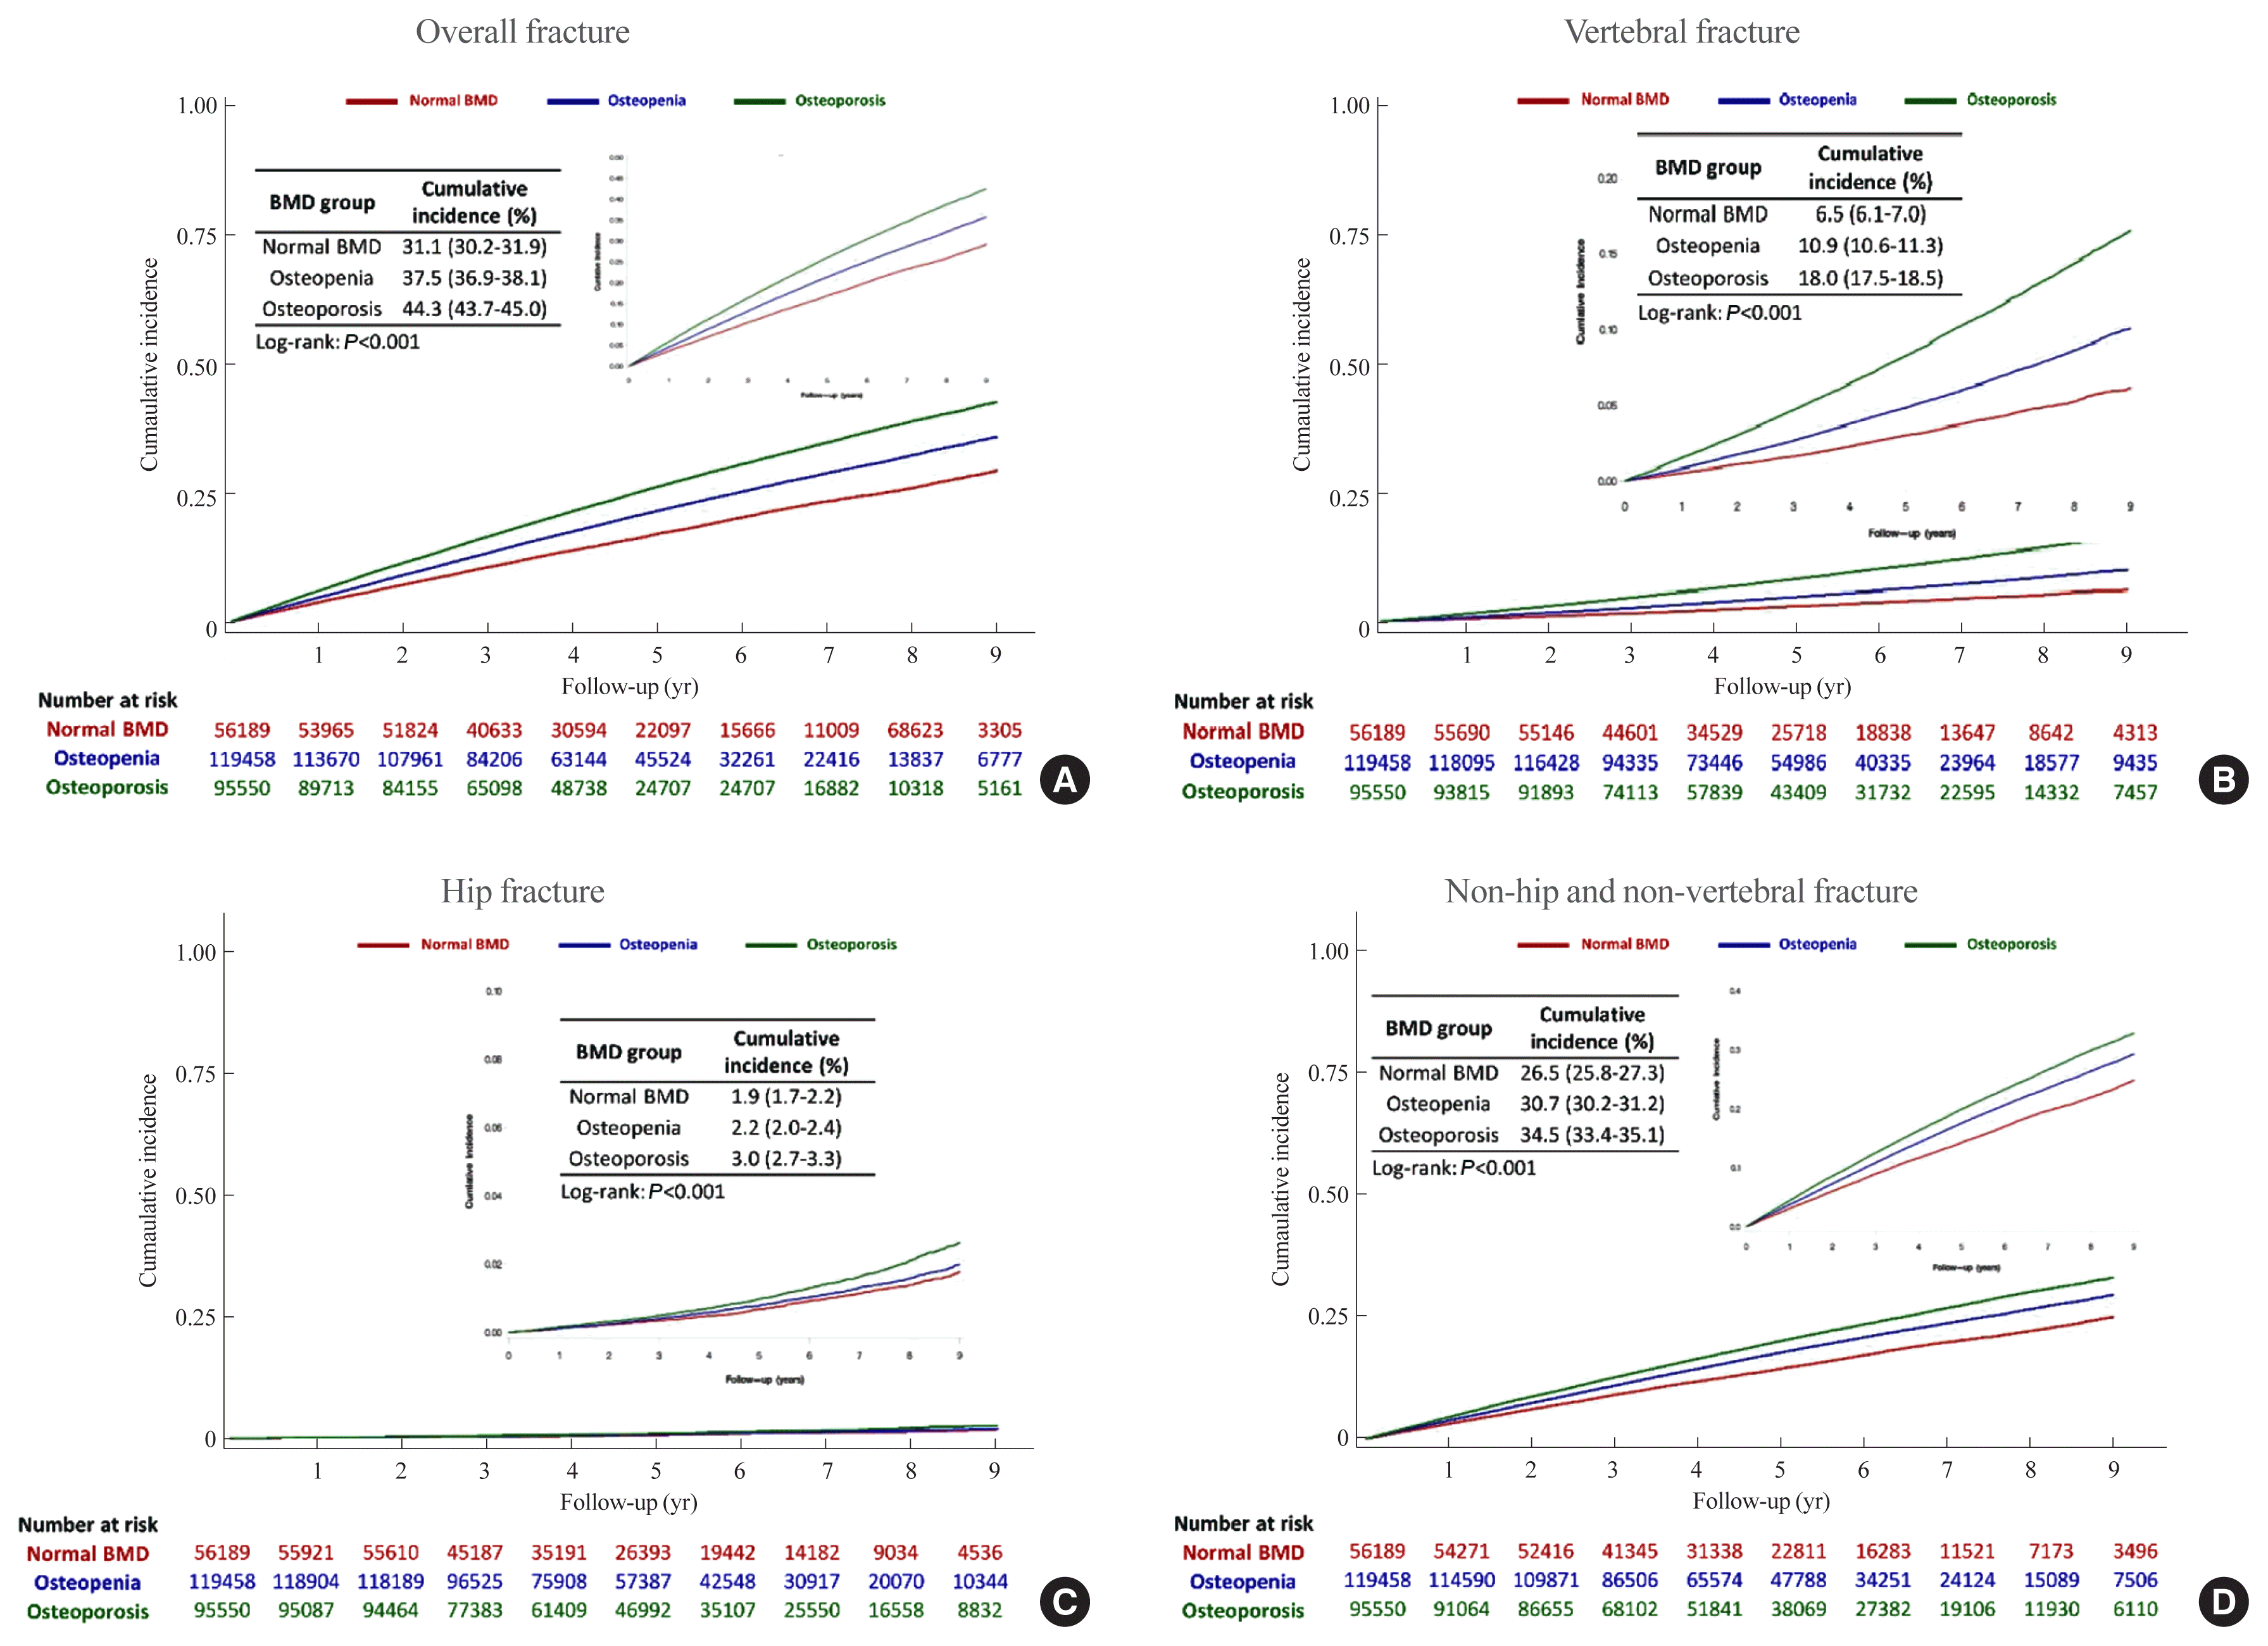
Fig. 2

Table 2
| Fracture site | No. of subjects | No. of events | PY at risk | Incidence rate per 100 PY (95% CI)a | Unadjusted HR (95% CI) | Adjusted HR (95% CI)b |
|---|---|---|---|---|---|---|
| Overall fracture | ||||||
| Normal BMD | 56,189 | 9,804 | 262,170 | 3.74 (3.67–3.81) | Ref (1.00) | Ref (1.00) |
| Osteopenia | 119,458 | 26,223 | 545,481 | 4.81 (4.75–4.86) | 1.29 (1.26–1.32) | 1.31 (1.28–1.34) |
| Osteoporosis | 95,550 | 25,644 | 424,087 | 6.05 (5.98–6.12) | 1.62 (1.58–1.66) | 1.68 (1.64–1.72) |
|
|
||||||
| Vertebral fracture | ||||||
| Normal BMD | 56,189 | 1,819 | 287,386 | 0.63 (0.6–0.66) | Ref (1.00) | Ref (1.00) |
| Osteopenia | 119,458 | 6,402 | 610,324 | 1.05 (1.02–1.07) | 1.66 (1.57–1.75) | 1.71 (1.62–1.80) |
| Osteoporosis | 95,550 | 8,746 | 481,328 | 1.82 (1.78–1.86) | 2.87 (2.73–3.02) | 3.09 (2.94–3.25) |
|
|
||||||
| Hip fracture | ||||||
| Normal BMD | 56,189 | 451 | 291,800 | 0.15 (0.14–0.17) | Ref (1.00) | Ref (1.00) |
| Osteopenia | 119,458 | 1,119 | 626,618 | 0.18 (0.17–0.19) | 1.15 (1.03–1.28) | 1.20 (1.07–1.34) |
| Osteoporosis | 95,550 | 1,158 | 505,568 | 0.23 (0.22–0.24) | 1.47 (1.32–1.64) | 1.59 (1.42–1.78) |
|
|
||||||
| NHNV fracture | ||||||
| Normal BMD | 56,189 | 8,323 | 266,931 | 3.12 (3.05–3.18) | Ref (1.00) | Ref (1.00) |
| Osteopenia | 119,458 | 21,532 | 561,106 | 3.84 (3.79–3.89) | 1.23 (1.20–1.26) | 1.24 (1.21–1.27) |
| Osteoporosis | 95,550 | 19,716 | 444,466 | 4.44 (4.38–4.5) | 1.42 (1.39–1.46) | 1.46 (1.42–1.50) |
PY, person-years; CI, confidence interval; HR, hazard ratio; BMD, bone mineral density; NHNV, non-hip and non-vertebral.
a Incidence rate per 100 person-years=(number of incident fracture events/person-years at risk)×100;
b Adjusted for income, smoking, alcohol consumption, body mass index, comorbidities (thyroid dysfunction, asthma, chronic obstructive pulmonary disease, rheumatoid arthritis, hypertension, myocardial infarction, heart failure, diabetes mellitus, dyslipidemia, stroke, chronic kidney disease, gastrointestinal disorders) and comedications (thyroid hormones, calcium and vitamin D, anticonvulsants, proton pump inhibitors, selective serotonin reuptake inhibitors, and benzodiazepines).
Table 3
| Stratification | No. of subjects | No. of events | PY at risk | 10-Year cumulative incidence, % | Incidence rate per 100 PY (95% CI)a | Crude HR (95% CI) | Adjusted HR (95% CI)b |
|---|---|---|---|---|---|---|---|
| With any osteoporosis treatment use during follow-upc | |||||||
| Normal | 8,067 | 1,359 | 46,574 | 26.5 | 2.92 (2.77–3.07) | Ref (1.00) | Ref (1.00) |
| Osteopenia | 33,657 | 6,191 | 181,420 | 30.3 | 3.41 (3.33–3.50) | 1.19 (1.12–1.26) | 1.21 (1.14–1.29) |
| Osteoporosis | 57,120 | 13,178 | 270,059 | 38.3 | 4.88 (4.80–4.96) | 1.75 (1.66–1.86) | 1.85 (1.74–1.95) |
|
|
|||||||
| Without any osteoporosis treatment use during follow-up | |||||||
| Normal | 48,122 | 8,445 | 215,596 | 29.4 | 3.92 (3.84–4.00) | Ref (1.00) | Ref (1.00) |
| Osteopenia | 85,801 | 20,032 | 364,061 | 37.8 | 5.50 (5.43–5.58) | 1.40 (1.37–1.44) | 1.43 (1.40–1.47) |
| Osteoporosis | 38,430 | 12,466 | 154,028 | 48.9 | 8.09 (7.96–8.23) | 2.06 (2.00–2.12) | 2.17 (2.11–2.23) |
a Incidence rate per 100 person-years=(number of incident fracture events/person-years at risk)×100;
b Adjusted for income, smoking, alcohol consumption, body mass index, comorbidities (thyroid dysfunction, asthma, chronic obstructive pulmonary disease, rheumatoid arthritis, hypertension, myocardial infarction, heart failure, diabetes mellitus, dyslipidemia, stroke, chronic kidney disease, gastrointestinal disorders) and comedications (thyroid hormones, calcium and vitamin D, anticonvulsants, proton pump inhibitors, selective serotonin reuptake inhibitors, and benzodiazepines);


 PDF
PDF Citation
 Print
Print


 XML Download