Abstract
Background
The prevalence of non-alcoholic fatty liver disease (NAFLD) has rapidly increased worldwide. The aim of this study was to investigate whether there is an independent relationship between regional fat distribution, especially leg fat mass, and the presence of NAFLD using nationally representative data in Korea.
Methods
This cross-sectional study analyzed data from 14,502 participants in the Korea National Health and Nutrition Examination Survey 2008 to 2011. Total fat mass, leg fat mass, and appendicular skeletal muscle mass were measured by dual-energy X-ray absorptiometry. Validated NAFLD prediction models and scoring systems for hepatic fibrosis were used.
Results
The leg fat to total fat (LF/TF) ratio showed a negative relationship with many factors, including body mass index, waist circumference, blood pressure, fasting blood glucose, and liver enzyme levels. When the LF/TF ratio and indices of hepatic steatosis were stratified by quartiles, the LF/TF ratio showed a negative correlation with the scoring systems that were used. The LF/TF ratio showed better accuracy in predicting NAFLD than total fat mass or leg fat mass alone. After adjusting for various traditional and lifestyle factors, a low LF/TF ratio remained a risk factor for NAFLD. Among NAFLD subjects, the LF/TF ratio showed a negative relationship with hepatic fibrosis.
The term non-alcoholic fatty liver disease (NAFLD) refers to a histological spectrum ranging from simple steatosis to severe steatohepatitis [1]. In recent years, the prevalence of NAFLD has rapidly increased worldwide as a result of the obesity epidemic [2], and its reported prevalence ranges from 25% to 45% [1]. It is estimated that non-alcoholic steatohepatitis, the more progressive form of NAFLD, will soon become the most common cause of advanced liver disease [3]. NAFLD is also associated with the risk of type 2 diabetes, dyslipidemia, and cardiovascular disease [4–6]. With its markedly increasing prevalence and importance as a possible cause of morbidity or mortality, NAFLD is a significant global public health issue.
Obesity is one of the most important risk factors for the development of NAFLD [7]. However, increasing evidence indicates that different regional fat depots have different effects on lipid or glucose metabolism and insulin resistance [8]. Some studies have demonstrated that lower-extremity fat mass is associated with insulin resistance, dyslipidemia, glucose intolerance, and the risk of cardiometabolic disease [7–9]. However, there are limited data regarding the association between regional fat distribution and NAFLD. Studies have reported inconsistent results regarding the favorable effects of leg fat according to sex, body mass index (BMI), and menopausal status [10,11].
Histologically, fatty liver is defined as the accumulation of excess fat corresponding to >5% of the liver weight. Liver biopsy remains the best method for diagnosing and staging NAFLD severity. However, liver biopsy is very invasive and has the potential for severe complications, as well as being susceptible to sampling error [12]. Various radiological modalities can be applied for the assessment of fatty liver disease. However, there is currently no single non-invasive tool used to assess NAFLD [13]. Thus, numerous non-invasive scoring models using easily available clinical parameters have been developed and validated to diagnose and quantify hepatic fat accumulation [14–16]. Similarly, some predictive models for advanced fibrosis have been developed and used [17–19].
Therefore, the aim of this study was to investigate whether there is an independent relationship between regional fat distribution, especially leg fat mass, and the presence of NAFLD in the general population. Furthermore, we evaluated the association between leg fat mass and advanced hepatic fibrosis as an index of severity in individuals with NAFLD. We applied various non-invasive scoring systems to define NAFLD and advanced hepatic fibrosis using nationally representative data in Korea.
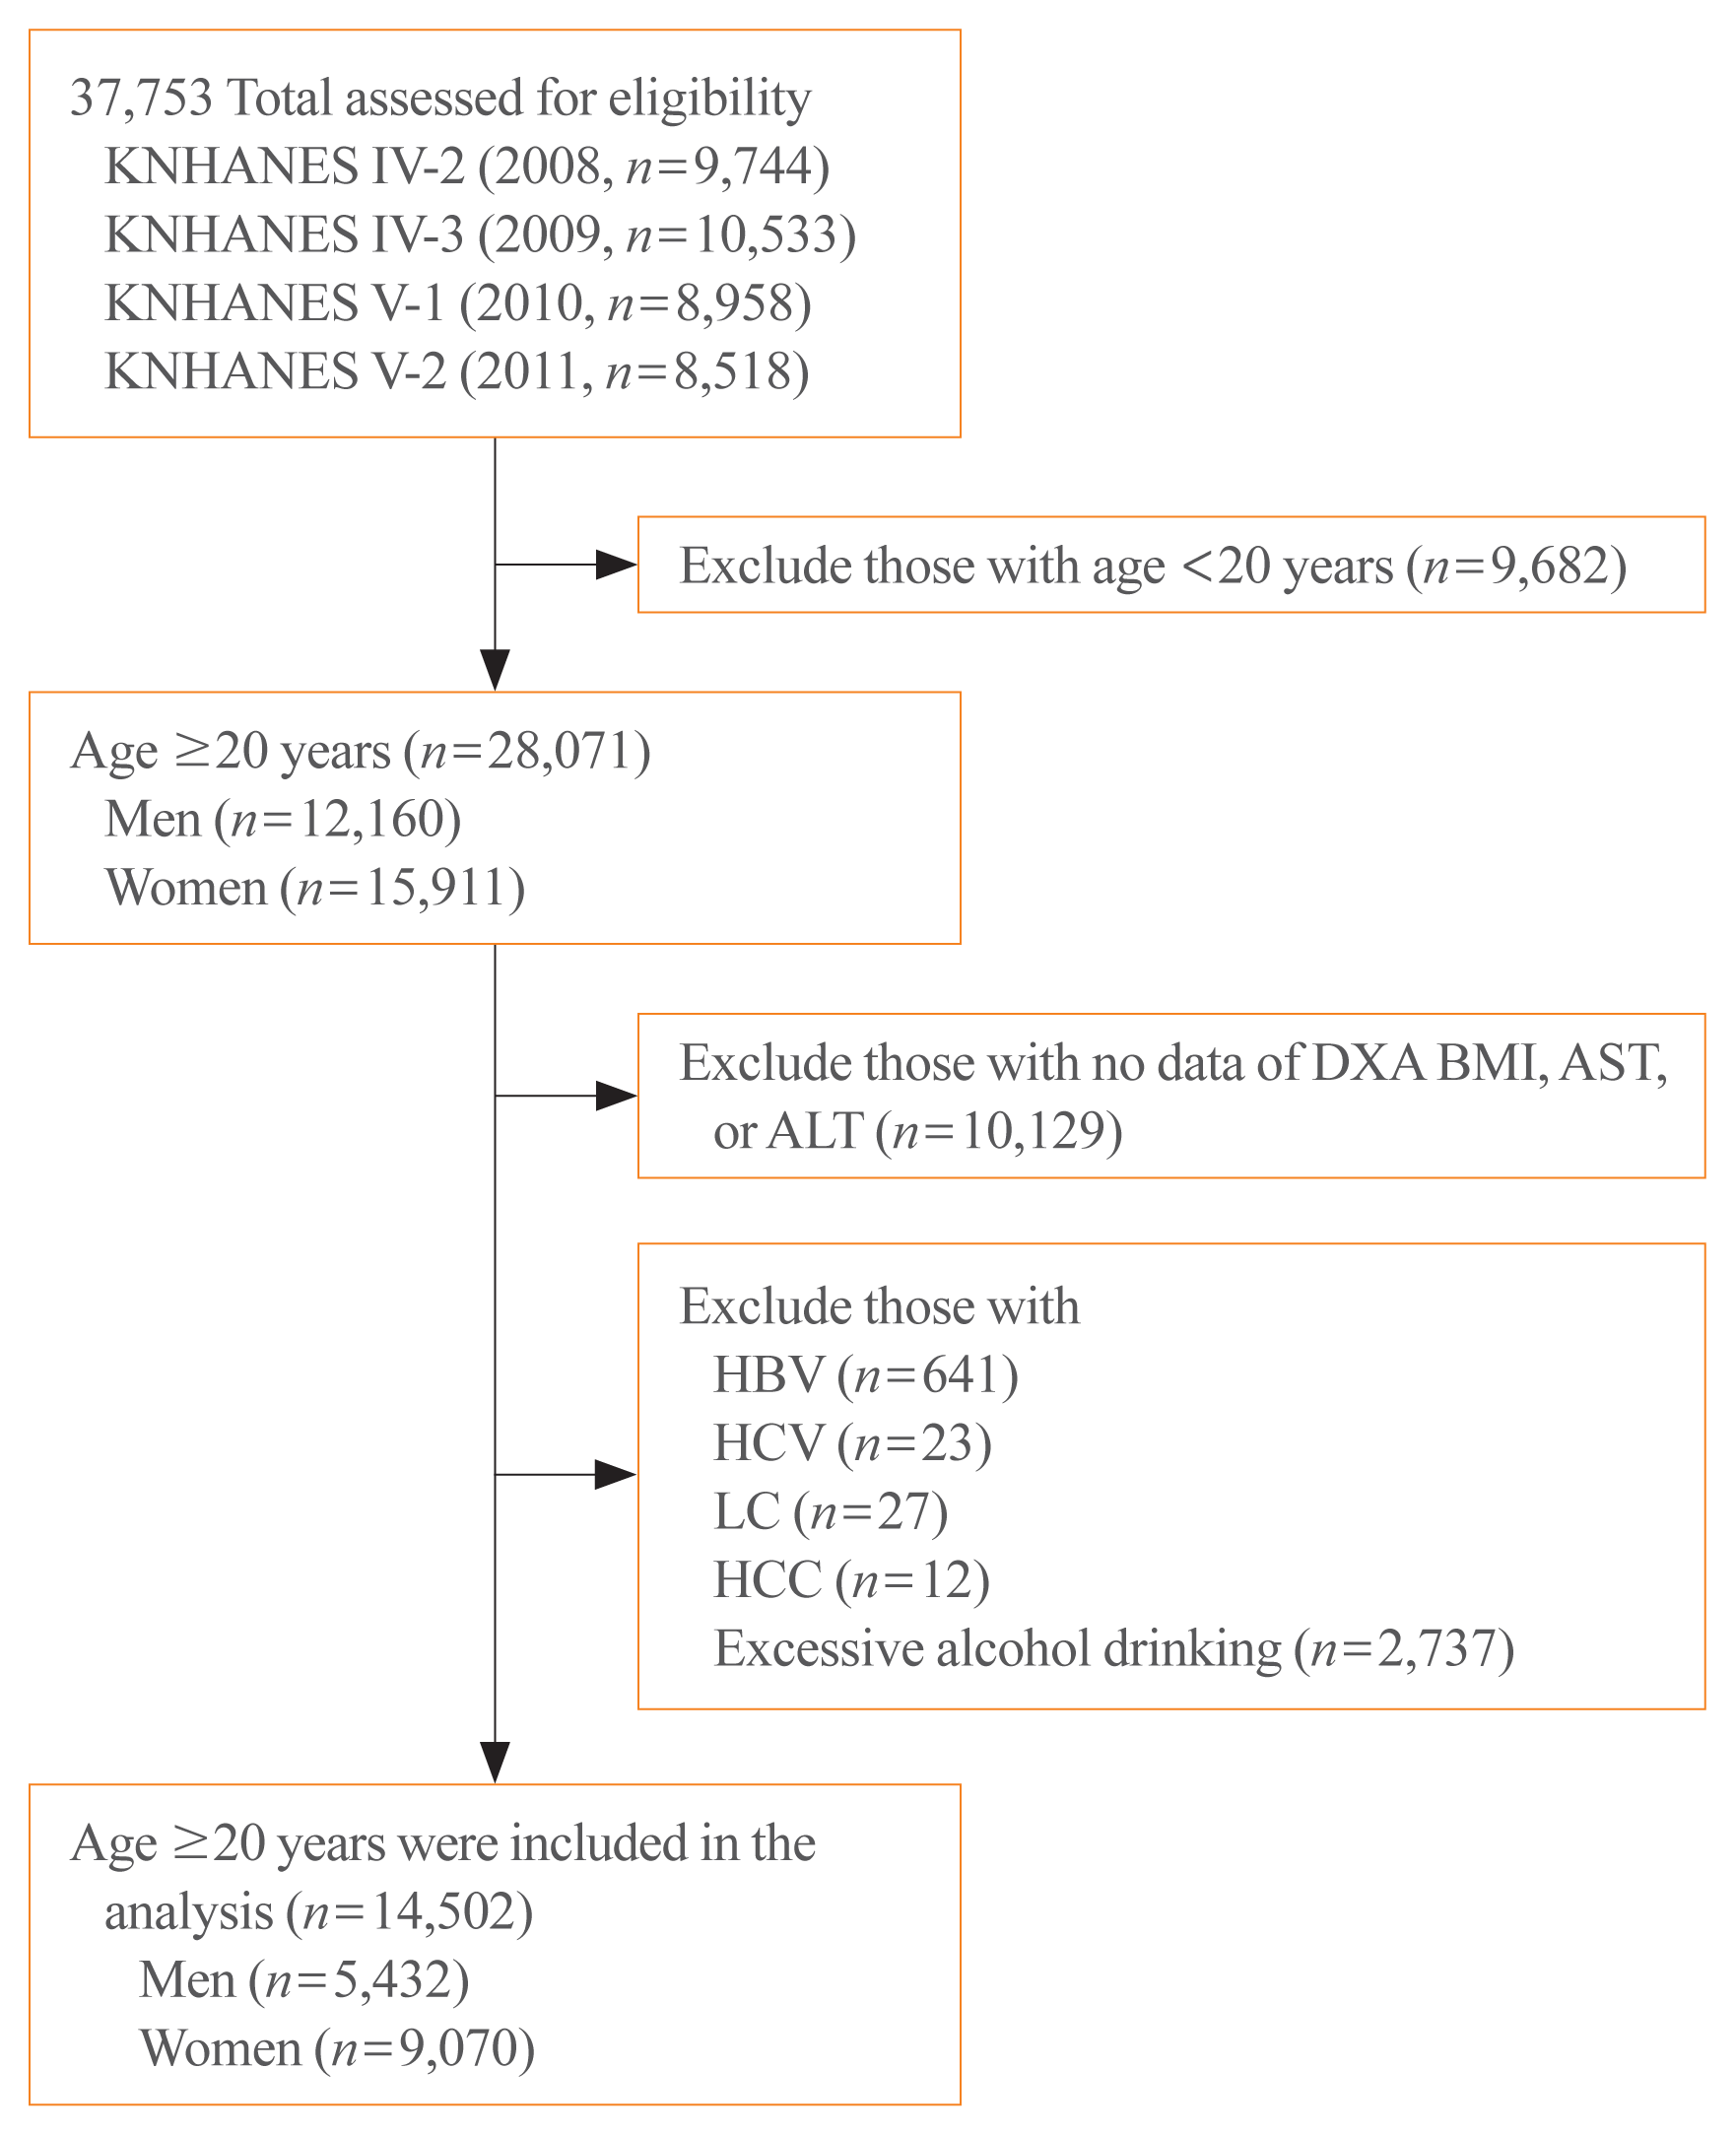
The Korea National Health and Nutrition Examination Survey (KNHANES) is a nationwide, population-based, cross-sectional health examination, and survey regularly conducted by the Division of Chronic Disease Surveillance of the Korea Disease Control and Prevention Agency in the Ministry of Health and Welfare to monitor the general health and nutrition status of South Koreans. Of 37,753 subjects from the 2008 to 2011 KNHANES, we initially selected 28,071 subjects aged ≥20 years (12,160 men and 15,911 women) (Fig. 1). Subjects with missing anthropometric data, including fat mass and muscle mass, BMI, aspartate aminotransferase (AST), or alanine transaminase (ALT), were excluded (n=10,129). In addition, subjects who met the following criteria were excluded based on our protocol: (1) positive serologic markers for hepatitis B virus (n=641); (2) a history of hepatitis C virus infection (n=23), liver cirrhosis (n=27), or hepatocellular carcinoma (n=12); and (3) alcohol consumption >140 g/week for men and >70 g/week for women (n=2,737). Finally, 14,502 participants (5,432 men and 9,070 women) were included in the analysis. Written informed consent was obtained from all of the participants before the study began, and the KNHANES was conducted following ethical approval by the Institutional Review Board of the Korea Disease Control and Prevention Agency (No: 2008-04EXP-01-C, 2009- 01CON-03-2C, 2010-02CON-21-C, 2011-02CON-06C).
Body composition was measured using dual-energy X-ray absorptiometry (DXA; QDR 4500A, Hologic Inc., Bedford, MA, USA). DXA provided absolute values for total fat mass, leg fat mass, arm fat mass, appendicular fat mass, and appendicular skeletal muscle mass without bone mass. In addition to these values, the total fat percentage (total fat mass/body weight in %), leg fat to total fat (LF/TF) ratio, arm fat to total fat (AF/TF) ratio, appendicular fat to total fat (ApF/TF) ratio, and sarcopenia index (appendicular skeletal muscle mass/BMI) were calculated. The sarcopenia index has been used as an indicator of skeletal muscle mass in previous research, and our previous studies found that skeletal muscle mass or sarcopenia itself was a strong predictor for NAFLD or hepatic fibrosis [20,21]. The definition of the sarcopenia index was officially established by a recent consensus meeting for sarcopenia [22].
The KNHANES reports subject demographics and personal and family medical history, including data on anthropometrics, and health-related behavior such as smoking or alcohol consumption from standardized health questionnaires. Body weight and height data were obtained using standard protocols. BMI was calculated as the ratio of weight to height squared (kg/m2). Waist circumference was measured at the narrowest point between the lower border of the rib cage and the iliac crest. Well-trained observers measured blood pressure manually using a mercury sphygmomanometer (Baumanometer, Baum, Copiague, NY, USA). Participants were categorized in terms of their self-reported smoking status as never-smokers, ex-smokers, or current smokers. Alcohol consumption was calculated based on the number of alcoholic drinks and the amount of alcohol consumption per day, as reported on the standardized health questionnaires. Regular exercise was defined as engaging in moderate or vigorous exercise on a regular basis (≥20 minutes at a time and at least three times per week). Diabetes mellitus was defined based on (1) use of insulin or oral hypoglycemic agents or (2) a fasting plasma glucose level ≥126 mg/dL [23]. Hypertension was defined based on (1) use of antihypertensive agents; (2) systolic blood pressure ≥140 mm Hg; or (3) diastolic blood pressure ≥90 mm Hg. Metabolic syndrome was defined according to the revised National Cholesterol Education Program criteria [24], and cutoff points of waist circumference (90 cm for men and 85 cm for women) were applied based on the criteria from the Korean Society for the Study of Obesity [25]. Blood testing was performed after a minimum 8-hour overnight fast, and collected samples were immediately refrigerated, transported to the Central Testing Institute in Seoul, Korea, and analyzed within 24 hours. Fasting plasma glucose, total cholesterol, triglyceride, and high-density lipoprotein cholesterol (HDL-C) levels were measured using a Hitachi 700–110 chemistry analyzer (Hitachi, Tokyo, Japan). Hemoglobin A1c levels were measured using high-performance liquid chromatography (HLC-723G7, Tosoh, Tokyo, Japan). Low-density lipoprotein cholesterol (LDL-C) levels were calculated using the Friedewald formula. The estimated glomerular filtration rate was derived from the Chronic Kidney Disease Epidemiology Collaboration (CKD-EPI) equation [26]. Insulin resistance was assessed using the homeostasis model assessment of insulin resistance (HOMA-IR) equation as follows: HOMA-IR=[fasting insulin (μU/mL)×fasting serum glucose (mmol/L)/22.5] [27].
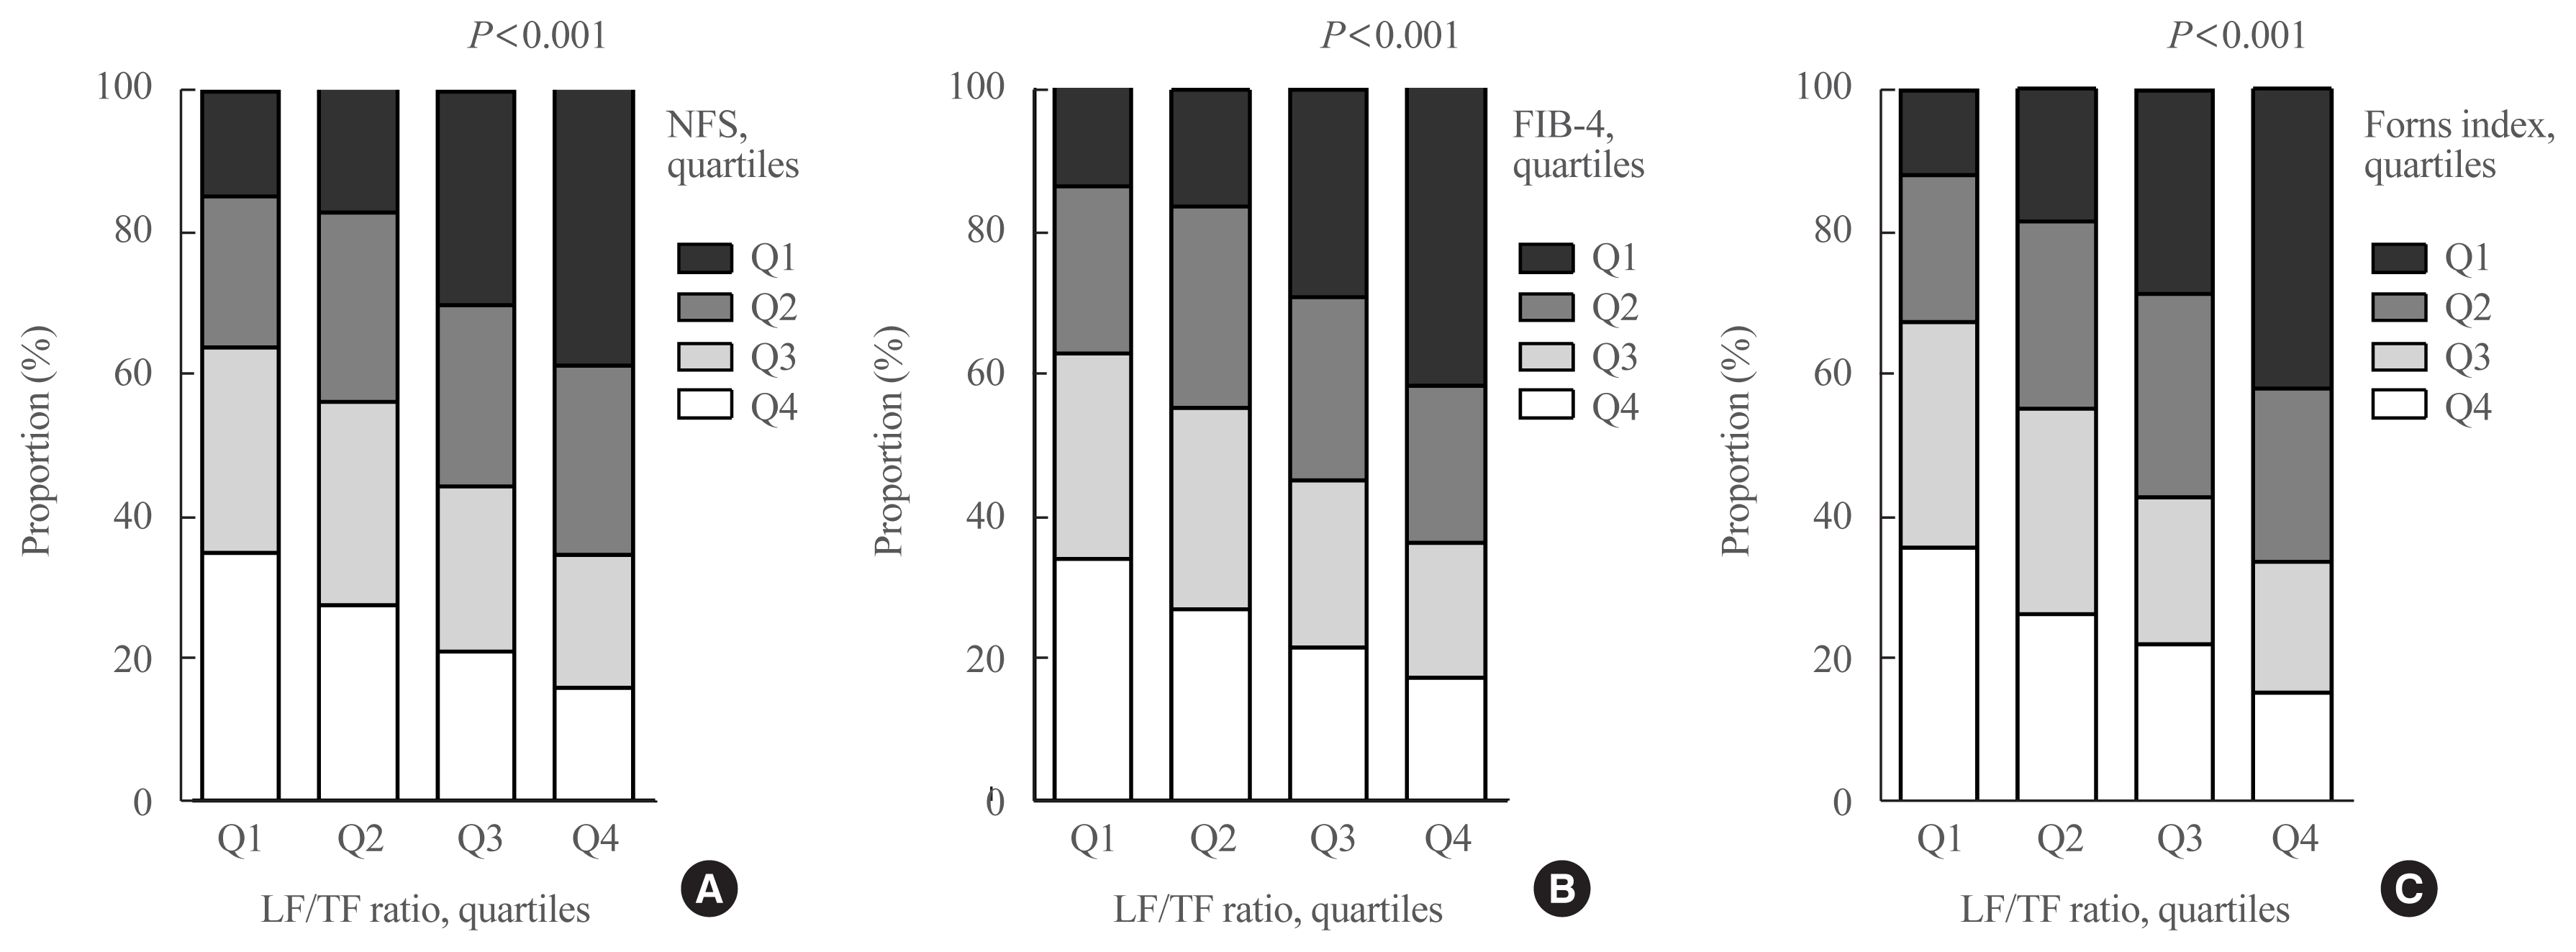
NAFLD was defined using previously validated fatty liver prediction models, including the comprehensive NAFLD score (CNS) [14], the NAFLD liver fat score (NLFS) [28], and the hepatic steatosis index (HSI) [29]. The presence of advanced hepatic fibrosis was assessed using the NAFLD fibrosis score (NFS) [30], fibrosis-4 (FIB-4) score [31], and the Forns index [32]. The NFS, FIB-4 score, and the Forns index were only calculated in subjects with NAFLD defined using the NAFLD prediction models. All prediction models are summarized in Supplemental Table S1.
Continuous and categorical variables were expressed as the mean±standard deviation and as numbers with percentages, respectively. Quartiles of the various anthropometric indices (leg fat mass, total fat mass, and LF/TF ratio) were determined after stratifying by sex. Comparisons of the prevalence of NAFLD were made using the chi-square test. The relationship between the LF/TF ratio and other metabolic parameters was examined using the Pearson correlation coefficient (r). The association between the LF/TF ratio and NAFLD prediction scores (CNS, NLFS, and HSI) or hepatic fibrosis prediction scores (NFS, FIB-4, and the Forns index) was evaluated using the chi-square test after transformation of these variables into quartiles. To compare the predictive accuracy of the LF/TF ratio with leg fat mass, total fat mass, or fat mass in other limbs (e.g., the AF/TF ratio or ApF/TF ratio), receiver operating characteristic (ROC) curve analyses were performed. We analyzed the statistical significance of the different areas under the curve (AUCs) of the prediction models using the LF/TF ratio and other parameters. Multivariable logistic regression analysis was applied to determine independent associations between the quartiles of the LF/TF ratio and NAFLD after adjustment for various confounding factors. The first model adjusted for age, sex, and BMI. The second model additionally adjusted for sarcopenia index, hypertension status, diabetes mellitus status, regular exercise, and smoking and drinking status. The third model additionally adjusted for HOMA-IR, triglyceride levels, and HDL-C levels. A P value <0.05 was considered to indicate statistical significance. Statistical analyses were performed using SPSS version 26.0 for Windows (IBM Corp., Armonk, NY, USA) and MedCalc version 20.009 (MedCalc Software, Ostend, Belgium).
Table 1 shows the baseline characteristics of the study participants. The final population consisted of 14,502 subjects (5,432 men and 9,070 women; mean age 49.9±16.2). Among the subjects, 9.7% had diabetes mellitus (11.0% men and 8.9% women) and 28.7% had hypertension (30.3% men and 27.6% women). Regarding the anthropometric parameters investigated using DXA, the mean total fat mass was 16.7±5.6 kg and leg fat mass was 5.5±1.9 kg. All absolute parameters of fat or skeletal muscle mass were greater in men compared to women. We calculated three hepatic steatosis prediction models: CNS, NLFS, and HSI. The proportion of participants with NAFLD ranged from 21.7% to 32.7% according to the different models. NAFLD was more prevalent in men than in women in all models (42.7% vs. 26.7%, 32.9% vs. 26.1%, and 24.4% vs. 20.1%, respectively).
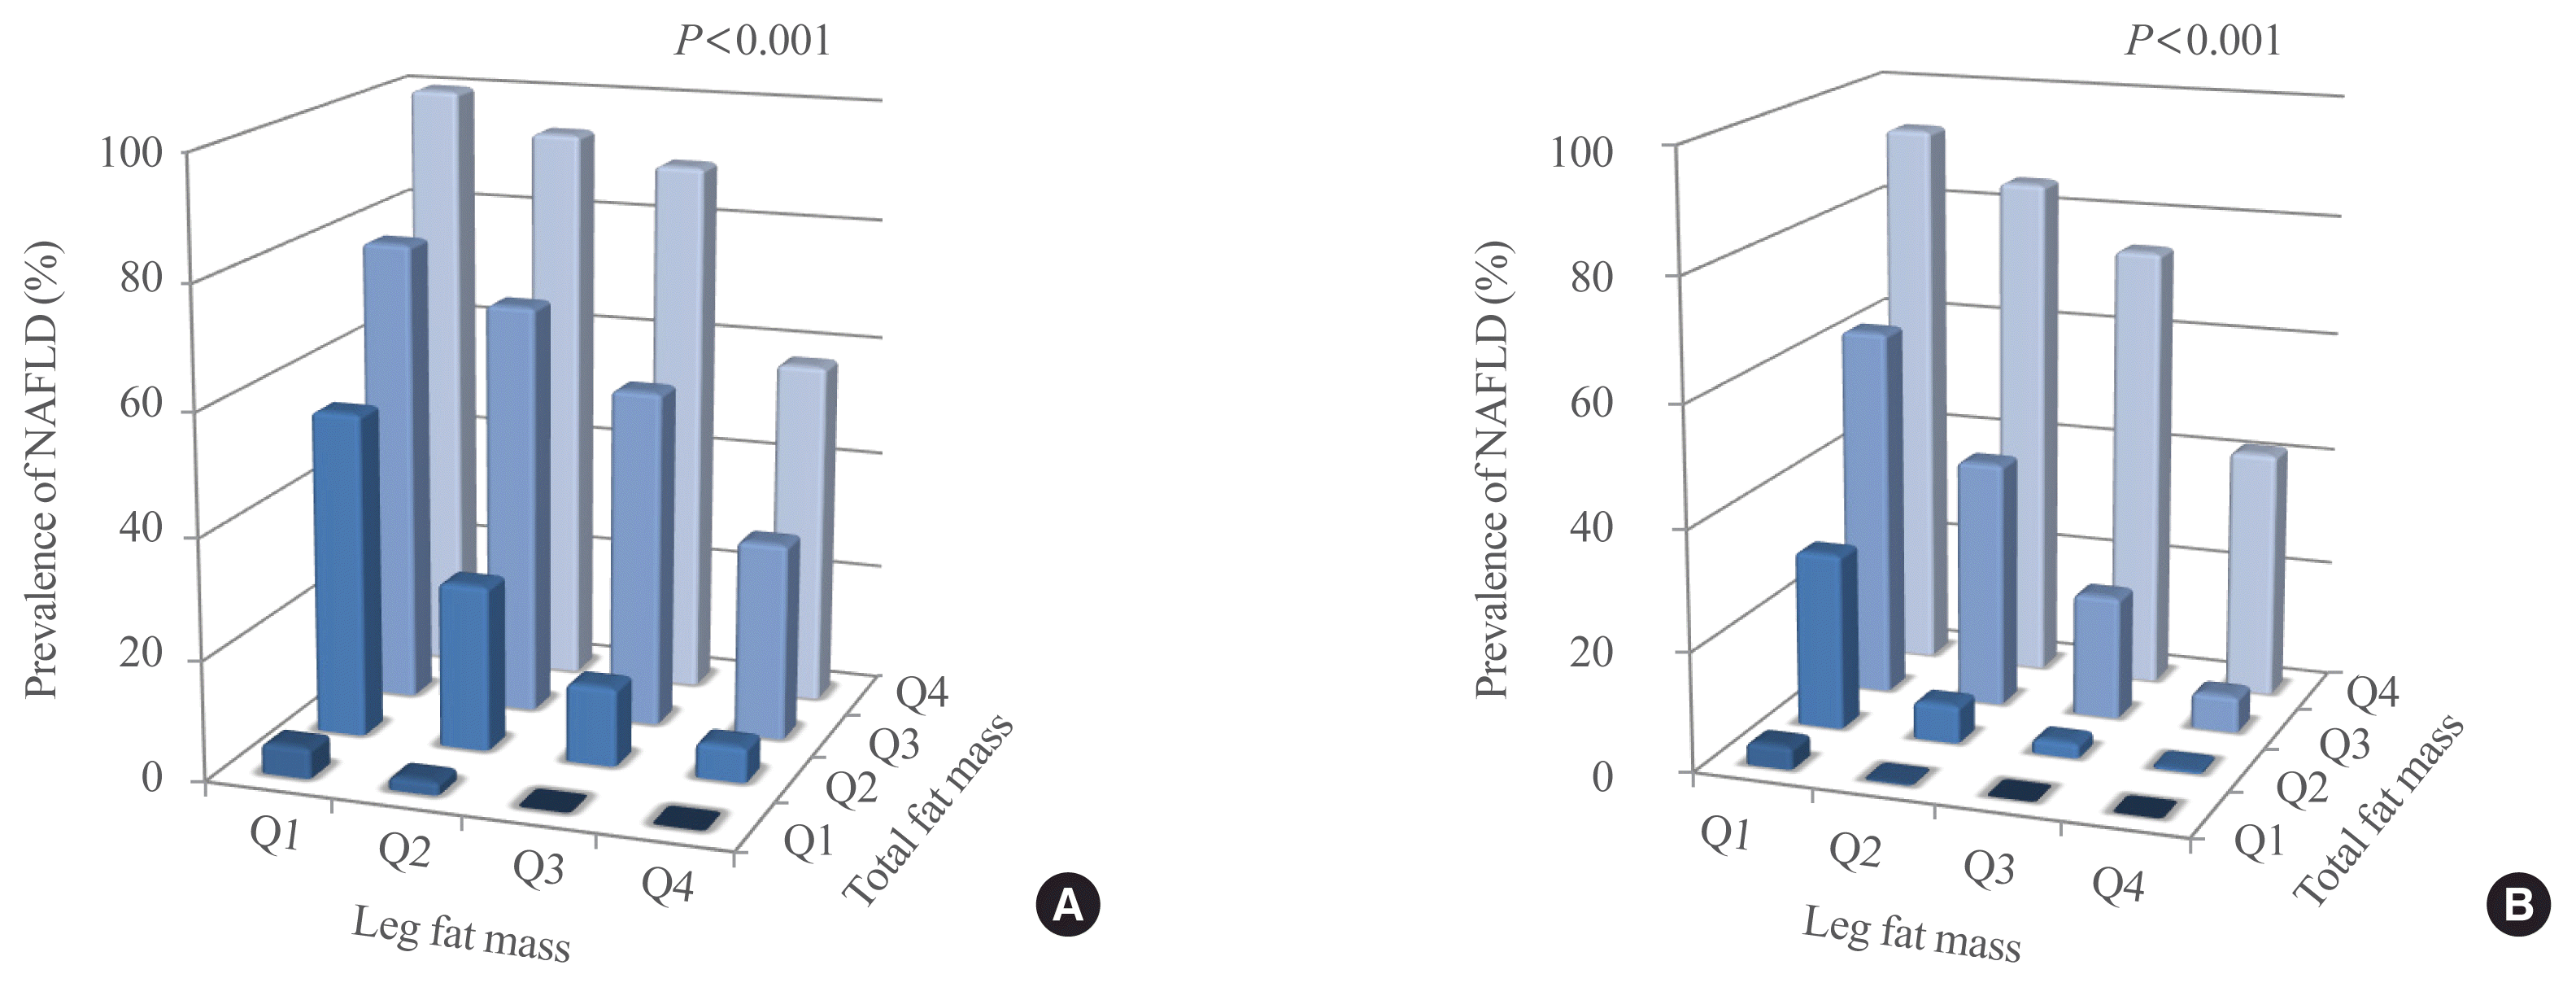
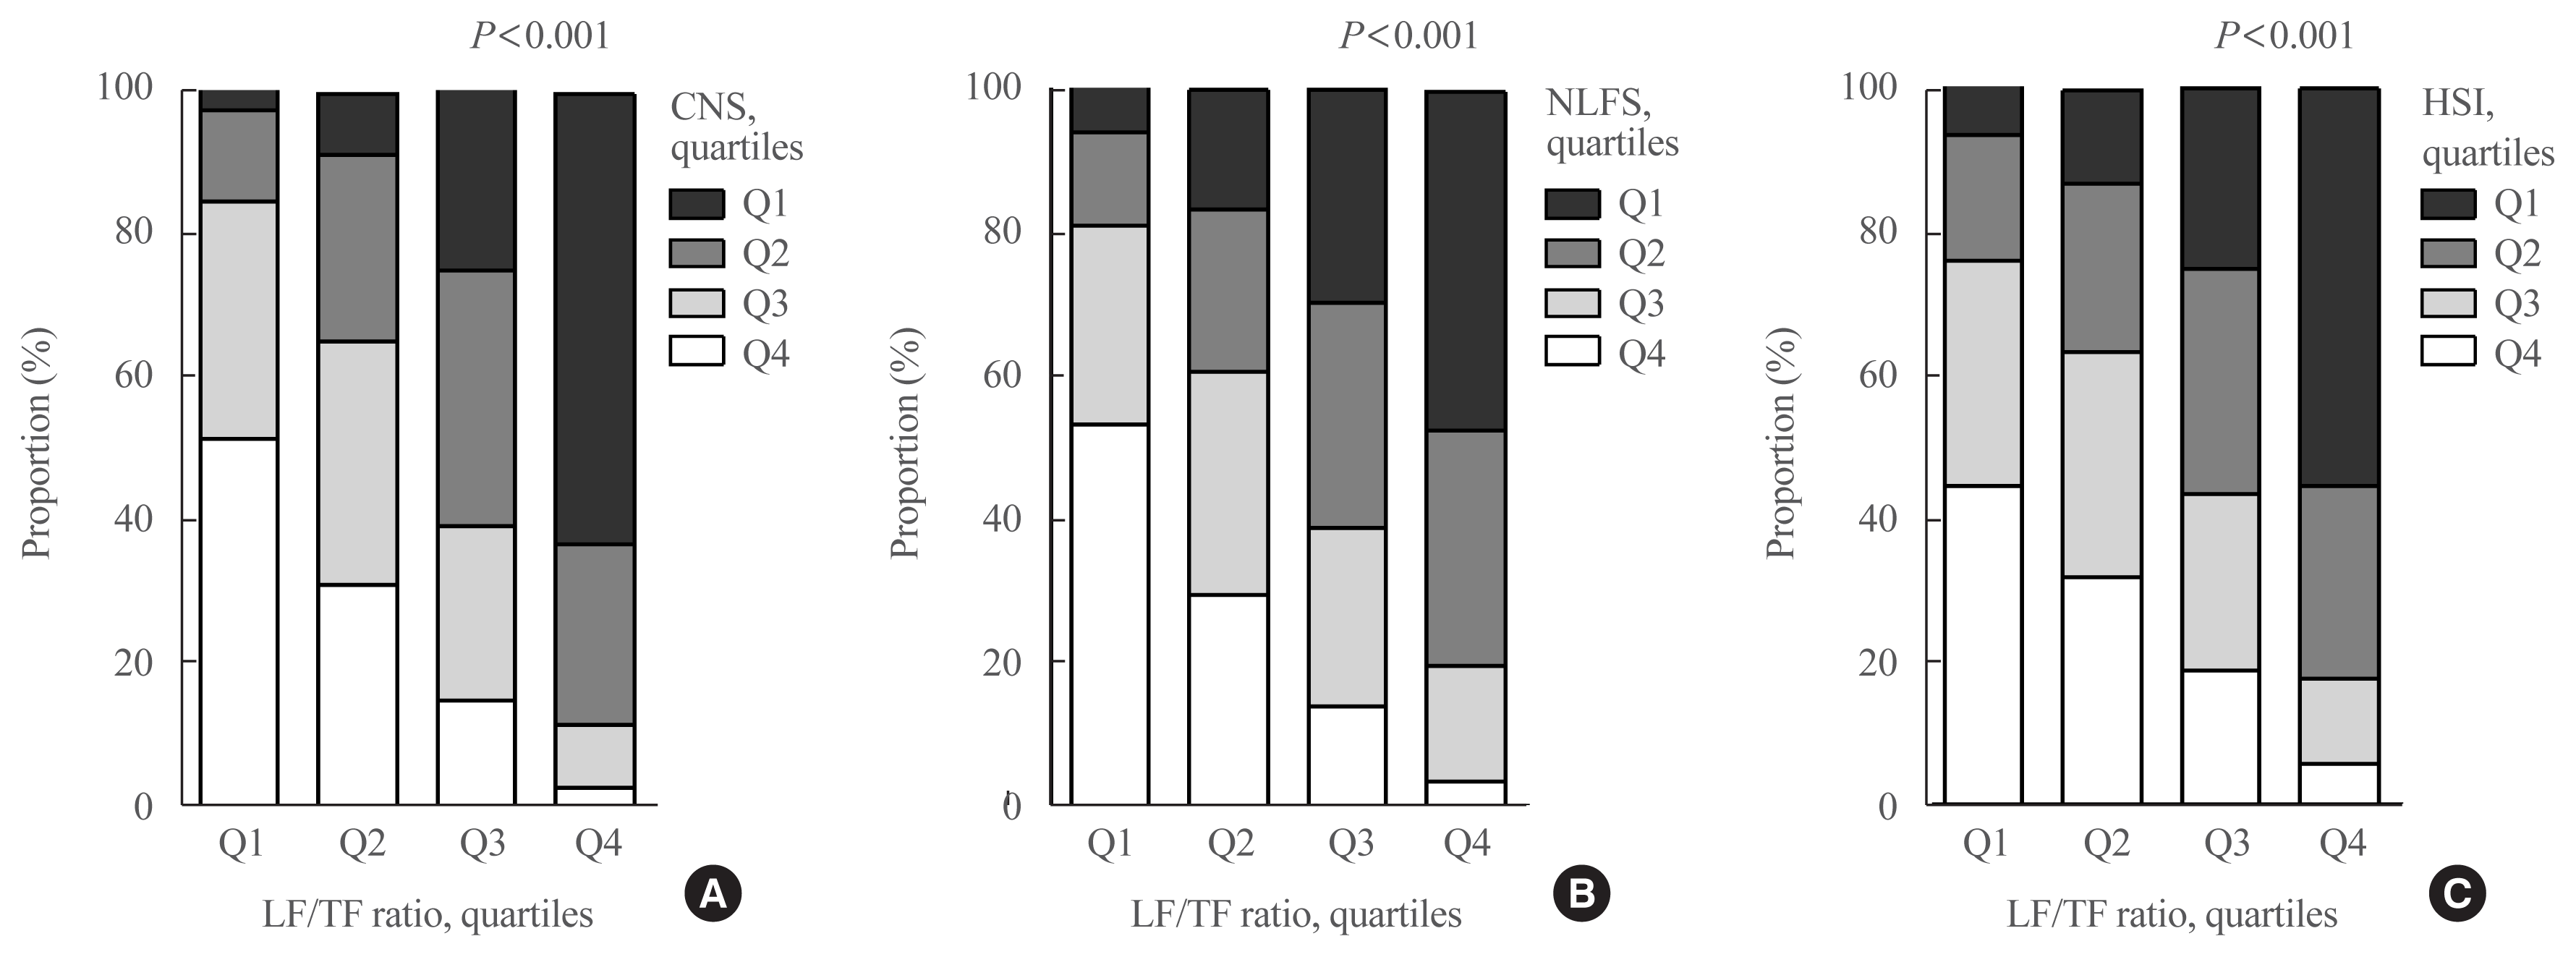
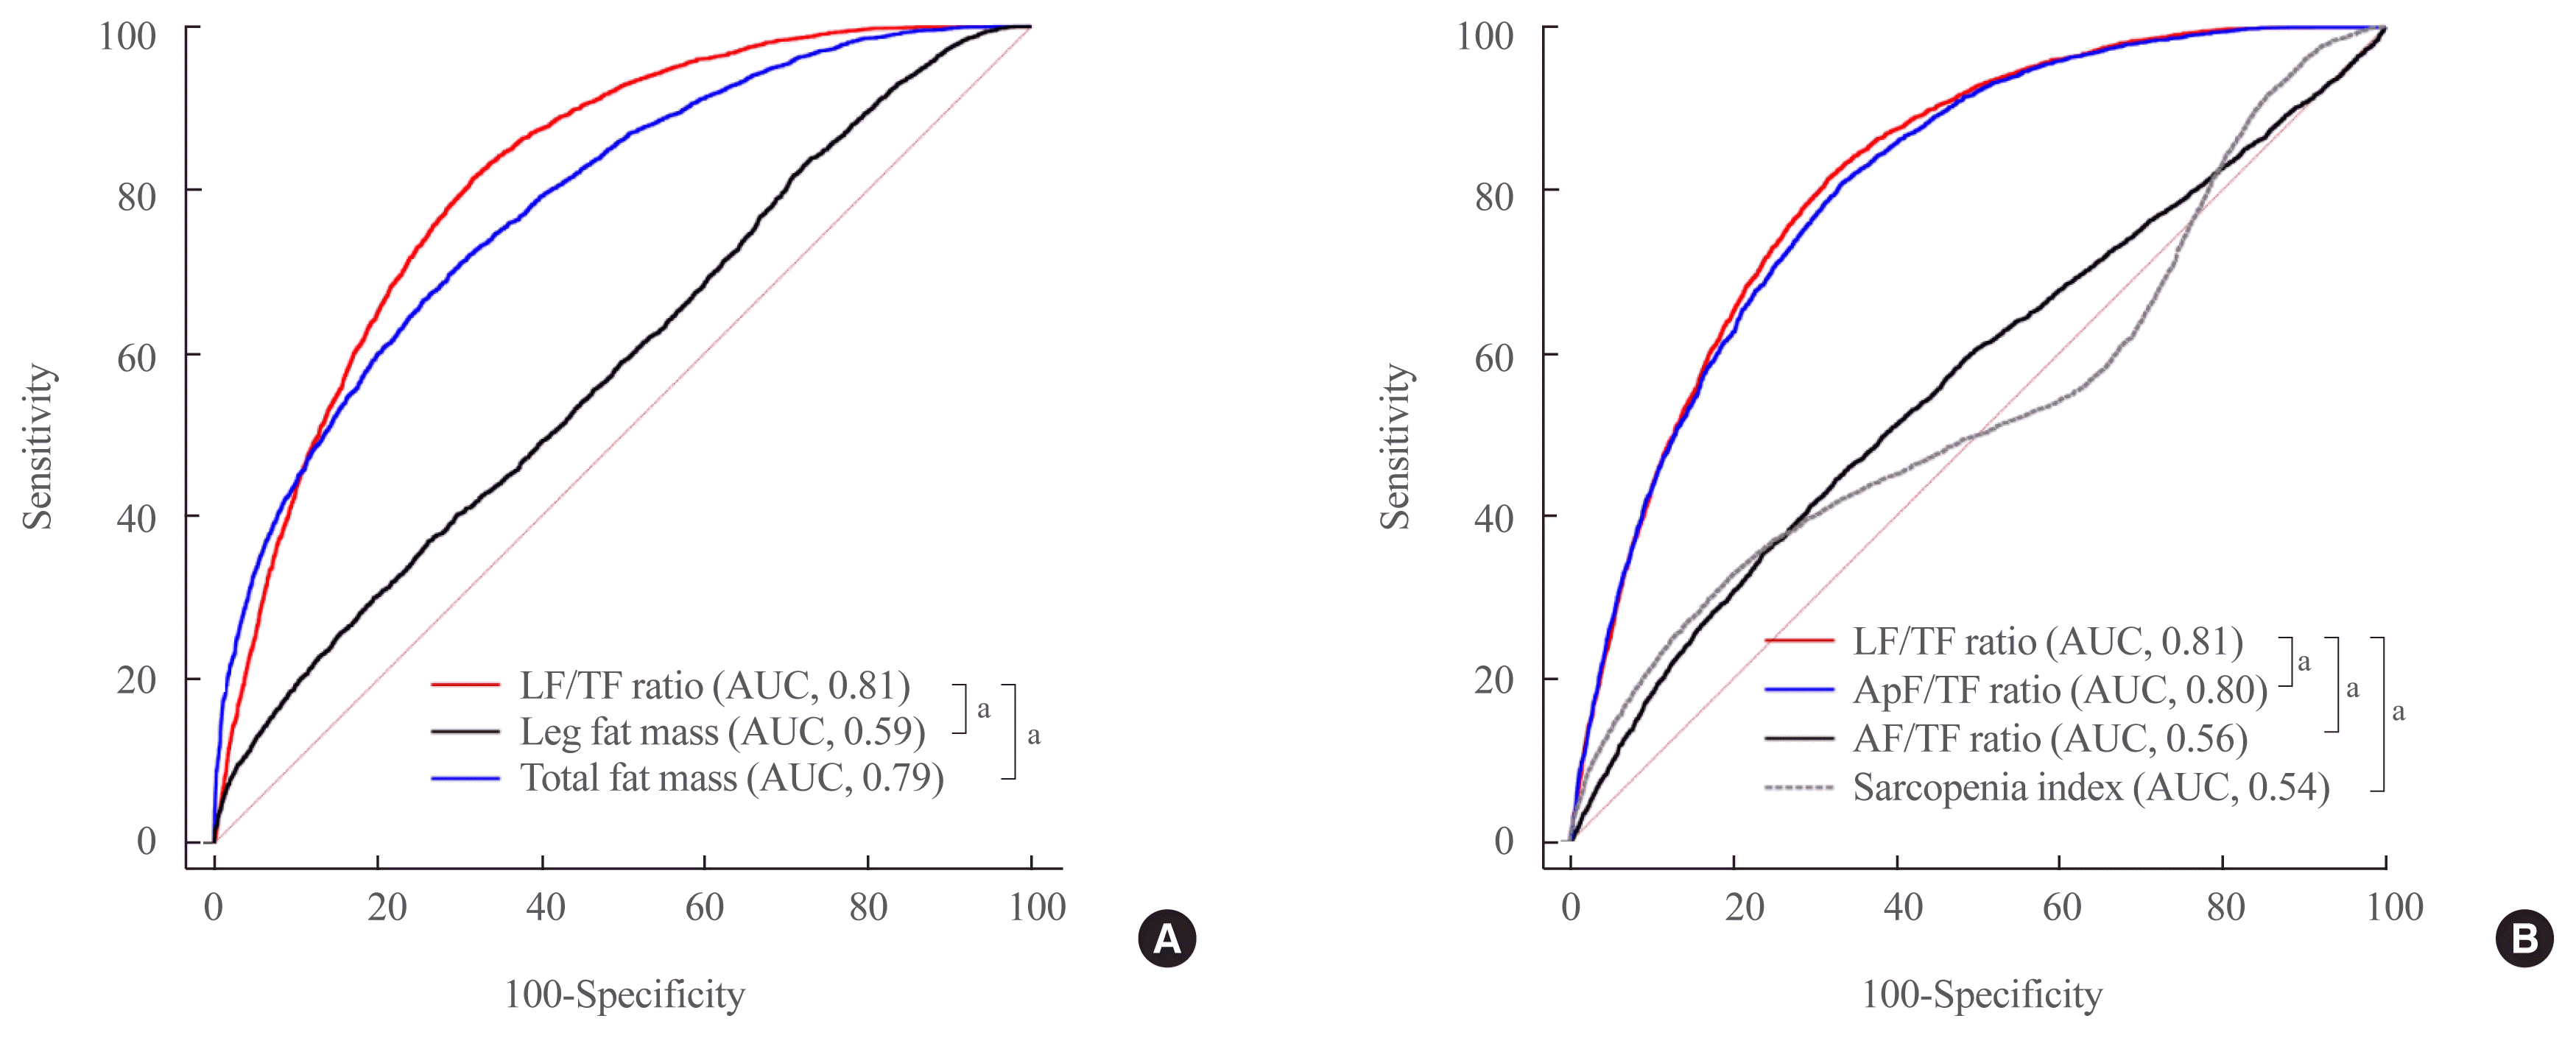
Both the lowest quartile of leg fat mass and the highest quartile of total fat mass were associated with a higher frequency of NAFLD (defined by CNS ≥40) than the highest quartile of leg fat mass or the lowest quartile of total fat mass in both men and women (Fig. 2). Since leg fat mass and total fat mass showed an opposite relationship with the risk of NAFLD, we evaluated the association of the ratio of these two parameters, the LF/TF ratio, with several cardiometabolic parameters and the frequency of NAFLD. The LF/TF ratio was negatively correlated with age, BMI, waist circumference, systolic blood pressure, diastolic blood pressure, fasting plasma glucose, fasting insulin, HOMA-IR, total cholesterol, LDL-C, triglyceride, and serum AST and ALT levels. The LF/TF ratio was positively correlated with HDL-C levels (Supplemental Table S2). When the LF/TF ratio and indices of hepatic steatosis were stratified by quartiles, the LF/TF ratio showed a strong negative correlation with our three scoring systems, CNS, NLFS, and HSI (all P<0.001) (Fig. 3). To compare the predictive accuracy for NAFLD, we performed ROC analyses. The AUC value to predict NAFLD defined by CNS ≥40 was higher when using the LF/TF ratio than when using total fat mass or leg fat mass alone. The AUCs in the ROC analysis were 0.81 (95% confidence interval [CI], 0.81 to 0.82) for the LF/TF ratio, 0.79 (95% CI, 0.78 to 0.79) for total fat mass, and 0.59 (95% CI, 0.58 to 0.60) for leg fat mass. We also compared the predictive accuracy of the LF/TF ratio to that of the AF/TF ratio, ApF/TF ratio, and sarcopenia index. The LF/TF ratio showed the best accuracy for predicting NAFLD among the four parameters (Fig. 4).
To evaluate whether the LF/TF ratio had an independent association with NAFLD, a multivariable logistic regression model was applied (Table 2). In a minimally adjusted model (model 1) with age, sex, and BMI, subjects with the lowest quartile of LF/TF ratio had a higher risk of NAFLD than subjects with the highest quartile of LF/TF ratio, regardless of the NAFLD prediction models; adjusted odds ratios (AORs) ranged from 3.37 to 7.86 (all P<0.001). This association remained significant even after adjustment for various clinical parameters, including sarcopenia index, hypertension and diabetes status, regular exercise, smoking, and drinking status, in model 2. We added several laboratory parameters such as HOMA-IR, triglyceride levels, and HDL-C levels in model 3. The AORs decreased in this model; however, they remained meaningful and ranged from 2.15 to 3.05 (all P<0.001). Since the proportion of body fat mass and the NAFLD prevalence differed according to sex, we conducted an additional analysis separately for men and women. Consistently with the previous results, the first quartile of the LF/TF ratio had a higher prevalence of NAFLD than the fourth quartile in both men and women; the AORs ranged from 1.87 to 2.93 in men, and from 2.34 to 3.15 in women (all P<0.001) (Supplemental Tables S3, S4).
Next, we evaluated the relationship between the LF/TF ratio and the degree of advanced fibrosis using non-invasive indices in subjects with NAFLD. Among the subjects with NAFLD (defined by CNS ≥40), the LF/TF ratio showed a strong negative relationship with all indices of hepatic fibrosis including NFS, FIB-4, and the Forns index (all P<0.001) (Fig. 5).
This nationally representative, population-based study demonstrated that subjects with a lower LF/TF ratio had a markedly higher risk of NAFLD than those with a high LF/TF ratio. The generally accepted risk factors for NAFLD are age, obesity, insulin resistance, and diabetes mellitus [1]. Recently, substantial evidence has confirmed the different impacts of regional fat depots in specific anatomical compartments on metabolism and insulin resistance. Excess accumulation of visceral fat is positively correlated with metabolic risk factors, while in contrast, appendicular fat mass, especially leg fat mass, is inversely correlated with metabolic risk factors and the risk of cardiovascular disease [33]. However, there are limited data about these effects on the risk of NAFLD or the degree of hepatic fibrosis. In our study, leg fat mass itself showed a negative relationship with the risk of NAFLD; however, total fat adiposity is another important risk factor for NAFLD. Therefore, we calculated the proportion of leg fat mass in relation to the total fat mass as the LF/TF ratio. The LF/TF ratio showed a negative relationship with BMI, waist circumference, systolic/diastolic blood pressure, fasting glucose level, HOMA-IR, atherogenic lipid profiles, liver enzymes, and the risk of NAFLD. Only HDL-C showed a positive correlation with the LF/TF ratio. After adjustment for various confounders, the LF/TF ratio remained a strong risk factor for NAFLD. Combining leg fat mass and total fat mass substantially improved the accuracy of NAFLD risk prediction compared to using the absolute values of total fat mass or leg fat mass alone. Furthermore, the LF/TF ratio showed better accuracy than the AF/TF ratio or ApF/TF ratio as other limb fat parameters. Lastly, the LF/TF ratio was related to the severity of fatty liver. Among the subjects with NAFLD, patients with a lower LF/TF ratio showed more advanced hepatic fibrosis, as assessed by various scoring systems, than patients with a higher LF/TF ratio. Progression to hepatic fibrosis in NAFLD is clinically important because of the poor prognosis of irreversible liver cirrhosis or hepatocellular carcinoma. Thus, our study could provide a simple method for identifying patients with NAFLD who are at high risk of advanced hepatic fibrosis.
Several studies have reported associations between limb fat mass and NAFLD; however, they have not shown consistent results [10,11]. Differences in assessments of fat deposition and NAFLD definitions or a limited number of subjects could explain these discrepancies. In our study, the LF/TF ratio was independently associated with the risk of NAFLD, regardless of sex or BMI. An increased number of subjects and precise assessment tools would produce results that are more consistent. In addition, associations between android fat or android fat-to-gynoid fat ratio and NAFLD have recently been reported based on a categorization of the fat distribution into android fat and gynoid fat [34,35].
There are potential physiological mechanisms that could explain why leg fat has the opposite effect to central visceral fat in terms of NAFLD development. First, adipocytes from leg adipose tissue are more sensitive to suppression of lipolysis and more resistant to lipolytic stimuli than adipocytes from visceral abdominal regions [36]. This phenomenon was confirmed in an in vivo human study [37]. Increased free fatty acid storage in leg fat could prevent ectopic fat accumulation in the liver [38]. Second, even among subcutaneous adipocytes, femoral adipocytes showed higher rates of insulin-stimulated glucose oxidation and differences in insulin binding under conditions of insulin stimulation than abdominal adipocytes [39]. Furthermore, as is well known, adipose tissue acts as an endocrine organ and secretes numerous adipokines such as adiponectin, leptin, resistin, interleukin-6, and tumor necrosis factor-α. Regional differences in the secretion of these factors could partially explain the different metabolic effects of each fat depot [40]. However, while there are known differences in secretion between visceral fat and subcutaneous fat, and between abdominal subcutaneous fat and gluteal subcutaneous fat, less is known regarding differences between upper extremity subcutaneous fat and lower extremity subcutaneous fat.
The present study has several strengths. First, our study provides clear evidence of a negative relationship between the LF/TF ratio and various metabolic parameters, as well as the presence of hepatic steatosis. NAFLD is affected by obesity, insulin resistance, and skeletal muscle mass; however, the LF/TF ratio showed a markedly increased association with the risk of NAFLD after adjustment for various risk factors. Second, this is a large population-based analysis using well-examined national data. Previous studies on the metabolic effects of leg fat have included a relatively small number of subjects; however, our data included a sufficient number of subjects, which strengthens the statistical power and reliability of our results. Third, because our study showed consistent results regardless of sex, the effect of the LF/TF ratio could be applied to the general population. In addition, we investigated the association between the LF/TF ratio and advanced liver fibrosis in subjects with hepatic steatosis. These results suggested that interactions between leg fat mass and total fat mass could control lipid metabolism by regulating free fatty acid levels or the release of various adipokines from each fat depot, resulting in the development or progression of NAFLD. This possibility could be considered for the development of therapeutic or preventative strategies for NAFLD. Finally, because well-validated and easy-to-calculate indices to assess hepatic steatosis and fibrosis were used in our study, these findings can be easily applied for the assessment of NAFLD in real-world clinical settings.
However, there are several limitations of our study. First, the nature of this cross-sectional study using data derived from the KNHANES survey restricts causal inferences regarding the relationship between the LF/TF ratio and the presence of NAFLD. In addition, there could be information bias about alcohol consumption or medical history from the self-reported survey data. Second, we defined hepatic steatosis and advanced hepatic fibrosis based on clinical criteria only, without imaging studies or liver biopsies. However, the indices used in our study have been well-validated compared to the results of liver biopsy in patients with chronic liver diseases such as viral hepatitis. Furthermore, the adaptation of non-invasive prediction models for NAFLD and hepatic fibrosis made this large population-based study possible despite its limitations. Third, DXA is a useful method of measuring total body composition and fat content in a large population, but its application is limited in terms of quantifying muscle mass and fat mass precisely and providing information about the metabolism of each tissue. Lastly, because data were not available for gamma-glutamyl transpeptidase levels or platelet counts, we could not calculate the score for hepatic fibrosis in all patients with NAFLD.
In conclusion, the present study showed that a lower LF/TF ratio was markedly associated with a higher risk of hepatic steatosis using various predictive models in a Korean population. Furthermore, the LF/TF ratio was negatively correlated with advanced hepatic fibrosis in subjects with NAFLD. Our study suggests that the LF/TF ratio might be a more useful anthropometric parameter to predict NAFLD or advanced hepatic fibrosis than total fat mass or leg fat mass alone, and it could be helpful for future clinical assessments of the risk of NAFLD or progression to hepatic fibrosis.
ACKNOWLEDGMENTS
This study was supported by the Chung-Ang University Research Grants in 2014. This research was supported by Basic Science Research Program through the National Research Foundation of Korea (NRF) funded by the Ministry of Education (2018R1D1A1B07050005). The results of this study were presented in poster sessions at Obesity Week 2019, which was held from November 3 to 7, 2019 in Las Vegas, NV, USA.
REFERENCES
1. Rinella ME. Nonalcoholic fatty liver disease: a systematic review. JAMA. 2015; 313:2263–73.
3. Vernon G, Baranova A, Younossi ZM. Systematic review: the epidemiology and natural history of non-alcoholic fatty liver disease and non-alcoholic steatohepatitis in adults. Aliment Pharmacol Ther. 2011; 34:274–85.
4. Rhee EJ. Nonalcoholic fatty liver disease and diabetes: an epidemiological perspective. Endocrinol Metab (Seoul). 2019; 34:226–33.
5. Han E, Lee YH. Non-alcoholic fatty liver disease: the emerging burden in cardiometabolic and renal diseases. Diabetes Metab J. 2017; 41:430–7.
6. Han JM, Kim HI, Lee YJ, Lee JW, Kim KM, Bae JC. Differing associations between fatty liver and dyslipidemia according to the degree of hepatic steatosis in Korea. J Lipid Atheroscler. 2019; 8:258–66.
7. Li L, Liu DW, Yan HY, Wang ZY, Zhao SH, Wang B. Obesity is an independent risk factor for non-alcoholic fatty liver disease: evidence from a meta-analysis of 21 cohort studies. Obes Rev. 2016; 17:510–9.
8. Choi SI, Chung D, Lim JS, Lee MY, Shin JY, Chung CH, et al. Relationship between regional body fat distribution and diabetes mellitus: 2008 to 2010 Korean National Health and Nutrition Examination Surveys. Diabetes Metab J. 2017; 41:51–9.
9. Goodpaster BH, Krishnaswami S, Harris TB, Katsiaras A, Kritchevsky SB, Simonsick EM, et al. Obesity, regional body fat distribution, and the metabolic syndrome in older men and women. Arch Intern Med. 2005; 165:777–83.
10. Subramanian V, Johnston RD, Kaye P, Aithal GP. Regional anthropometric measures associated with the severity of liver injury in patients with non-alcoholic fatty liver disease. Aliment Pharmacol Ther. 2013; 37:455–63.
11. Suzuki A, Abdelmalek MF, Unalp-Arida A, Yates K, Sanyal A, Guy C, et al. Regional anthropometric measures and hepatic fibrosis in patients with nonalcoholic fatty liver disease. Clin Gastroenterol Hepatol. 2010; 8:1062–9.
12. Ratziu V, Charlotte F, Heurtier A, Gombert S, Giral P, Bruckert E, et al. Sampling variability of liver biopsy in nonalcoholic fatty liver disease. Gastroenterology. 2005; 128:1898–906.
13. Lee DH. Noninvasive evaluation of nonalcoholic fatty liver disease. Endocrinol Metab (Seoul). 2020; 35:243–59.
14. Lee YH, Bang H, Park YM, Bae JC, Lee BW, Kang ES, et al. Non-laboratory-based self-assessment screening score for non-alcoholic fatty liver disease: development, validation and comparison with other scores. PLoS One. 2014; 9:e107584.
15. Harrison SA, Oliver D, Arnold HL, Gogia S, Neuschwander-Tetri BA. Development and validation of a simple NAFLD clinical scoring system for identifying patients without advanced disease. Gut. 2008; 57:1441–7.
16. Dyson JK, Anstee QM, McPherson S. Non-alcoholic fatty liver disease: a practical approach to diagnosis and staging. Frontline Gastroenterol. 2014; 5:211–8.
17. Kim D, Kim WR, Kim HJ, Therneau TM. Association between noninvasive fibrosis markers and mortality among adults with nonalcoholic fatty liver disease in the United States. Hepatology. 2013; 57:1357–65.
18. Sumida Y, Yoneda M, Hyogo H, Itoh Y, Ono M, Fujii H, et al. Validation of the FIB4 index in a Japanese nonalcoholic fatty liver disease population. BMC Gastroenterol. 2012; 12:2.
19. Angulo P, Bugianesi E, Bjornsson ES, Charatcharoenwitthaya P, Mills PR, Barrera F, et al. Simple noninvasive systems predict long-term outcomes of patients with nonalcoholic fatty liver disease. Gastroenterology. 2013; 145:782–9.
20. Lee YH, Jung KS, Kim SU, Yoon HJ, Yun YJ, Lee BW, et al. Sarcopaenia is associated with NAFLD independently of obesity and insulin resistance: nationwide surveys (KNHANES 2008–2011). J Hepatol. 2015; 63:486–93.
21. Lee YH, Kim SU, Song K, Park JY, Kim DY, Ahn SH, et al. Sarcopenia is associated with significant liver fibrosis independently of obesity and insulin resistance in nonalcoholic fatty liver disease: nationwide surveys (KNHANES 2008–2011). Hepatology. 2016; 63:776–86.
22. Studenski SA, Peters KW, Alley DE, Cawthon PM, McLean RR, Harris TB, et al. The FNIH sarcopenia project: rationale, study description, conference recommendations, and final estimates. J Gerontol A Biol Sci Med Sci. 2014; 69:547–58.
23. American Diabetes Association. Diagnosis and classification of diabetes mellitus. Diabetes Care. 2010; 33(Suppl 1):S62–9.
24. Grundy SM, Cleeman JI, Daniels SR, Donato KA, Eckel RH, Franklin BA, et al. Diagnosis and management of the metabolic syndrome: an American Heart Association/National Heart, Lung, and Blood Institute Scientific Statement. Circulation. 2005; 112:2735–52.
26. Levey AS, Stevens LA, Schmid CH, Zhang YL, Castro AF 3rd, Feldman HI, et al. A new equation to estimate glomerular filtration rate. Ann Intern Med. 2009; 150:604–12.
27. Matthews DR, Hosker JP, Rudenski AS, Naylor BA, Treacher DF, Turner RC. Homeostasis model assessment: insulin resistance and beta-cell function from fasting plasma glucose and insulin concentrations in man. Diabetologia. 1985; 28:412–9.
28. Kotronen A, Peltonen M, Hakkarainen A, Sevastianova K, Bergholm R, Johansson LM, et al. Prediction of non-alcoholic fatty liver disease and liver fat using metabolic and genetic factors. Gastroenterology. 2009; 137:865–72.
29. Lee JH, Kim D, Kim HJ, Lee CH, Yang JI, Kim W, et al. Hepatic steatosis index: a simple screening tool reflecting nonalcoholic fatty liver disease. Dig Liver Dis. 2010; 42:503–8.
30. Angulo P, Hui JM, Marchesini G, Bugianesi E, George J, Farrell GC, et al. The NAFLD fibrosis score: a noninvasive system that identifies liver fibrosis in patients with NAFLD. Hepatology. 2007; 45:846–54.
31. Vallet-Pichard A, Mallet V, Nalpas B, Verkarre V, Nalpas A, Dhalluin-Venier V, et al. FIB-4: an inexpensive and accurate marker of fibrosis in HCV infection. comparison with liver biopsy and fibrotest. Hepatology. 2007; 46:32–6.
32. Forns X, Ampurdanes S, Llovet JM, Aponte J, Quinto L, Martinez-Bauer E, et al. Identification of chronic hepatitis C patients without hepatic fibrosis by a simple predictive model. Hepatology. 2002; 36(4 Pt 1):986–92.
33. Hu G, Bouchard C, Bray GA, Greenway FL, Johnson WD, Newton RL Jr, et al. Trunk versus extremity adiposity and cardiometabolic risk factors in white and African American adults. Diabetes Care. 2011; 34:1415–8.
34. Hsing JC, Nguyen MH, Yang B, Min Y, Han SS, Pung E, et al. Associations between body fat, muscle mass, and nonalcoholic fatty liver disease: a population-based study. Hepatol Commun. 2019; 3:1061–72.
35. Alferink LJ, Trajanoska K, Erler NS, Schoufour JD, de Knegt RJ, Ikram MA, et al. Nonalcoholic fatty liver disease in the rotterdam study: about muscle mass, sarcopenia, fat mass, and fat distribution. J Bone Miner Res. 2019; 34:1254–63.
36. Wahrenberg H, Lonnqvist F, Arner P. Mechanisms underlying regional differences in lipolysis in human adipose tissue. J Clin Invest. 1989; 84:458–67.
37. Shadid S, Koutsari C, Jensen MD. Direct free fatty acid uptake into human adipocytes in vivo: relation to body fat distribution. Diabetes. 2007; 56:1369–75.
38. Arner P. Insulin resistance in type 2 diabetes: role of fatty acids. Diabetes Metab Res Rev. 2002; 18(Suppl 2):S5–9.
Table 1
BMI, body mass index; HOMA-IR, homeostasis model assessment of insulin resistance; HDL-C, high-density lipoprotein cholesterol; LDL-C, low-density lipoprotein cholesterol; AST, aspartate aminotransferase; ALT, alanine transaminase; eGFR, estimated glomerular filtration rate; NAFLD, non-alcoholic fatty liver disease.
Table 2
Variable | NAFLD assessed by CNS (n=4,291, 29.6%) | NAFLD assessed by NLFS (n=4,158, 28.7%) | NAFLD assessed by HSI (n=3,153, 21.7%) | ||||||
---|---|---|---|---|---|---|---|---|---|
|
|
|
|||||||
AOR | 95% CI | P value | AOR | 95% CI | P value | AOR | 95% CI | P value | |
Adjusted model 1a | |||||||||
LF/TF ratio Q1 | 7.86 | 6.01–10.26 | <0.001 | 6.29 | 5.11–7.73 | <0.001 | 3.37 | 2.56–4.44 | <0.001 |
LF/TF ratio Q2 | 4.08 | 3.15–5.30 | <0.001 | 3.25 | 2.65–3.98 | <0.001 | 2.66 | 2.03–3.49 | <0.001 |
LF/TF ratio Q3 | 2.36 | 1.81–3.07 | <0.001 | 1.95 | 1.59–2.40 | <0.001 | 1.64 | 1.25–2.16 | <0.001 |
LF/TF ratio Q4 | 1.00 | Reference | 1.00 | Reference | 1.00 | Reference | |||
|
|||||||||
Adjusted model 2b | |||||||||
LF/TF ratio Q1 | 7.96 | 5.97–10.61 | <0.001 | 6.26 | 4.99–7.85 | <0.001 | 3.29 | 2.45–4.42 | <0.001 |
LF/TF ratio Q2 | 3.94 | 2.98–5.19 | <0.001 | 3.05 | 2.45–3.81 | <0.001 | 2.61 | 1.96–3.47 | <0.001 |
LF/TF ratio Q3 | 2.36 | 1.78–3.12 | <0.001 | 1.89 | 1.51–2.36 | <0.001 | 1.67 | 1.26–2.23 | <0.001 |
LF/TF ratio Q4 | 1.00 | Reference | 1.00 | Reference | 1.00 | Reference | |||
|
|||||||||
Adjusted model 3c | |||||||||
LF/TF ratio Q1 | 3.05 | 2.11–4.40 | <0.001 | 2.32 | 1.71–3.15 | <0.001 | 2.15 | 1.55–2.97 | <0.001 |
LF/TF ratio Q2 | 1.97 | 1.38–2.80 | <0.001 | 1.43 | 1.06–1.92 | 0.018 | 2.05 | 1.51–2.80 | <0.001 |
LF/TF ratio Q3 | 1.46 | 1.02–2.08 | 0.038 | 1.19 | 0.88–1.60 | 0.254 | 1.42 | 1.05–1.94 | 0.025 |
LF/TF ratio Q4 | 1.00 | Reference | 1.00 | Reference | 1.00 | Reference |
AOR, adjusted odds ratio; CI, confidence interval; NAFLD, non-alcoholic fatty liver disease; CNS, comprehensive NAFLD score; NLFS, NAFLD liver fat score; HSI, hepatic steatosis index; LF/TF, leg fat to total fat.