INTRODUCTION
METHODS
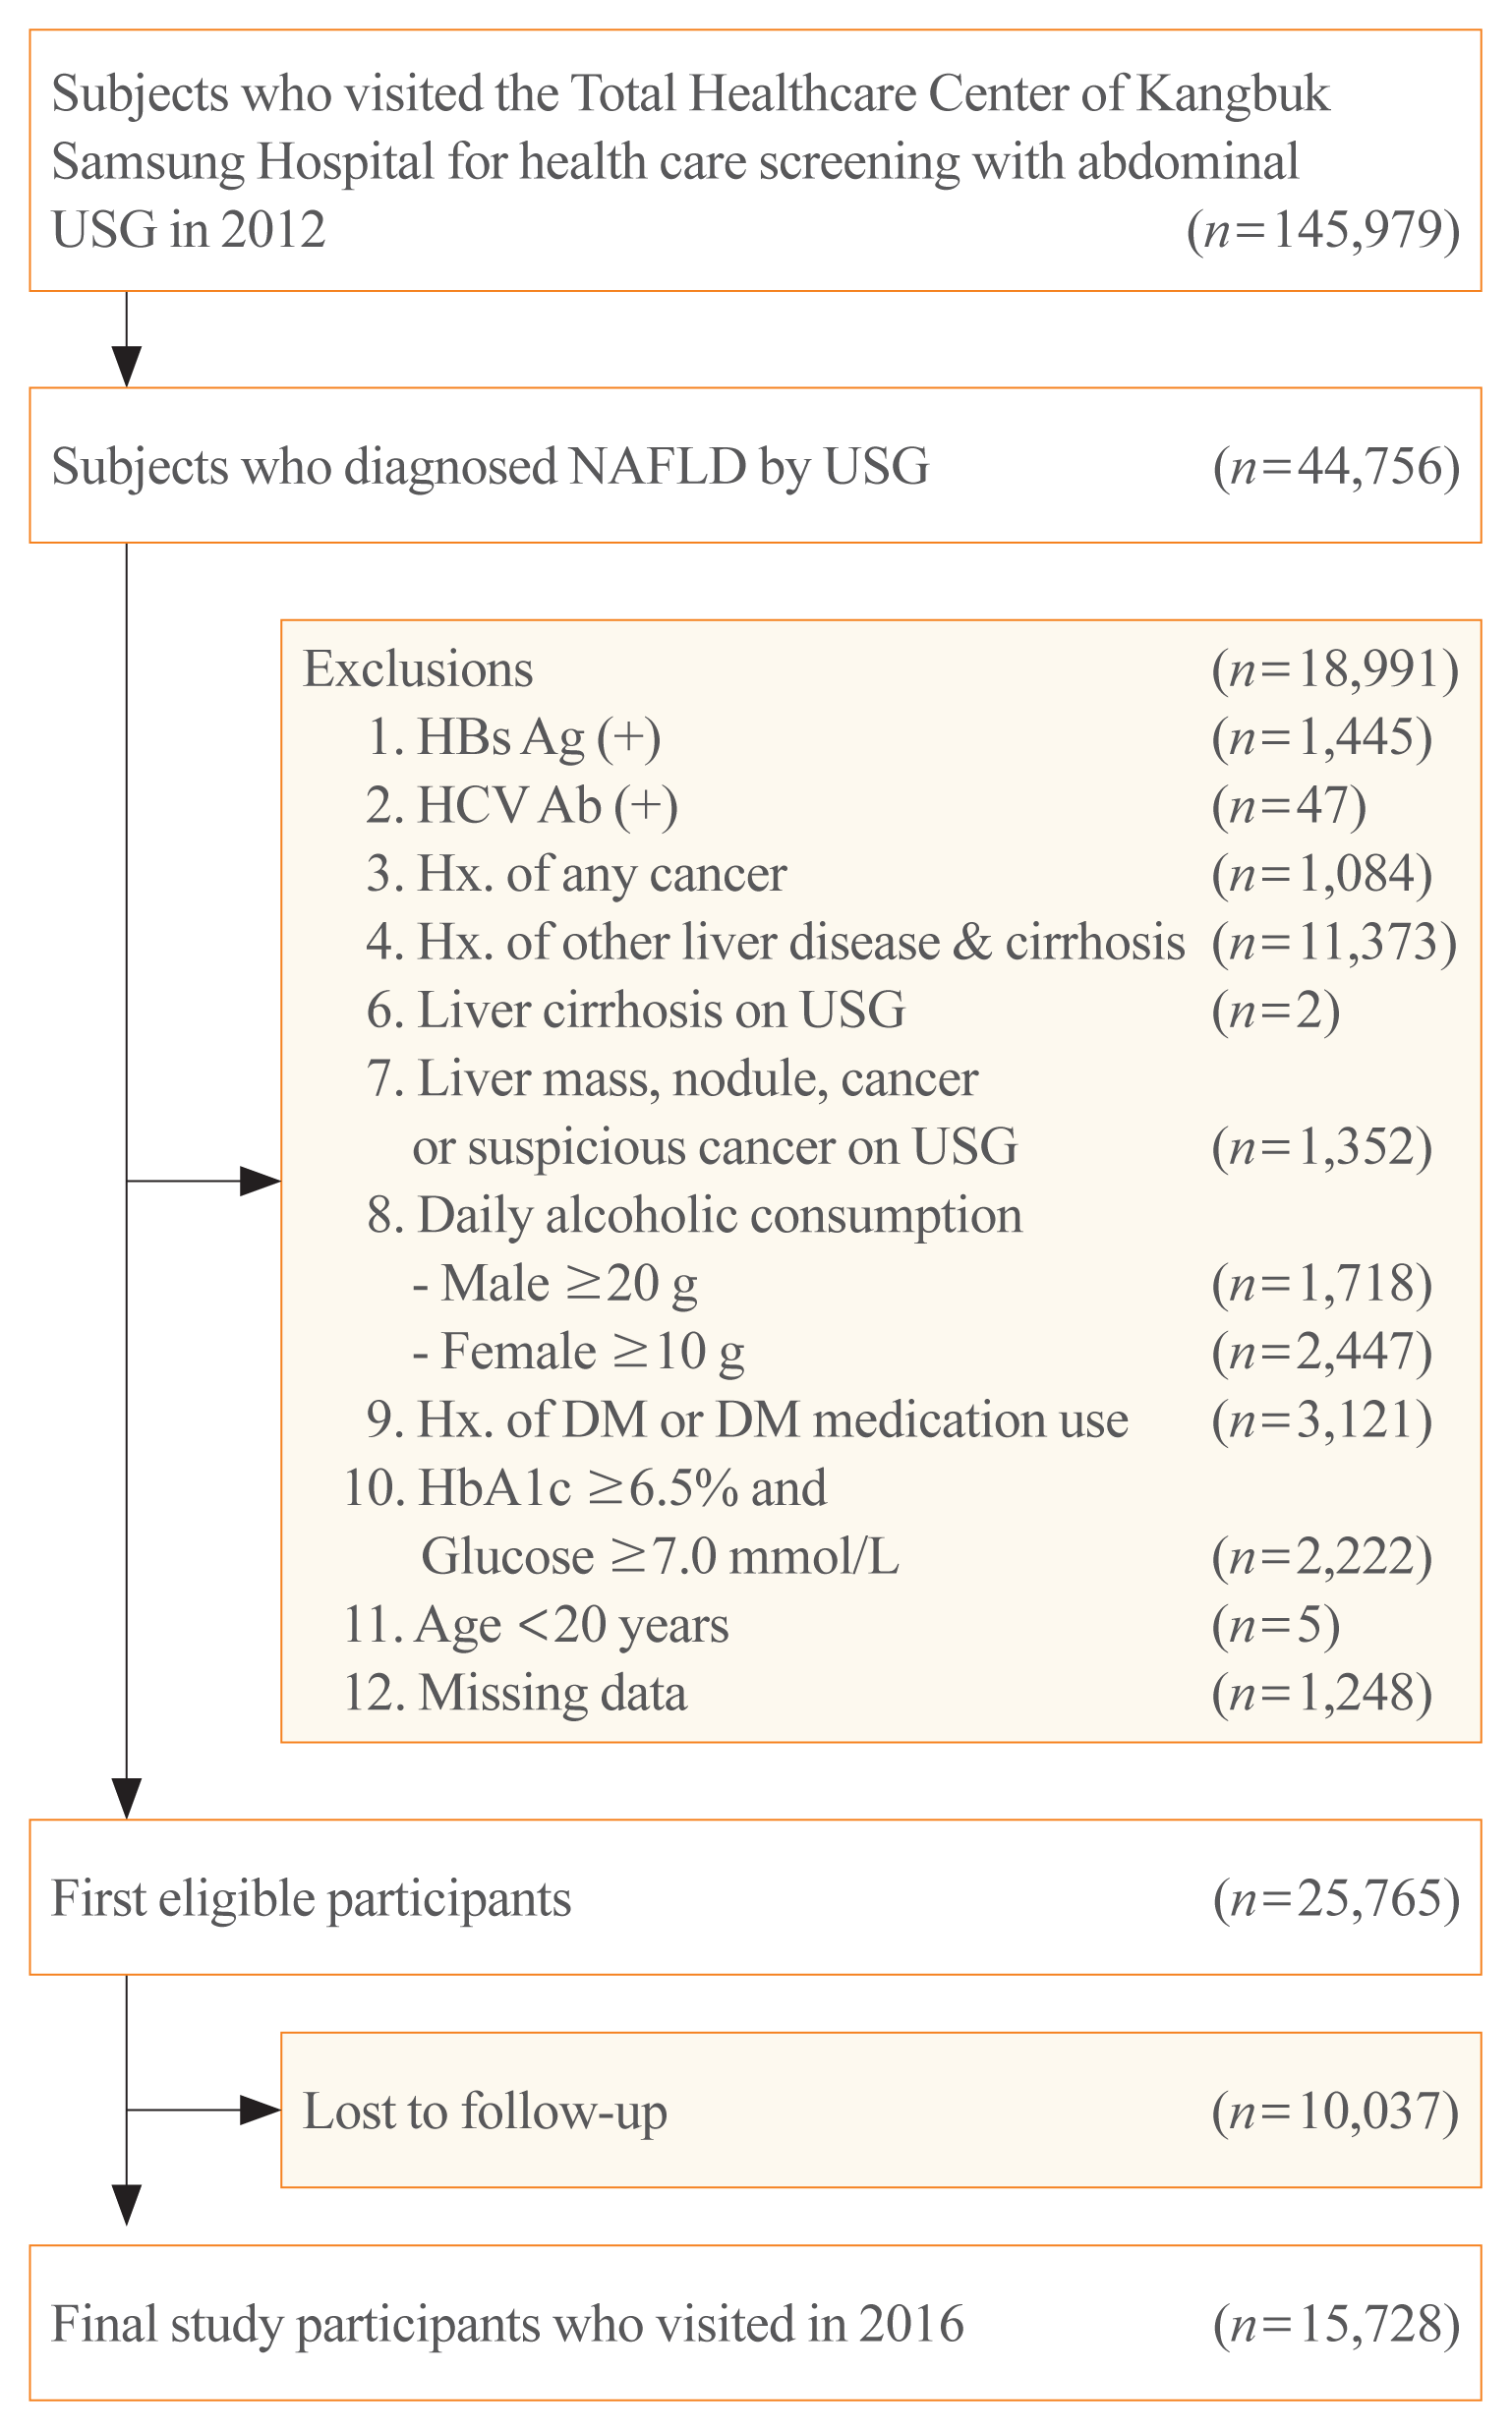
Study population and design
Anthropometric and laboratory measurements
Diagnosis of NAFLD and advanced liver fibrosis
Statistical analysis
RESULTS
General characteristics of study participants
Table 1
| Characteristic | Overall | HOMA-IR change groups | P value | |||
|---|---|---|---|---|---|---|
|
|
||||||
| G1 (<0) | G2 (0–0.50) | G3 (0.51–1.00) | G4 (>1.00) | |||
| No. of participants (%) | 15,728 | 6,010 (38.2) | 3,512 (22.3) | 2,587 (16.4) | 3,619 (23.0) | |
|
|
||||||
| Male sex | 13,531 (86.0) | 5,140 (85.5) | 3,085 (87.8) | 2,240 (86.5) | 3,066 (84.7) | 0.001 |
|
|
||||||
| Age, yr | 40.5±6.5 | 40.7±6.4 | 40.9±6.7 | 40.5±6.4 | 39.6±6.4 | <0.001 |
|
|
||||||
| BMI, kg/m2 | 25.8±2.8 | 25.9±2.8 | 25.2±2.6 | 25.5±2.6 | 26.4±2.9 | <0.001 |
|
|
||||||
| Obesitya | 9,260 (58.8) | 3,618 (60.2) | 1,823 (51.9) | 1,435 (55.4) | 2,384 (65.8) | <0.001 |
|
|
||||||
| Waist circumference, cm | 89.2±7.3 | 89.3±7.4 | 87.9±6.9 | 88.5±6.8 | 90.7±7.8 | <0.001 |
|
|
||||||
| Fasting blood glucose, mmol/L | 5.42±0.50 | 5.53±0.52 | 5.36±0.47 | 5.33±0.48 | 5.35±0.50 | <0.001 |
|
|
||||||
| Hemoglobin A1c, % | 5.6±0.2 | 5.6±0.2 | 5.6±0.2 | 5.6±0.2 | 5.7±0.31 | <0.001 |
|
|
||||||
| SBP, mm Hg | 113.5±12.0 | 113.94±11.9 | 112.55±11.6 | 112.64±11.7 | 114.62±12.5 | <0.001 |
|
|
||||||
| AST, U/L | 22 (18–28) | 22 (18–27) | 21 (18–27) | 22 (18–27) | 24 (19–31) | <0.001 |
|
|
||||||
| ALT, U/L | 28 (20–40) | 27 (20–40) | 25 (19–37) | 26 (20–38) | 31 (22–46) | <0.001 |
|
|
||||||
| Platelets, ×103/mm3 | 241 (212–274) | 241 (212–274) | 240 (211–272) | 242 (213–273) | 242 (212–276) | 0.056 |
|
|
||||||
| Albumin, g/dL | 4.63±0.23 | 4.62±0.23 | 4.62±0.23 | 4.63±0.24 | 4.64±0.24 | <0.001 |
|
|
||||||
| Total cholesterol, mmol/L | 5.38±0.89 | 5.38±0.9 | 5.35±0.88 | 5.36±0.87 | 5.4±0.91 | 0.103 |
|
|
||||||
| Triglyceride, mmol/L | 1.57 (1.14–2.18) | 1.66 (1.20–2.28) | 1.49 (1.08–2.07) | 1.50 (1.08–2.10) | 1.56 (1.13–2.18) | <0.001 |
|
|
||||||
| LDL-C, mmol/L | 3.52±0.81 | 3.49±0.82 | 3.51±0.79 | 3.54±0.79 | 3.57±0.83 | <0.001 |
|
|
||||||
| HDL-C, mmol/L | 1.26±0.29 | 1.26±0.29 | 1.28±0.28 | 1.27±0.28 | 1.23±0.28 | <0.001 |
|
|
||||||
| hs-CRP, mmol/L | 0.07 (0.04–0.13) | 0.07 (0.04–0.13) | 0.06 (0.04–0.12) | 0.07 (0.04–0.12) | 0.08 (0.04–0.15) | <0.001 |
|
|
||||||
| Current alcohol useb | 8,219 (52.2) | 3,167 (52.7) | 1,808 (51.4) | 1,326 (51.2) | 1,918 (53.0) | 0.370 |
| Male | 6,823 (50.4) | 2,618 (50.9) | 1,537 (49.8) | 1,104 (49.2) | 1,564 (51.0) | 0.463 |
| Female | 1,396 (63.5) | 549 (63.1) | 271 (63.4) | 222 (63.9) | 354 (64.0) | 0.985 |
|
|
||||||
| Smoking status | <0.001 | |||||
| Never smoker | 3,839 (24.4) | 1,490 (24.7) | 838 (23.8) | 619 (23.9) | 892 (24.6) | |
| Ex-smoker | 5,810 (36.9) | 2,329 (38.7) | 1,341 (38.1) | 919 (35.5) | 1,221 (33.7) | |
| Current smoker | 5,189 (32.9) | 1,857 (30.9) | 1,135 (32.3) | 903 (34.9) | 1,294 (35.7) | |
|
|
||||||
| Regular exercise | 0.231 | |||||
| ≥3 times/week | 1,783 (11.3) | 660 (10.9) | 434 (12.3) | 309 (11.9) | 380 (10.5) | |
| <3 times/week | 13,541 (86.0) | 5,192 (86.3) | 2,990 (85.1) | 2,215 (85.6) | 3,144 (86.8) | |
|
|
||||||
| NFS | −2.74±1.00 | −2.63±1.02 | −2.77±0.99 | −2.84±0.98 | −2.83±0.99 | <0.001 |
|
|
||||||
| APRI | 0.24 (0.19–0.31) | 0.24 (0.19–0.31) | 0.23 (0.19–0.30) | 0.24 (0.19–0.30) | 0.26 (0.20–0.34) | <0.001 |
|
|
||||||
| HOMA-IR | 1.72 (1.19–2.43) | 2.15 (1.57–2.94) | 1.44 (1.02–1.98) | 1.41 (0.98–1.95) | 1.64 (1.12–2.30) | <0.001 |
HOMA-IR, homeostatic model assessment of insulin resistance; BMI, body mass index; SBP, systolic blood pressure; AST, aspartate aminotransferase; ALT, alanine aminotransferase; LDL-C, low-density lipoprotein cholesterol; HDL-C, high-density lipoprotein cholesterol; hs-CRP, high-sensitivity C-reactive protein; NFS, nonalcoholic fatty liver disease (NAFLD) fibrosis score; APRI, aspartate aminotransferase to platelet ratio index.
Relationship between the degree of change in HOMA-IR and the change in fibrosis probability
Fig. 2

Table 2
| HOMA-IR change | Case (%) | Multivariate-adjusted OR (95% CI) | ||||
|---|---|---|---|---|---|---|
|
|
||||||
| Model 1 | Model 2 | Model 3 | Model 4 | Model 5 | ||
| Progression (NFSa) | ||||||
| G1 (<0) | 254 (4.2) | 1 (reference) | 1 (reference) | 1 (reference) | 1 (reference) | 1 (reference) |
| G2 (0–0.50) | 187 (5.3) | 1.23 (1.01–1.49) | 1.24 (1.02–1.5) | 1.31 (1.05–1.63) | 1.31 (1.05–1.63) | 1.33 (1.07–1.65) |
| G3 (0.51–1.00) | 156 (6.0) | 1.39 (1.13–1.71) | 1.39 (1.13–1.71) | 1.45 (1.15–1.82) | 1.44 (1.15–1.82) | 1.46 (1.16–1.83) |
| G4 (>1.00) | 352 (9.7) | 2.34 (1.98–2.76) | 2.31 (1.96–2.74) | 2.26 (1.87–2.72) | 2.23 (1.85–2.69) | 2.25 (1.87–2.71) |
| P for trend | <0.001 | <0.001 | <0.001 | <0.001 | <0.001 | |
|
|
||||||
| Regression (NFSa) | ||||||
| G1 (<0) | 409 (6.8) | 1 (reference) | 1 (reference) | 1 (reference) | 1 (reference) | 1 (reference) |
| G2 (0–0.50) | 146 (4.2) | 0.60 (0.49–0.73) | 0.60 (0.5–0.73) | 0.52 (0.41–0.65) | 0.52 (0.41–0.65) | 0.53 (0.42–0.67) |
| G3 (0.51–1.00) | 80 (3.1) | 0.44 (0.35–0.57) | 0.45 (0.35–0.58) | 0.43 (0.33–0.57) | 0.43 (0.33–0.57) | 0.44 (0.33–0.58) |
| G4 (>1.00) | 85 (2.4) | 0.35 (0.28–0.44) | 0.35 (0.27–0.44) | 0.33 (0.26–0.43) | 0.33 (0.25–0.43) | 0.33 (0.25–0.43) |
| P for trend | <0.001 | <0.001 | <0.001 | <0.001 | <0.001 | |
|
|
||||||
| Progression (APRI) | ||||||
| G1 (<0) | 194 (3.2) | 1 (reference) | 1 (reference) | 1 (reference) | 1 (reference) | 1 (reference) |
| G2 (0–0.50) | 103 (2.9) | 0.80 (0.62–1.02) | 0.92 (0.72–1.17) | 0.99 (0.76–1.29) | 0.97 (0.75–1.27) | 1.14 (0.87–1.50) |
| G3 (0.51–1.00) | 103 (4.0) | 0.67 (0.50–0.90) | 1.24 (0.97–1.58) | 1.29 (0.99–1.68) | 1.26 (0.97–1.65) | 1.50 (1.14–1.98) |
| G4 (>1.00) | 269 (7.4) | 1.36 (1.10–1.69) | 2.39 (1.97–2.89) | 2.31 (1.88–2.84) | 2.08 (1.69–2.57) | 2.55 (2.05–3.18) |
| P for trend | <0.001 | <0.001 | <0.001 | <0.001 | <0.001 | |
|
|
||||||
| Regression (APRI) | ||||||
| G1 (<0) | 201 (3.3) | 1 (reference) | 1 (reference) | 1 (reference) | 1 (reference) | 1 (reference) |
| G2 (0–0.50) | 95 (2.7) | 0.90 (0.71–1.15) | 0.82 (0.64–1.06) | 0.92 (0.70–1.20) | 0.91 (0.69–1.19) | 1.04 (0.79–1.37) |
| G3 (0.51–1.00) | 59 (2.3) | 1.23 (0.96–1.57) | 0.69 (0.51–0.93) | 0.78 (0.57–1.07) | 0.77 (0.57–1.05) | 0.92 (0.67–1.26) |
| G4 (>1.00) | 160 (4.4) | 2.42 (2.00–2.93) | 1.34 (1.09–1.66) | 1.23 (0.98–1.54) | 1.14 (0.91–1.14) | 1.39 (1.10–1.77) |
| P for trend | 0.016 | 0.019 | 0.104 | 0.411 | 0.022 | |
Model 1, adjusted for age, sex, and center (Seoul or Suwon); Model 2, additionally adjusted for systolic blood pressure, regular exercise, current alcohol consumption, and smoking status; Model 3, additionally adjusted for body mass index (BMI), waist circumference, and hemoglobin A1c, high-sensitivity C-reactive protein, low-density lipoprotein cholesterol, and triglyceride levels; Model 4, additionally adjusted for development of new-onset diabetes; Model 5, additionally adjusted for baseline HOMA-IR.
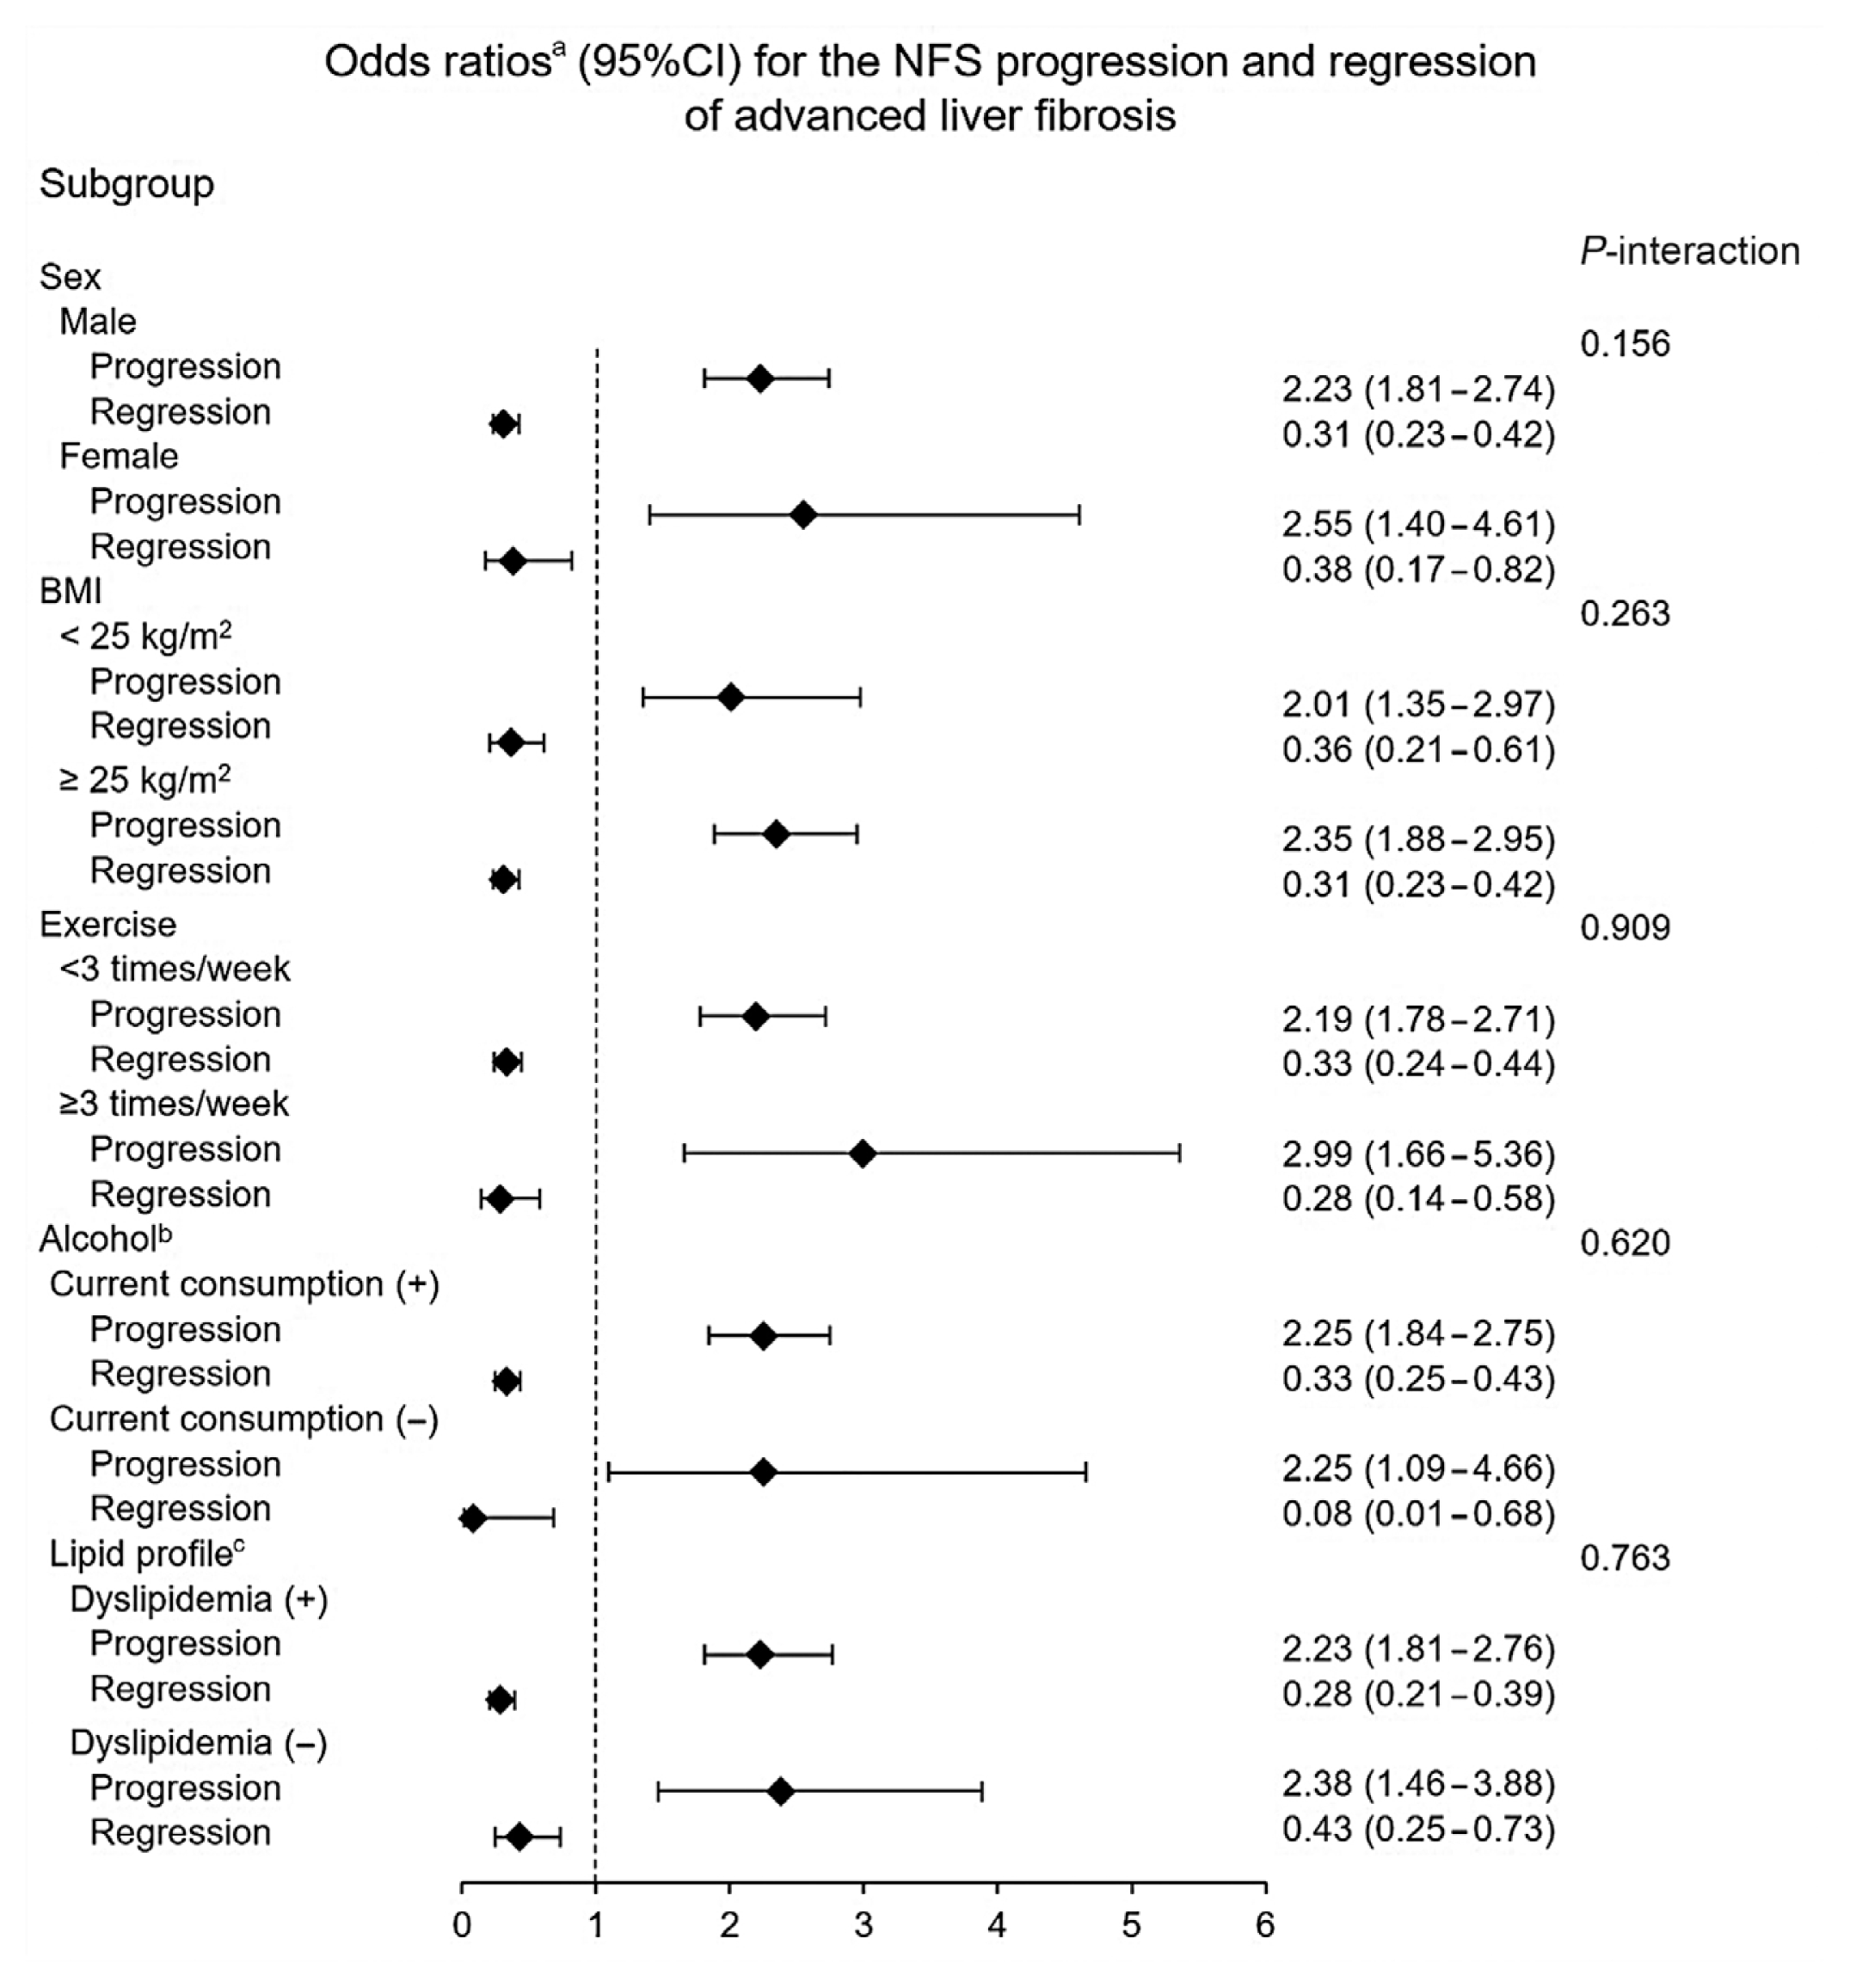
Subgroup analysis
Fig. 3

Comparison of changes in HOMA-IR and BMI values with respect to the prediction of change in fibrosis status
Table 3
| Standardized quartilea | Multivariate-adjusted OR (95% CI) | |||
|---|---|---|---|---|
|
|
||||
| NFSb | APRIc | |||
|
|
|
|||
| HOMA-IR change | BMI change | HOMA-IR change | BMI change | |
| Progression | ||||
| Q1 | 1 (reference) | 1 (reference) | 1 (reference) | 1 (reference) |
| Q2 | 1.16 (0.84–1.60) | 1.21 (0.93–1.56) | 1.58 (1.09–2.29) | 1.51 (0.99–2.31) |
| Q3 | 1.64 (1.19–2.28) | 1.28 (0.99–1.65) | 2.32 (1.58–3.39) | 2.78 (1.86–4.16) |
| Q4 | 2.76 (1.96–3.88) | 1.56 (1.17–2.09) | 4.24 (2.86–6.29) | 8.01 (5.32–12.04) |
| P for trend | <0.001 | 0.003 | <0.001 | <0.001 |
| Per 1 SD increase | 1.33 (1.25–1.42) | 1.16 (1.07–1.24) | 1.38 (1.29–1.48) | 2.08 (1.90–2.28) |
|
|
||||
| Regression | ||||
| Q1 | 1 (reference) | 1 (reference) | 1 (reference) | 1 (reference) |
| Q2 | 0.88 (0.66–1.16) | 0.9 (0.70–1.16) | 0.93 (0.67–1.28) | 0.78 (0.60–1.01) |
| Q3 | 0.42 (0.30–0.57) | 0.68 (0.52–0.87) | 1.001 (0.71–1.41) | 0.56 (0.43–0.73) |
| Q4 | 0.31 (0.20–0.48) | 0.52 (0.36–0.74) | 1.43 (0.99–2.07) | 0.41 (0.28–0.61) |
| P for trend | <0.001 | <0.001 | 0.027 | <0.001 |
| Per 1 SD increase | 0.66 (0.59–0.74) | 0.85 (0.78–0.92) | 1.10 (1.02–1.18) | 0.83 (0.76–0.90) |
| AIC | 10,248.33 | 10,368.57 | 8,333.05 | 8,149.91 |
HOMA-IR, homeostatic model assessment of insulin resistance; BMI, body mass index; NAFLD, nonalcoholic fatty liver disease; OR, odds ratio; CI, confidence interval; NFS, NAFLD fibrosis score; APRI, aspartate aminotransferase to platelet ratio index; SD, standard deviation; AIC, Akaike information criterion.
a Standardized quartile range of HOMA-IR change: Q1, −18.71 to −1.00 (n=1,523); Q2, −1.00 to 0.36 (n=7,046); Q3, 0.36 to 1.72 (n=5,525); Q4, 1.72 to 14.16 (n=1,634). Standardized quartile range of BMI change: Q1, −8.72 to −0.95 (n=1,916); Q2, −0.95 to −0.36 (n=5,636); Q3, 0.36 to 1.66 (n=6,236); Q4, 1.67 to 9.56 (n=1,940);
b Adjused for sex, center (Seoul or Suwon), systolic blood pressure (SBP), regular exercise, current alcohol consumption, smoking status, waist circumference, HOMA-IR, hemoglobin A1c (HbA1c), high-sensitivity C-reactive protein (hs-CRP), low-density lipoprotein cholesterol (LDL-C), triglyceride, and new-onset diabetes;


 PDF
PDF Citation
 Print
Print


 XML Download