INTRODUCTION
METHODS
Study design and participants
Table 1
| Characteristic | Non-DM (n=802) | DM (n=217) | P value |
|---|---|---|---|
| Age, yr | 56.4±18.0 | 68.7±11.2 | <0.01 |
| Male sex | 257 (32.0) | 95 (43.8) | <0.01 |
| FIB-4 index | 1.95±2.19 | 2.93±3.76 | <0.01 |
| High FIB-4 index | 181 (22.6) | 88 (40.6) | <0.01 |
| Co-morbidity | |||
| Hypertension | 220 (27.4) | 136 (62.7) | <0.01 |
| Heart disease | 47 (5.9) | 27 (11.1) | <0.01 |
| Cerebro-vascular disease | 40 (5.0) | 22 (10.2) | <0.01 |
| Chronic kidney disease | 14 (1.7) | 18 (8.3) | <0.01 |
| Chronic lung disease | 54 (6.7) | 16 (7.4) | 0.41 |
| Cancer | 42 (5.2) | 17 (7.8) | 0.10 |
| Laboratory findings on admission | |||
| HbA1c, % | 5.74±0.62 | 7.63±1.75 | <0.01 |
| Glucose, mg/dL | 109.1±29.7 | 184.7±103.1 | <0.01 |
| WBC, 103/μL | 5.52±2.35 | 6.90±3.68 | <0.01 |
| Hb, g/dL | 12.7±1.60 | 12.2±1.71 | <0.01 |
| PLT, 103/μL | 226.2±83.1 | 232.5±101.5 | 0.35 |
| CRP, mg/dL | 6.7±20.5 | 10.9±19.5 | <0.01 |
| Total protein, g/dL | 6.77±0.55 | 6.69±0.70 | 0.12 |
| Albumin, g/dL | 3.95±0.48 | 3.65±0.56 | <0.01 |
| eGFR, mL/min/1.73 m2 | 98.4±33.9 | 79.0±33.7 | <0.01 |
| AST, IU/L | 27.9±15.7 | 33.0±22.4 | <0.01 |
| ALT, IU/L | 23.0±13.7 | 23.3±13.7 | 0.79 |
| LDH, IU/L | 443.8±177.4 | 530.7±415.7 | <0.01 |
| Treatment | |||
| ICU | 62 (7.7) | 50 (23.0) | <0.01 |
| High flow O2 | 45 (5.6) | 30 (13.8) | <0.01 |
| Ventilator | 31 (3.9) | 31 (14.3) | <0.01 |
| CRRT | 5 (0.6) | 13 (6.0) | <0.01 |
| ECMO | 4 (0.5) | 8 (3.7) | <0.01 |
| Duration | |||
| Confirmation-releasea, day | 29.3±13.5 | 32.5±14.0 | <0.01 |
| Hospital lengtha, day | 24.5±13.3 | 28.7±14.6 | <0.01 |
| Outcome | |||
| Release | 726 (90.5) | 170 (78.3) | <0.01 |
| Severe clinical course | 80 (10.0) | 57 (26.3) | <0.01 |
| Death | 32 (4.0) | 39 (18.0) | <0.01 |
Values are expressed as mean±standard deviation or number (%). All P values were calculated using the Student’s t test or the chi-square test.
COVID-19, coronavirus disease 2019; DM, diabetes mellitus; FIB-4, fibrosis-4; HbA1c, hemoglobin A1c; WBC, white blood cell; Hb, hemoglobin; PLT, platelet; CRP, C-reactive protein; eGFR, estimated glomerular filtration rate; AST, aspartate aminotransferase; ALT, alanine aminotransferase; LDH, lactate dehydrogenase; ICU, intensive care unit; CRRT, continuous renal replacement therapy; ECMO, extracorporeal membrane oxygenation.
Data collection and definitions
Quantification and statistical analysis
RESULTS
Baseline characteristics, including the FIB-4 index, according to the presence of DM
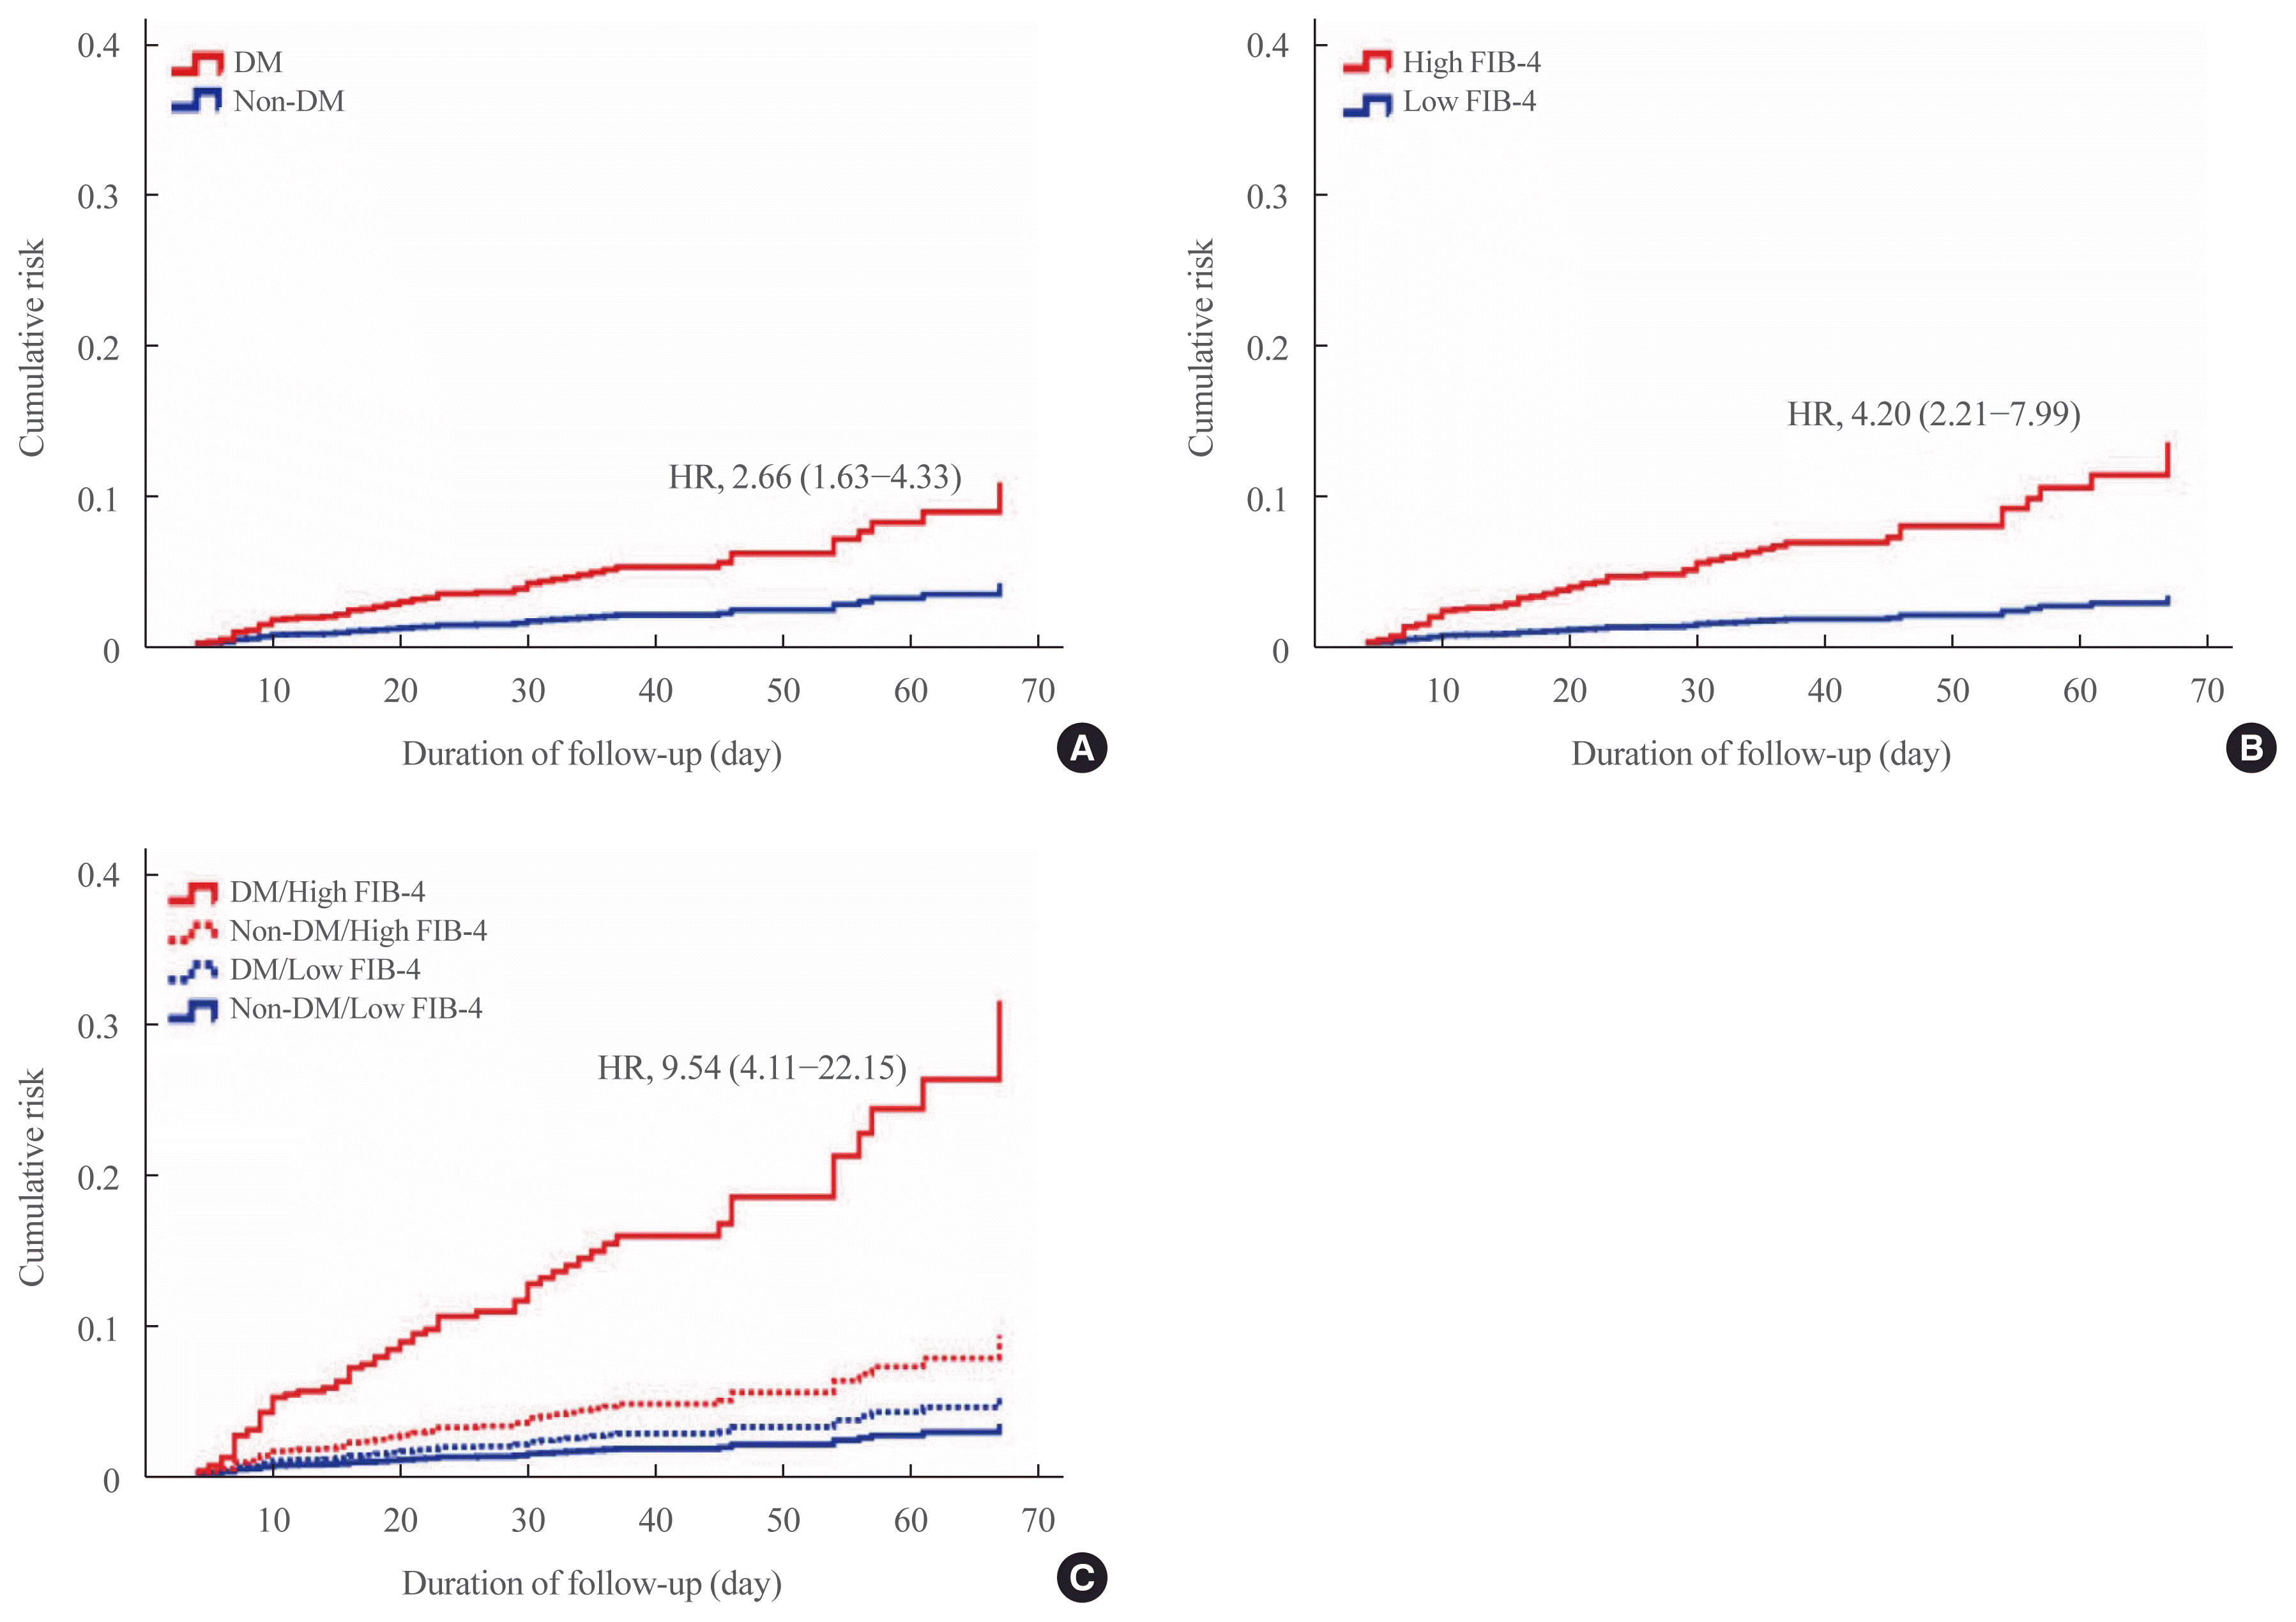
High FIB-4 index and presence of DM are predictors of severe clinical course and mortality in patients with COVID-19
 | Fig. 1Mortality of coronavirus disease 2019 (COVID-19) patients according to (A) diabetes mellitus (DM), (B) fibrosis-4 (FIB-4) index, and (C) diabetes mellitus (DM) and FIB-4 index. (A) Red line, patients with diabetes; blue line, patients without diabetes. (B) Red line, patients with high FIB-4 index; blue line, patients with low FIB-4 index. (C) Red solid line, patents with diabetes and high FIB-4 index; red dashed line, non-diabetes patients with high FIB-4 index; blue solid line, patents with diabetes and low FIB-4 index; blue dashed line, non-diabetes patients with low FIB-4 index. Data were analyzed using Cox proportional hazards model and all data are expressed as hazard ratio (HR) (95% confidence interval). Model was adjusted for age, sex, and underlying diseases. |
Table 2
| Variable |
Univariate model |
Multivariate model |
||
|---|---|---|---|---|
| Severe clinical course | Death | Severe clinical course | Death | |
| Age | 1.06 (1.05–1.08)a | 1.09 (1.07–1.12)a | 1.04 (1.02–1.06)a | 1.09 (1.06–1.12)a |
| Gender | 2.38 (1.66–3.43)a | 3.61 (2.19–5.97)a | 1.90 (1.25–2.89)a | 3.82 (2.08–7.00)a |
| Hypertension | 3.19 (2.21–4.62)a | 2.58 (1.58–4.20)a | 1.64 (1.05–2.58)b | 0.97 (0.52–1.80) |
| Heart disease | 1.65 (0.89–3.05) | 1.51 (0.67–3.43) | 0.64 (0.31–1.31) | 0.50 (0.19–1.30) |
| Cerebrovascular disease | 1.42 (0.72–2.79) | 1.47 (0.61–3.53) | 0.61 (0.28–1.33) | 0.61 (0.22–1.69) |
| Chronic kidney disease | 4.76 (2.29–9.88)a | 4.89 (2.11–11.32)a | 2.67 (1.17–6.12)b | 3.16 (1.14–8.75)b |
| Chronic lung disease | 1.52 (0.81–2.85) | 3.12 (1.59–6.13)a | 1.32 (0.64–2.71) | 3.00 (1.30–6.94)b |
| Cancer | 2.83 (1.56–5.14)a | 3.01 (1.45–6.23)a | 2.05 (1.03–4.11)b | 1.94 (0.79–4.79) |
| DM | 3.22 (2.20–4.70)a | 5.27 (3.21–8.65)a | 1.69 (1.08–2.64)b | 3.33 (1.83–6.05)a |
| FIB-4 index | 1.55 (1.41–1.70)a | 1.43 (1.30–1.57)a | 1.35 (1.23–1.48)a | 1.29 (1.18–1.41)a |
Data were analyzed using multivariate logistic regression and values are expressed as odds ratio (95% confidence interval). Model was adjusted for age, sex, and underlying diseases. Severe clinical course defined as necessity for the use of a high-flow nasal cannula, mechanical ventilation, continuous renal replacement therapy, or extracorporeal membrane oxygenation or admission to an intensive care unit.
Table 3
| Characteristic |
Low FIB-4 index |
High FIB-4 index |
P value | ||
|---|---|---|---|---|---|
| Non-DM (n=621) | DM (n=129) | Non-DM (n=181) | DM (n=88) | ||
| Age, yr | 51.2±16.3 | 64.6±10.8 | 74.2±10.6 | 74.8±8.8 | <0.01 |
| Male sex | 178 (28.7) | 61 (47.3) | 79 (43.6) | 34 (38.6) | <0.01 |
| FIB-4 index | 1.22±0.63 | 1.41±0.65 | 4.44±3.45 | 5.15±5.11 | <0.01 |
| Co-morbidity | |||||
| Hypertension | 138 (22.2) | 69 (53.5) | 82 (45.3) | 67 (76.1) | <0.01 |
| Heart disease | 17 (2.7) | 16 (12.4) | 30 (16.6) | 8 (9.1) | <0.01 |
| Cerebro-vascular disease | 17 (2.7) | 15 (11.7) | 23 (12.8) | 7 (8.0) | <0.01 |
| Chronic kidney disease | 6 (1.0) | 11 (8.5) | 8 (4.4) | 7 (8.0) | <0.01 |
| Chronic lung disease | 38 (6.1) | 6 (4.7) | 16 (8.8) | 10 (11.4) | 0.08 |
| Cancer | 27 (4.3) | 9 (7.0) | 15 (8.3) | 8 (9.1) | 0.01 |
| Laboratory findings on admission | |||||
| HbA1c, % | 5.68±0.48 | 7.72±1.94 | 5.81±0.77 | 7.51±1.47 | <0.01 |
| Glucose, mg/dL | 107.2±29.1 | 186.3±105.4 | 116.2±30.9 | 182.4±100.1 | <0.01 |
| WBC, 103/μL | 5.25±1.95 | 6.97±3.60 | 6.02±3.34 | 6.79±3.80 | <0.01 |
| Hb, g/dL | 12.9±1.54 | 12.2±1.66 | 12.3±1.72 | 12.2±1.79 | <0.01 |
| PLT, 103/μL | 243.4±81.4 | 276.0±96.5 | 167.2±58.0 | 168.8±70.4 | 0.35 |
| CRP, mg/dL | 4.9±18.0 | 10.2±22.7 | 12.8±26.6 | 12.0±13.5 | <0.01 |
| Total protein, g/dL | 6.84±0.51 | 6.78±0.65 | 6.54±0.61 | 6.56±0.76 | <0.01 |
| Albumin, g/dL | 4.05±0.42 | 3.78±0.51 | 3.57±0.46 | 3.46±0.57 | <0.01 |
| eGFR, mL/min/1.73 m2 | 103.3±31.9 | 84.1±34.2 | 81.8±35.1 | 71.5±31.6 | <0.01 |
| AST, IU/L | 24.3±10.3 | 25.7±12.7 | 40.3±23.0 | 43.7±28.6 | <0.01 |
| ALT, IU/L | 22.9±13.3 | 23.2±12.9 | 23.4±15.0 | 23.4±14.7 | 0.96 |
| LDH, IU/L | 427.5±158.8 | 446.9±223.7 | 501.4±222.9 | 656.3±577.3 | <0.01 |
| Treatment | |||||
| ICU | 22 (3.5) | 16 (12.4) | 40 (22.1) | 34 (38.6) | <0.01 |
| High flow O2 | 11 (1.8) | 8 (6.2) | 34 (18.8) | 22 (25.0) | <0.01 |
| Ventilator | 9 (1.4) | 9 (7.0) | 22 (12.2) | 22 (25.0) | <0.01 |
| CRRT | 3 (0.5) | 3 (2.3) | 2 (1.1) | 10 (11.4) | <0.01 |
| ECMO | 2 (0.3) | 2 (1.6) | 2 (1.1) | 6 (6.8) | <0.01 |
| Duration | |||||
| Confirmation-releasea, day | 28.0±13.2 | 31.5±13.0 | 34.8±13.4 | 34.8±16.1 | <0.01 |
| Hospital lengtha, day | 23.0±12.7 | 26.8±12.5 | 30.9±13.4 | 33.0±17.9 | <0.01 |
| Outcome | |||||
| Release | 584 (94.0) | 118 (91.5) | 142 (78.5) | 52 (59.1) | <0.01 |
| Severe clinical course | 28 (4.5) | 18 (14.0) | 52 (28.7) | 39 (44.3) | <0.01 |
| Death | 8 (1.3) | 6 (4.7) | 24 (13.3) | 33 (37.5) | <0.01 |
Values are expressed as mean±standard deviation or number (%). All P values were calculated using the analysis of variance or the chi-square test.
FIB-4, fibrosis-4; DM, diabetes mellitus; HbA1c, hemoglobin A1c; WBC, white blood cell; Hb, hemoglobin; PLT, platelet; CRP, C-reactive protein; eGFR, estimated glomerular filtration rate; AST, aspartate aminotransferase; ALT, alanine aminotransferase; LDH, lactate dehydrogenase; ICU, intensive care unit; CRRT, continuous renal replacement therapy; ECMO, extracorporeal membrane oxygenation.
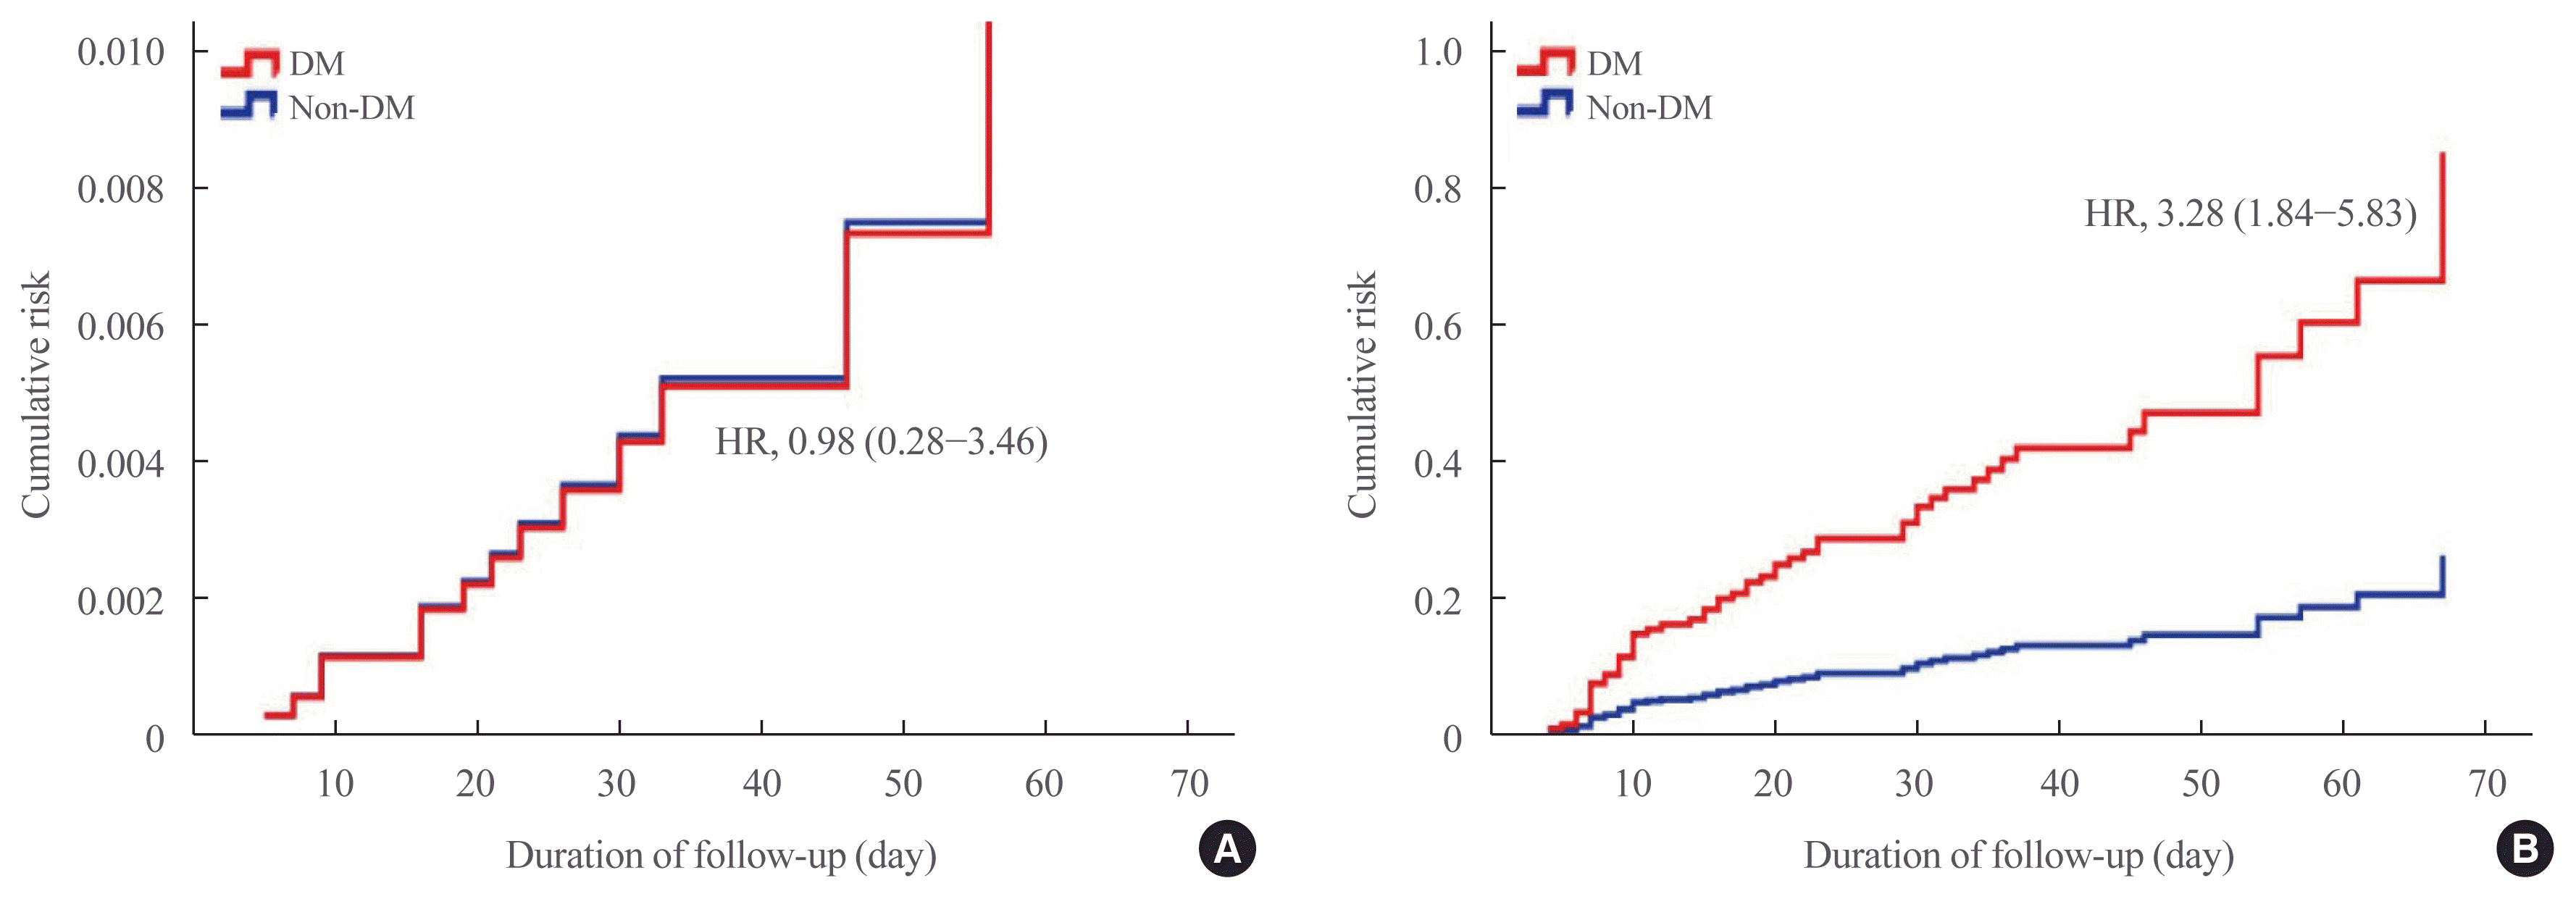
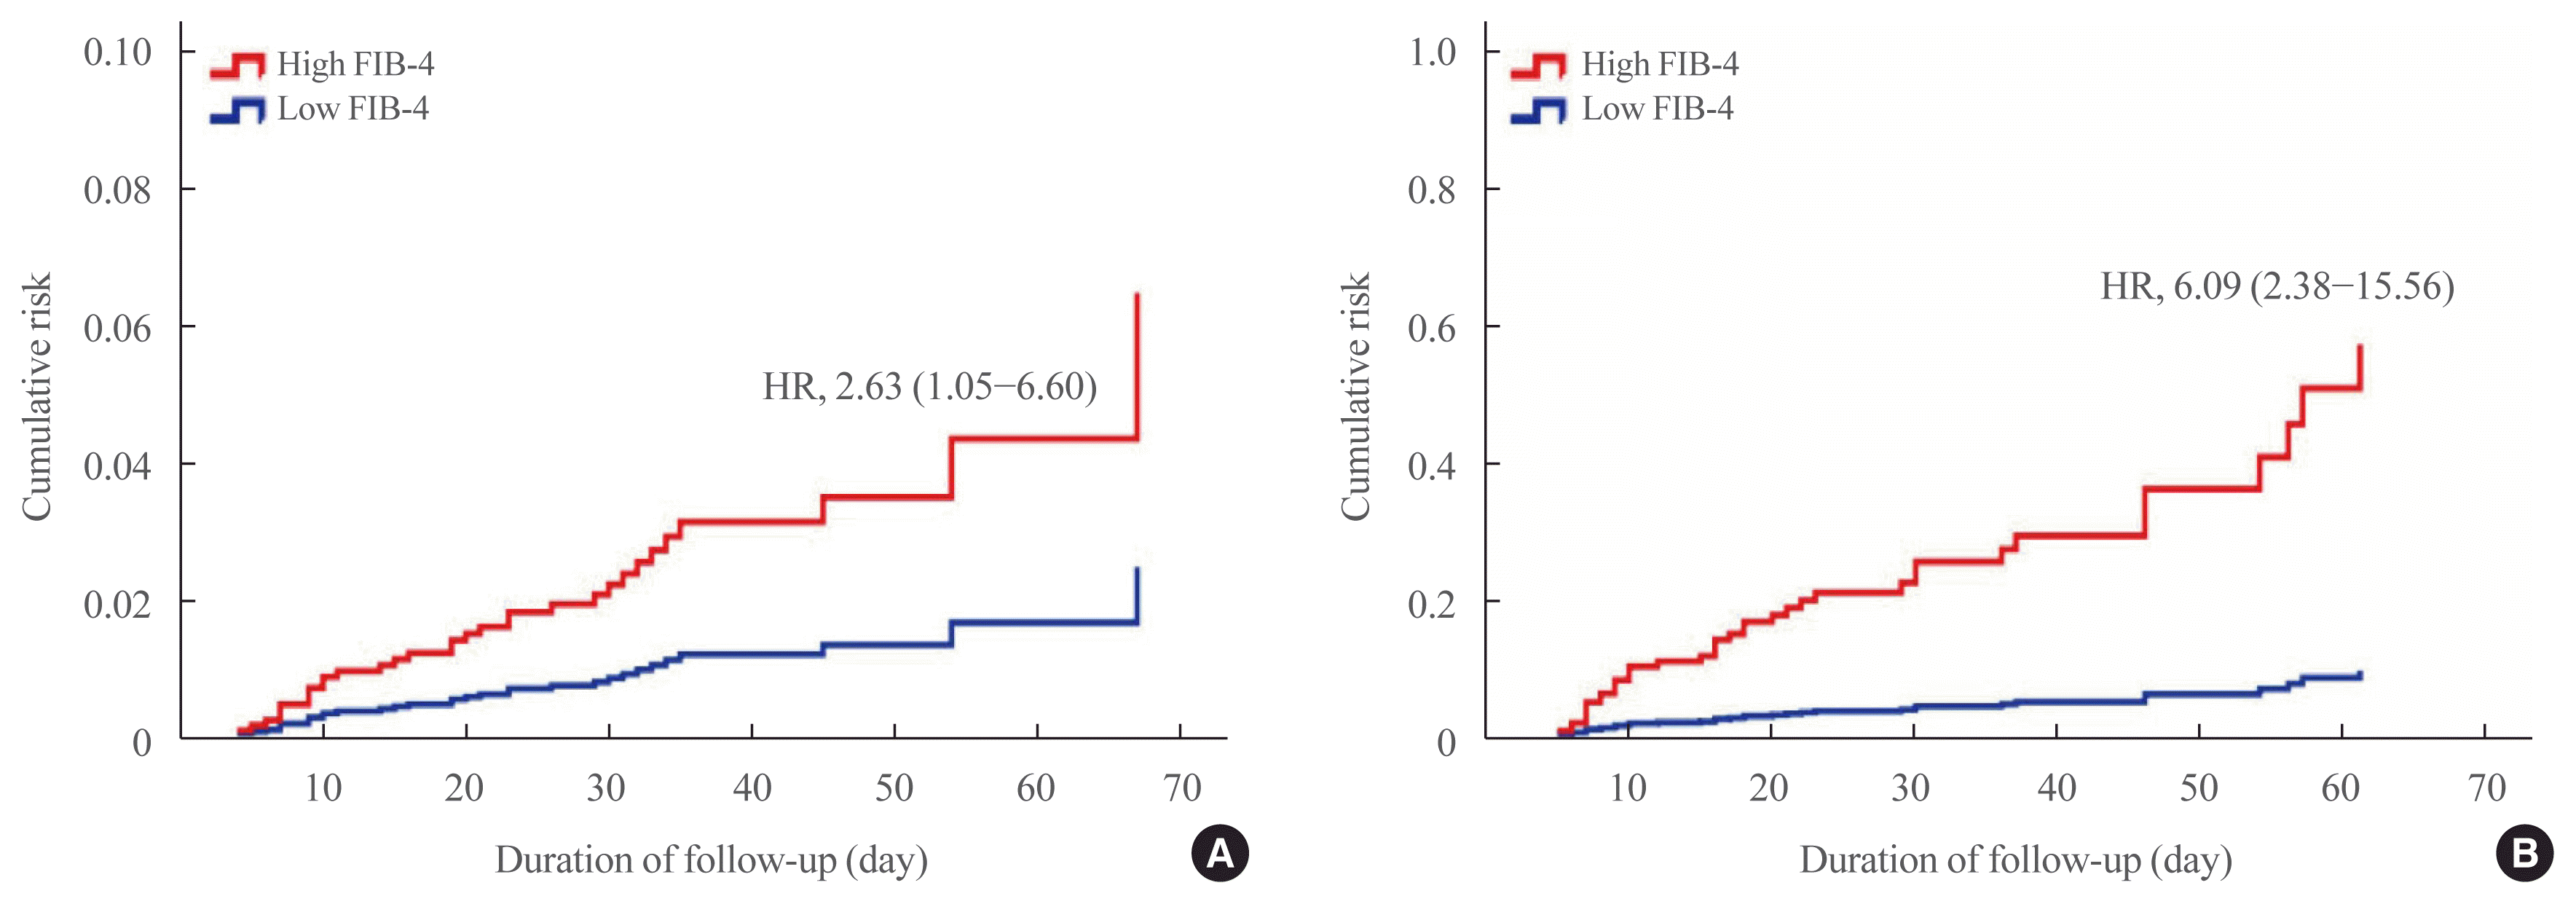
Synergistic contribution of a high FIB-4 index and the presence of DM as a predictor of COVID-19 mortality
 | Fig. 2Mortality of coronavirus disease 2019 (COVID-19) according to the presence of diabetes mellitus (DM) in patient (A) with low fibrosis-4 (FIB-4) index and (B) with high FIB-4 index. Red line, patients with diabetes; blue line, patients without diabetes. Data were analyzed using Cox proportional hazards model and all data are expressed as hazard ratio (HR) (95% confidence interval). Model was adjusted for age, sex, and underlying diseases. |
 | Fig. 3Mortality of coronavirus disease 2019 (COVID-19) according to fibrosis-4 (FIB-4) index in patient (A) without diabetes mellitus (DM) and (B) with DM. Red line, patients with high FIB-4 index; blue line, patients with low FIB-4 index. Data were analyzed using Cox proportional hazards model all data are expressed as hazard ratio (HR) (95% confidence interval). Model was adjusted for age, sex, and underlying diseases. |
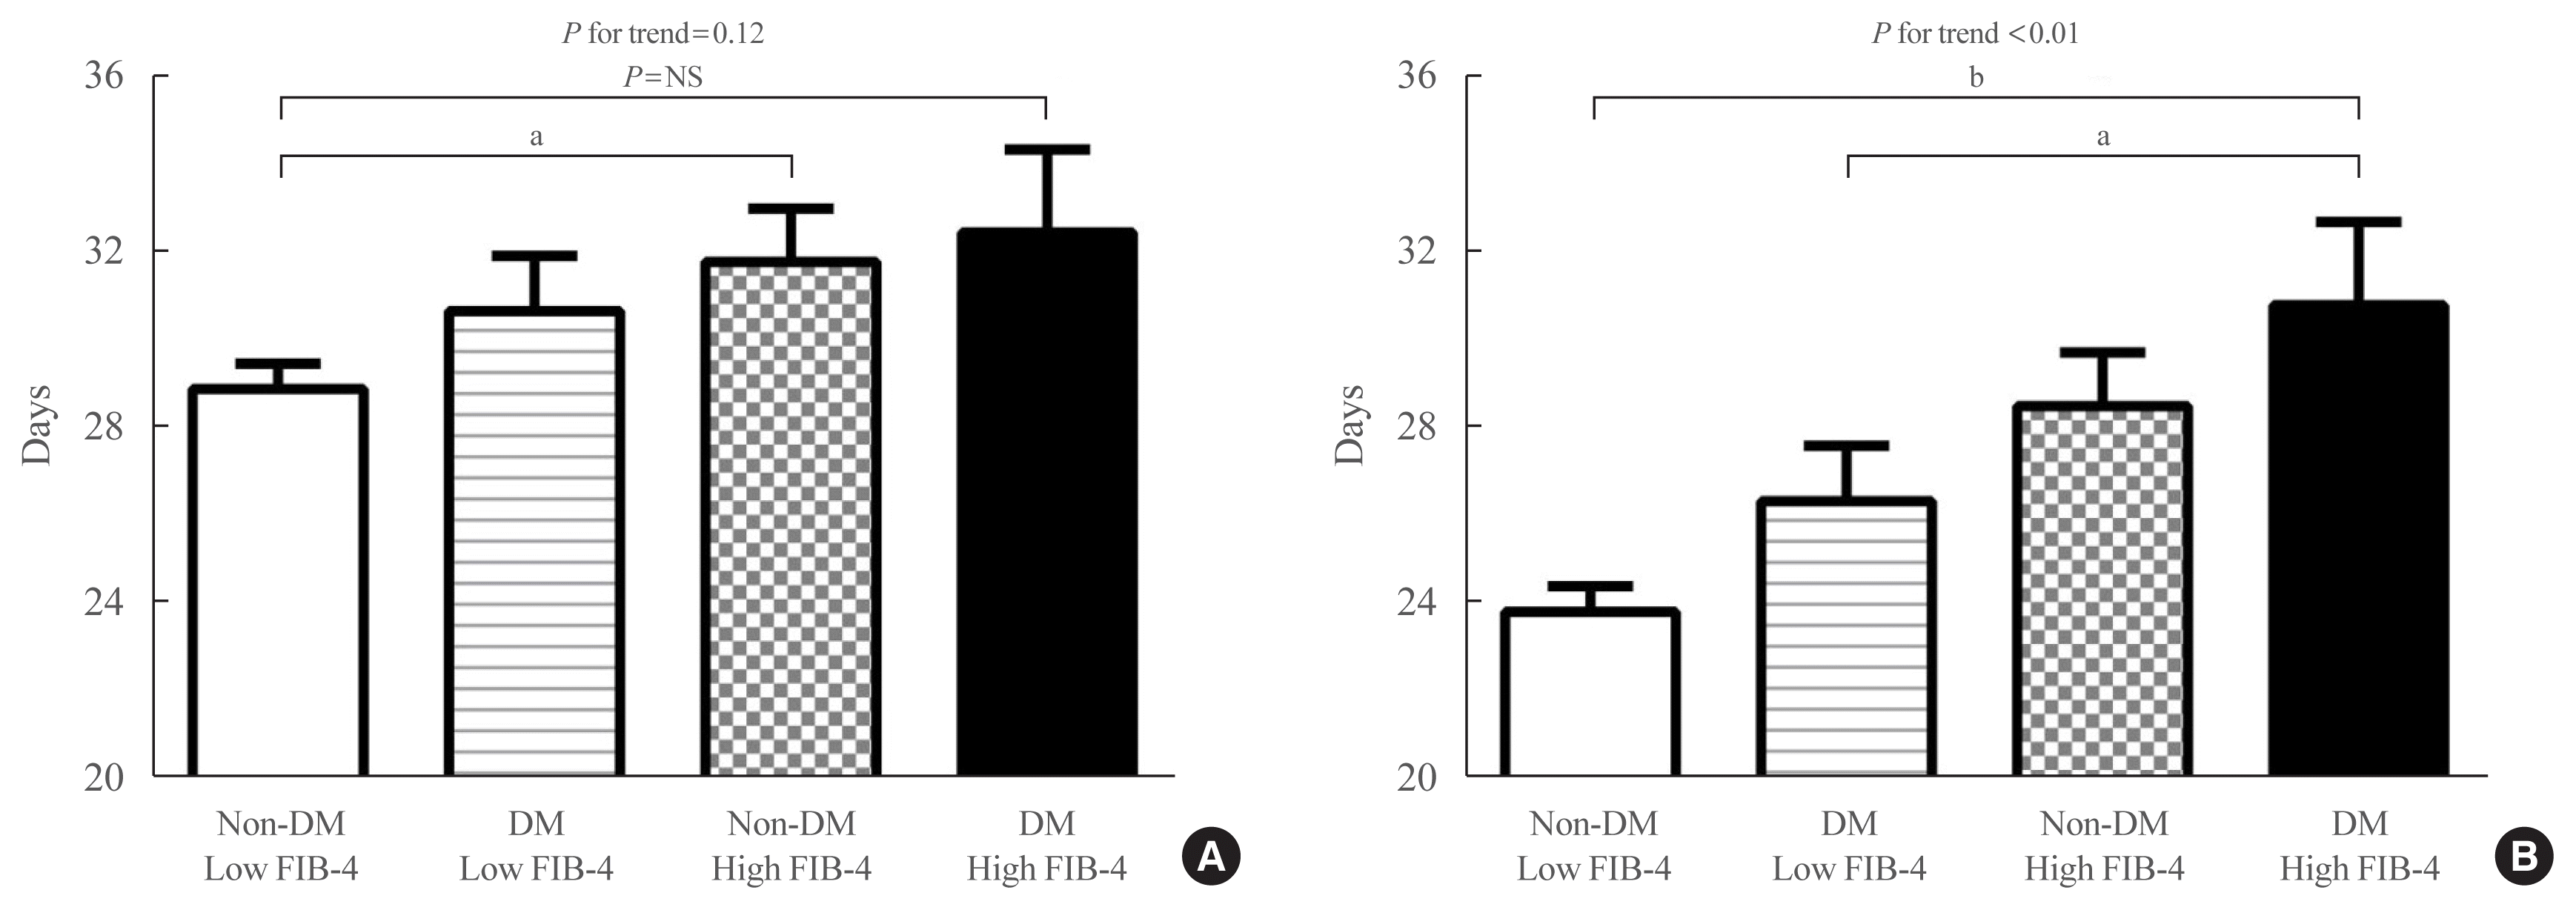
FIB-4 index and presence of DM affect the severity and clinical course in patients with COVID-19
 | Fig. 4Odds ratio (OR) of severe clinical course (A) and severe clinical course or death (B) according to patients group stratified according to the presence of diabetes mellitus (DM) or fibrosis-4 (FIB-4) index. Data were analyzed using multivariate logistic regression and all data are expressed as OR (95% confidence intervals). Model was adjusted for age, sex, and underlying diseases. HR, hazard ratio. |
 | Fig. 5The estimated mean of duration of confirmation to (A) release and (B) hospital length. Data were analyzed using general linear model and all data are expressed as the mean±standard error. Model was adjusted for age, sex, and underlying diseases. NS, not significant; DM, diabetes mellitus; FIB-4, fibrosis-4. aP<0.01; bP<0.05. |


 PDF
PDF Citation
 Print
Print


 XML Download