Journal List > Endocrinol Metab > v.36(3) > 1516079084

Bae, You, Cho, Kim, Shim, Park, and Cho: Association of Protein Z with Prediabetes and Type 2 Diabetes

Abstract

Background

Type 2 diabetes mellitus (T2DM) is a progressive metabolic disease. Early detection of prediabetes is important to reduce the risk of T2DM. Some cytokines are known to be associated with T2DM. Therefore, we aimed to identify cytokines as novel biomarkers of glucose dysmetabolism.

Methods

The first stage of the study included 43 subjects (13 subjects with newly diagnosed T2DM, 13 with prediabetes, and 16 with normoglycemia) for cytokine microarray analysis. Blood samples of the subjects were assessed for 310 cytokines to identify potential indicators of prediabetes. The second stage included 142 subjects (36 subjects with T2DM, 35 with prediabetes, and 71 with normoglycemia) to validate the potential cytokines associated with prediabetes.

Results

We identified 41 cytokines that differed by 1.5-fold or more in at least one out of the three comparisons (normoglycemia vs. prediabetes, normoglycemia vs. T2DM, and prediabetes vs. T2DM) among 310 cytokines. Finally, we selected protein Z (PROZ) and validated this finding to determine its association with prediabetes. Plasma PROZ levels were found to be decreased in patients with prediabetes (1,490.32±367.19 pg/mL) and T2DM (1,583.34±465.43 pg/mL) compared to those in subjects with normoglycemia (1,864.07±450.83 pg/mL) (P<0.001). There were significantly negative correlations between PROZ and fasting plasma glucose (P=0.001) and hemoglobin A1c (P=0.010).

Conclusion

PROZ levels were associated with prediabetes and T2DM. We suggest that PROZ may be a promising biomarker for the early detection of prediabetes. Further large-scale studies are needed to evaluate the relationship and mechanism between PROZ and prediabetes and T2DM.

INTRODUCTION

Prediabetes is an intermediate state in which plasma glucose levels are between those in normoglycemia and diabetes, and it is a high-risk precursor for type 2 diabetes mellitus (T2DM) [1]. Prediabetes includes the following conditions: impaired fasting glucose (IFG), impaired glucose tolerance (IGT), and hemoglobin A1c (HbA1c) levels between 5.7% and 6.4% according to the American Diabetes Association (ADA) [2]. Prediabetes and T2DM are an increasing trend worldwide. The number of adults suffering from IGT globally was 352 million in 2017, and this figure is expected to increase to 587 million by 2045 [3].
People with T2DM are at an increased risk of complications associated with diabetes, including macrovascular and microvascular diseases [4]. These complications threaten the health of patients with T2DM and seriously degrade their quality of life. Prediabetes is also associated with a higher risk of vascular complications than normoglycemia [5]. Mechanisms proposed for vascular complications in prediabetes are related to insulin resistance, inflammation, oxidative stress, and prothrombotic conditions [5]. Lifestyle modification relatively reduces the risk of diabetes by 40% to 70% in people with prediabetes [6]. Therefore, it is important to detect prediabetes at an early stage and stop the progression of prediabetes to diabetes using accurate diagnostic methods.
HbA1c is the most widely used marker for diagnosis of prediabetes along with fasting plasma glucose (FPG); however, it has some limitations. The sensitivity of HbA1c in people with prediabetes has been controversial [7,8], and it demonstrates inaccurate results in special conditions, such as anemia and chronic alcoholics [9]. FPG may differ in results due to dietary effects and duration of fasting. The oral glucose tolerance test conducted to diagnose IFG and IGT is not easy for patients in a clinical setting because this procedure is long and requires several blood tests.
There have been many attempts to find new diagnostic methods for prediabetes and T2DM. Previous studies have reported to evaluate the association between T2DM and cytokines [10]. Inflammatory cytokines are known to be associated with prediabetes and new-onset T2DM [11,12]. The use of cytokines as biomarkers may be a novel method to supplement traditional tests for diagnosing prediabetes and T2DM. However, there are no known cytokines that can be used to evaluate the status of prediabetes and T2DM in a clinical setting.
This study aimed to identify cytokines that could serve as potential biomarkers of glucose dysmetabolism. We explored cytokines associated with glycemic status and analyzed cytokine profiles in subjects with normoglycemia, prediabetes, and T2DM using cytokine microarray analysis. Finally, we selected and validated one cytokine, protein Z (PROZ), as a potential biomarker for prediabetes.

METHODS

Study cohorts for cytokine microarray analysis and validation

The study participants for cytokine microarray and validation were recruited between July 2014 and August 2019 from the Keimyung University Dongsan Hospital, Daegu, Korea. The study was approved by the Keimyung University Dongsan Hospital Institutional Review Board, with the protocol numbers being: 2013-09-003, 2015-03-010, 2016-03-028, 2016-05-018, and 2018-05-058. All subjects voluntarily provided informed consent. Subjects were divided into groups of normoglycemia, prediabetes, and T2DM according to the ADA guidelines [2].

Sample preparation for cytokine microarray analysis

Blood samples were obtained from each patient using ethylenediaminetetraacetic acid tubes (Becton Drive, Franklin Lakes, NJ, USA). Plasma was isolated after centrifuging whole blood at 3,000 ×g for 3 minutes and stored at −80°C for further analysis. Proteins were extracted from plasma using protein extraction buffer (Full Moon BioSystems, Sunnyvale, CA, USA). After extraction, the protein solution was purified using a gel matrix column that was included in the antibody array assay kit (Full Moon BioSystems). The column was vortex-mixed for 5 seconds and hydrated for 60 minutes at room temperature. Following centrifugation at 750 ×g for 2 minutes, the column was placed into a collecting tube, and 100 μL of the protein sample was added followed by the same centrifugation condition. The concentration of the purified sample was measured using a Pierce BCA protein assay kit (Thermo Fisher Scientific, Waltham, MA, USA) using a NanoPhotometer (Implen, Munich, Germany), and its purity was confirmed using UV spectroscopy.

Cytokine microarray analysis

Each protein sample of 50 μL was brought up to a volume of 75 μL using labeling buffer and treated with 3 μL of 10 μg/μL biotin/dimethylformamide solution. The samples were incubated for 90 minutes with gentle shaking. Samples were then treated with 35 μL of stop reagent and incubated for 30 minutes while gently shaking. The antibody microarray slide (Full Moon BioSystems) was incubated with 30 mL of blocking solution with shaking at 60 rpm for 30 minutes and washed with distilled water. This step was repeated thrice. After rinsing, each labeled sample was mixed with 6 mL of coupling solution. Then, the blocked array slide was incubated in a coupling dish with the coupling mixture on a shaker for 2 hours at 60 rpm. After coupling, the slide was soaked in 30 mL of washing solution in a Petri dish and washed six times on a shaker at 60 rpm for 5 minutes. The slides were rinsed with distilled water. The detection mixture was prepared by adding 30 μL of 0.5 mg/mL Cy3-streptavidin (GE Healthcare, Chalfont St. Giles, UK) to 30 mL of detection buffer. The coupled array slide was treated with the detection mixture in a Petri dish on a shaker at 60 rpm for 20 minutes. After this step, the slide was washed six times with 30 mL of washing solution with shaking at 60 rpm for 5 minutes. The slides were rinsed with distilled water. The whole experimental procedure was carried out at room temperature. All solutions used in this analysis without manufacturer specified were purchased from Full Moon BioSystems.

Cytokine microarray data acquisition and analysis

Slide scanning was performed using the GenePix 4100A scanner (Axon Instruments, Berkeley, CA, USA). The slides were fully dried and scanned within 24 to 48 hours at a resolution of 10 μm using optimal laser power and photomultiplier tube. The obtained the scans were gridded and quantified using the GenePix 7.0 software (Axon Instruments). The numerical data were analyzed using the Genowiz 4.0 software (Ocimum Biosolutions, Indianapolis, IN, USA). After analysis, the data on protein information were annotated using the UniProt database (www.uniprot.org).

Bioinformatics analysis of cytokine microarray data

Gene Ontology (GO) and Kyoto Encyclopedia of Genes and Genomes (KEGG) pathway analyses were performed using the Database for Annotation, Visualization and Integrated Discovery (DAVID) v6.8 [13,14]. Functional network analysis was conducted with cytokines that showed at least a 1.5-fold difference in patients with prediabetes compared to subjects with normoglycemia, using the Search Tool for the Retrieval of Interacting Genes/Proteins (STRING) database in Cytoscape [15], requiring a minimum confidence score of 0.4.

Enzyme-linked immunosorbent assay

The differential expression of cytokines in the plasma from patients with prediabetes and T2DM was confirmed using enzyme-linked immunosorbent assay (ELISA). PROZ levels were measured using the human PROZ Quantikine ELISA kit (MyBioSource, San Diego, CA, USA) according to the manufacturer’s protocol.

Statistical analysis

All statistical analyses were performed using the SPSS version 25.0 (IBM Co., Armonk, NY, USA). Cytokine microarray and ELISA data were expressed as mean±standard error of the mean obtained from two independent experiments. Statistically significant differences between groups were determined using the one-way analysis of variance (ANOVA) and Tukey’s post hoc test or two-tailed Student’s t test. Clinical parameters of the study groups were expressed as the mean±standard deviation and were analyzed using the chi-square test and one-way ANOVA. Correlations between PROZ and clinical parameters were analyzed using the Pearson correlation coefficient. A receiver operating characteristic (ROC) plot was drawn and area under the curve (AUC) was calculated using ‘pROC’ and ‘EPI’ packages of R version 4.0.3 (R Foundation for Statistical Computing, Vienna, Austria). Results were considered statistically significant at P<0.05.

RESULTS

Identification of cytokines for normoglycemia, prediabetes, and T2DM

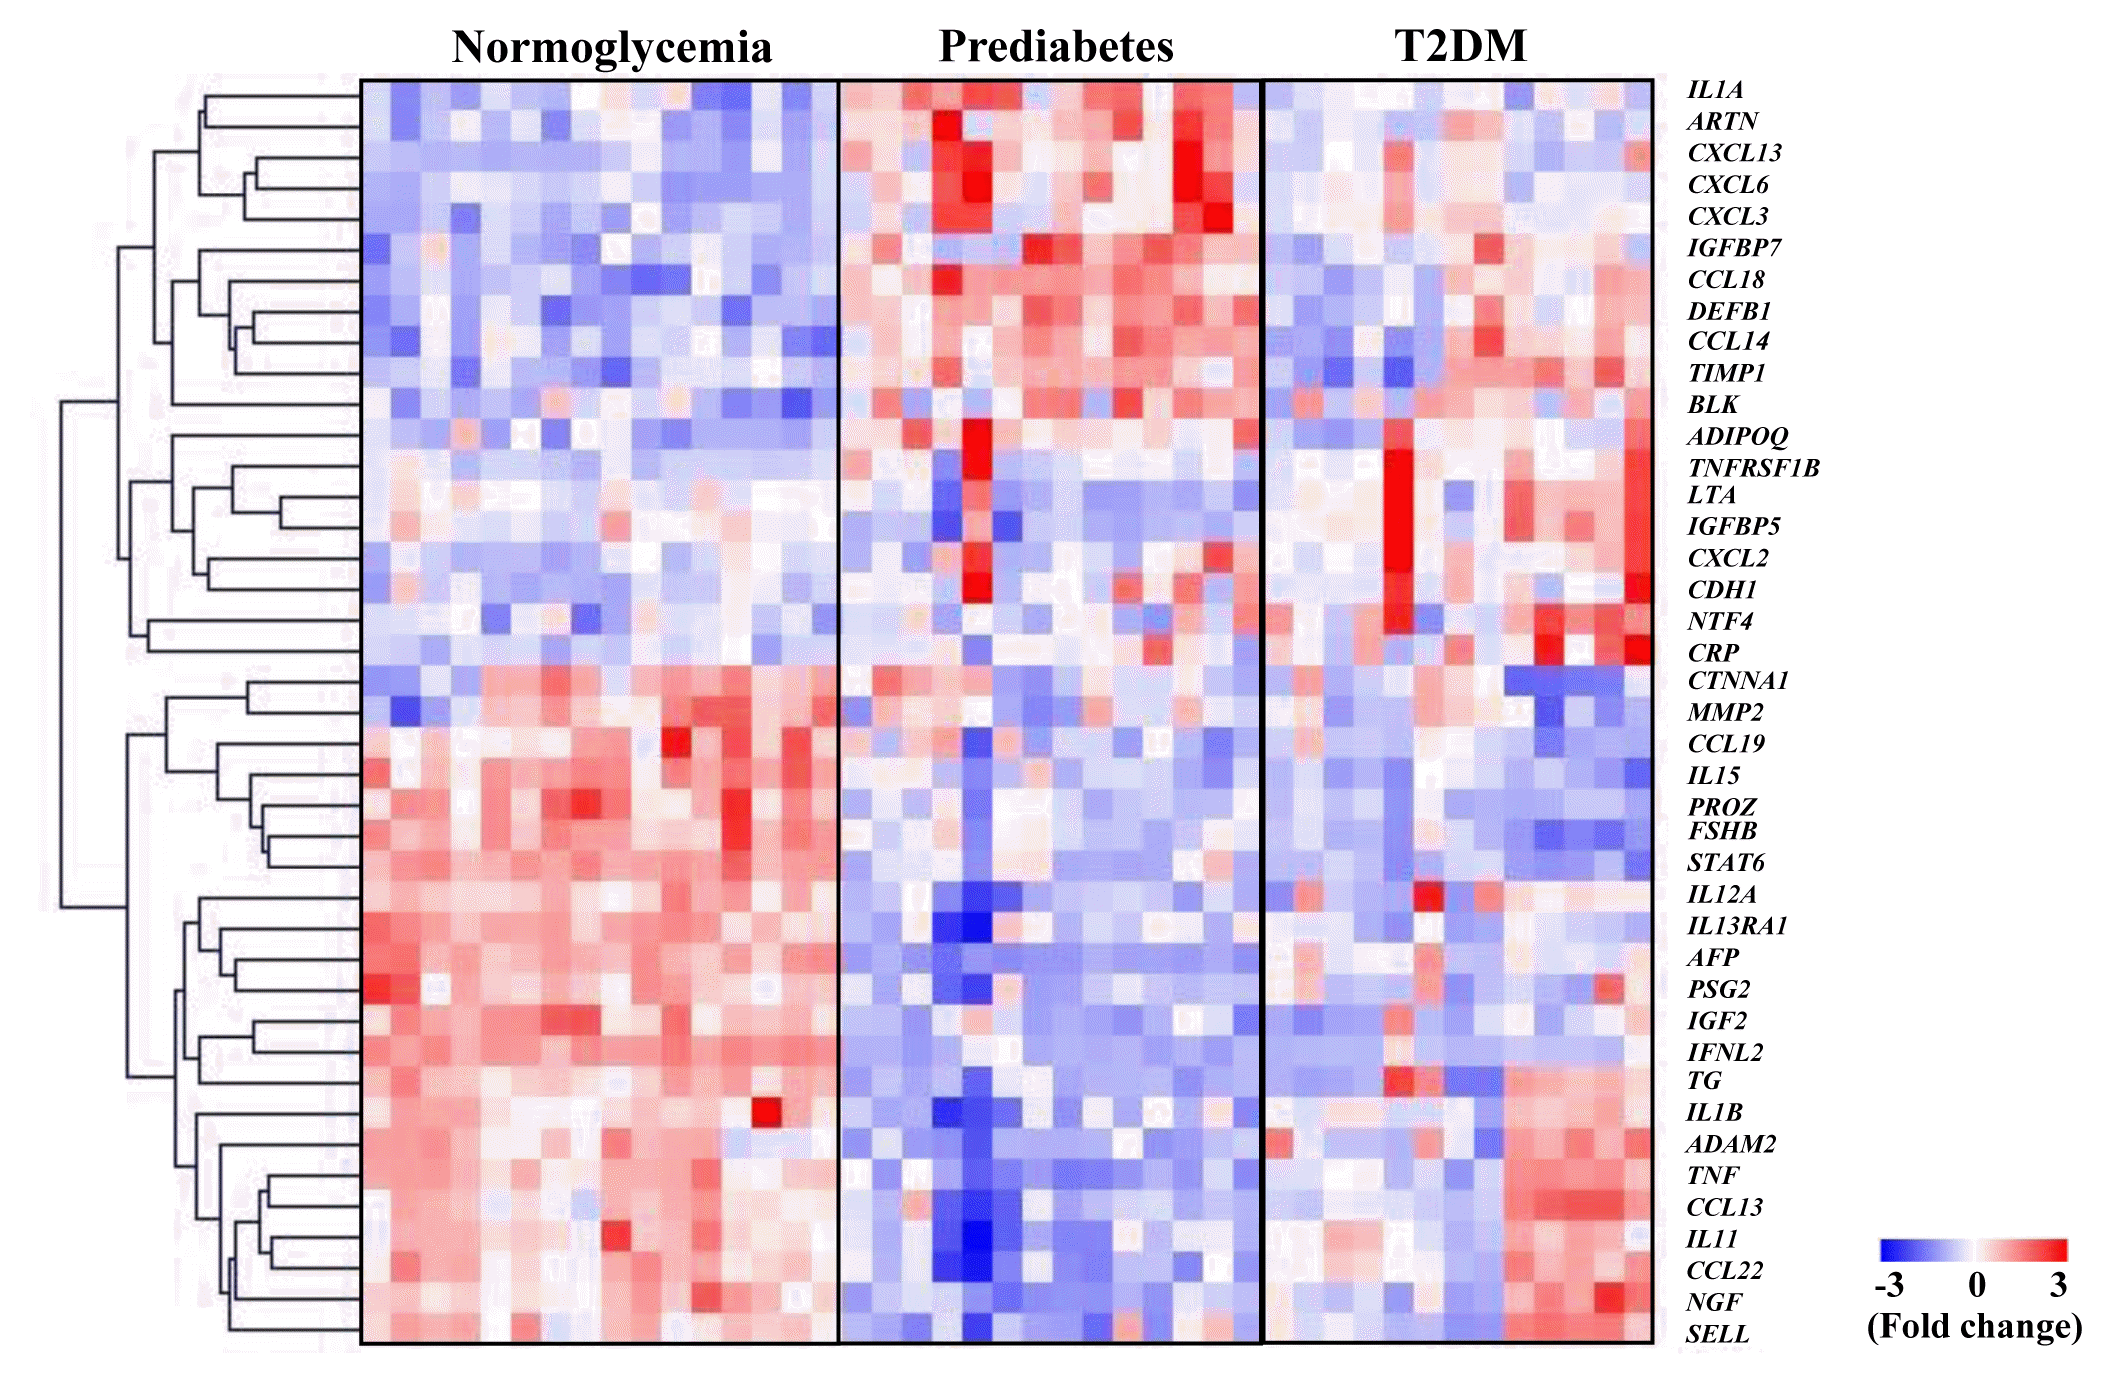
Supplemental Table S1 shows the baseline characteristics of subjects in the cytokine microarray analysis. There were no significant differences in clinical parameters among normoglycemia, prediabetes, and T2DM groups, except for those seen with FPG, HbA1c, homeostasis model assessment for insulin resistance (HOMA-IR), sex, age, and creatinine levels. To identify cytokines differentially secreted in subjects with prediabetes and T2DM compared to those with normoglycemia, we collected blood samples from each group and analyzed respective cytokine profiles using a cytokine microarray analysis. The expression patterns of the 41 cytokines that differed by 1.5-fold or more in at least one comparison between any two groups were shown in the heat map image (Fig. 1). We separately sorted out the numbers of up-regulated proteins and down-regulated proteins by comparison between groups using Venn diagram (Supplemental Fig. S1). We also plotted cytokines showing significant changes in subjects with normoglycemia, prediabetes, and T2DM using principal component analysis (PCA) analysis. PCA indicates that T2DM group seems to be scattered; however, it showed distinguishable pattern of separated three groups which are normoglycemia, prediabetes and T2DM (Supplemental Fig. S2). Table 1 displays the representative cytokines that showed at least a 2-fold difference in each comparison between the two groups. We identified carbohydrate antigen (CA) 15-3 and nerve growth factor (NGF)-β, whose expression levels were significantly decreased in the prediabetes group, but not in the T2DM group, when compared to the normoglycemia group. C-reactive protein (CRP) and B lymphoid kinase levels were significantly increased in both the prediabetes and T2DM groups compared with those in the normoglycemia group. In contrast, PROZ, interleukin (IL) 15, signal transducer and activator of transcription 6, insulin-like growth factor II, interferon-lambda 2, thyroglobulin, alpha-fetoprotein (AFP), and carcinoembryonic antigen (CEA) were significantly decreased in both the prediabetes and T2DM groups compared with those in the normoglycemia group.

Bioinformatic analysis

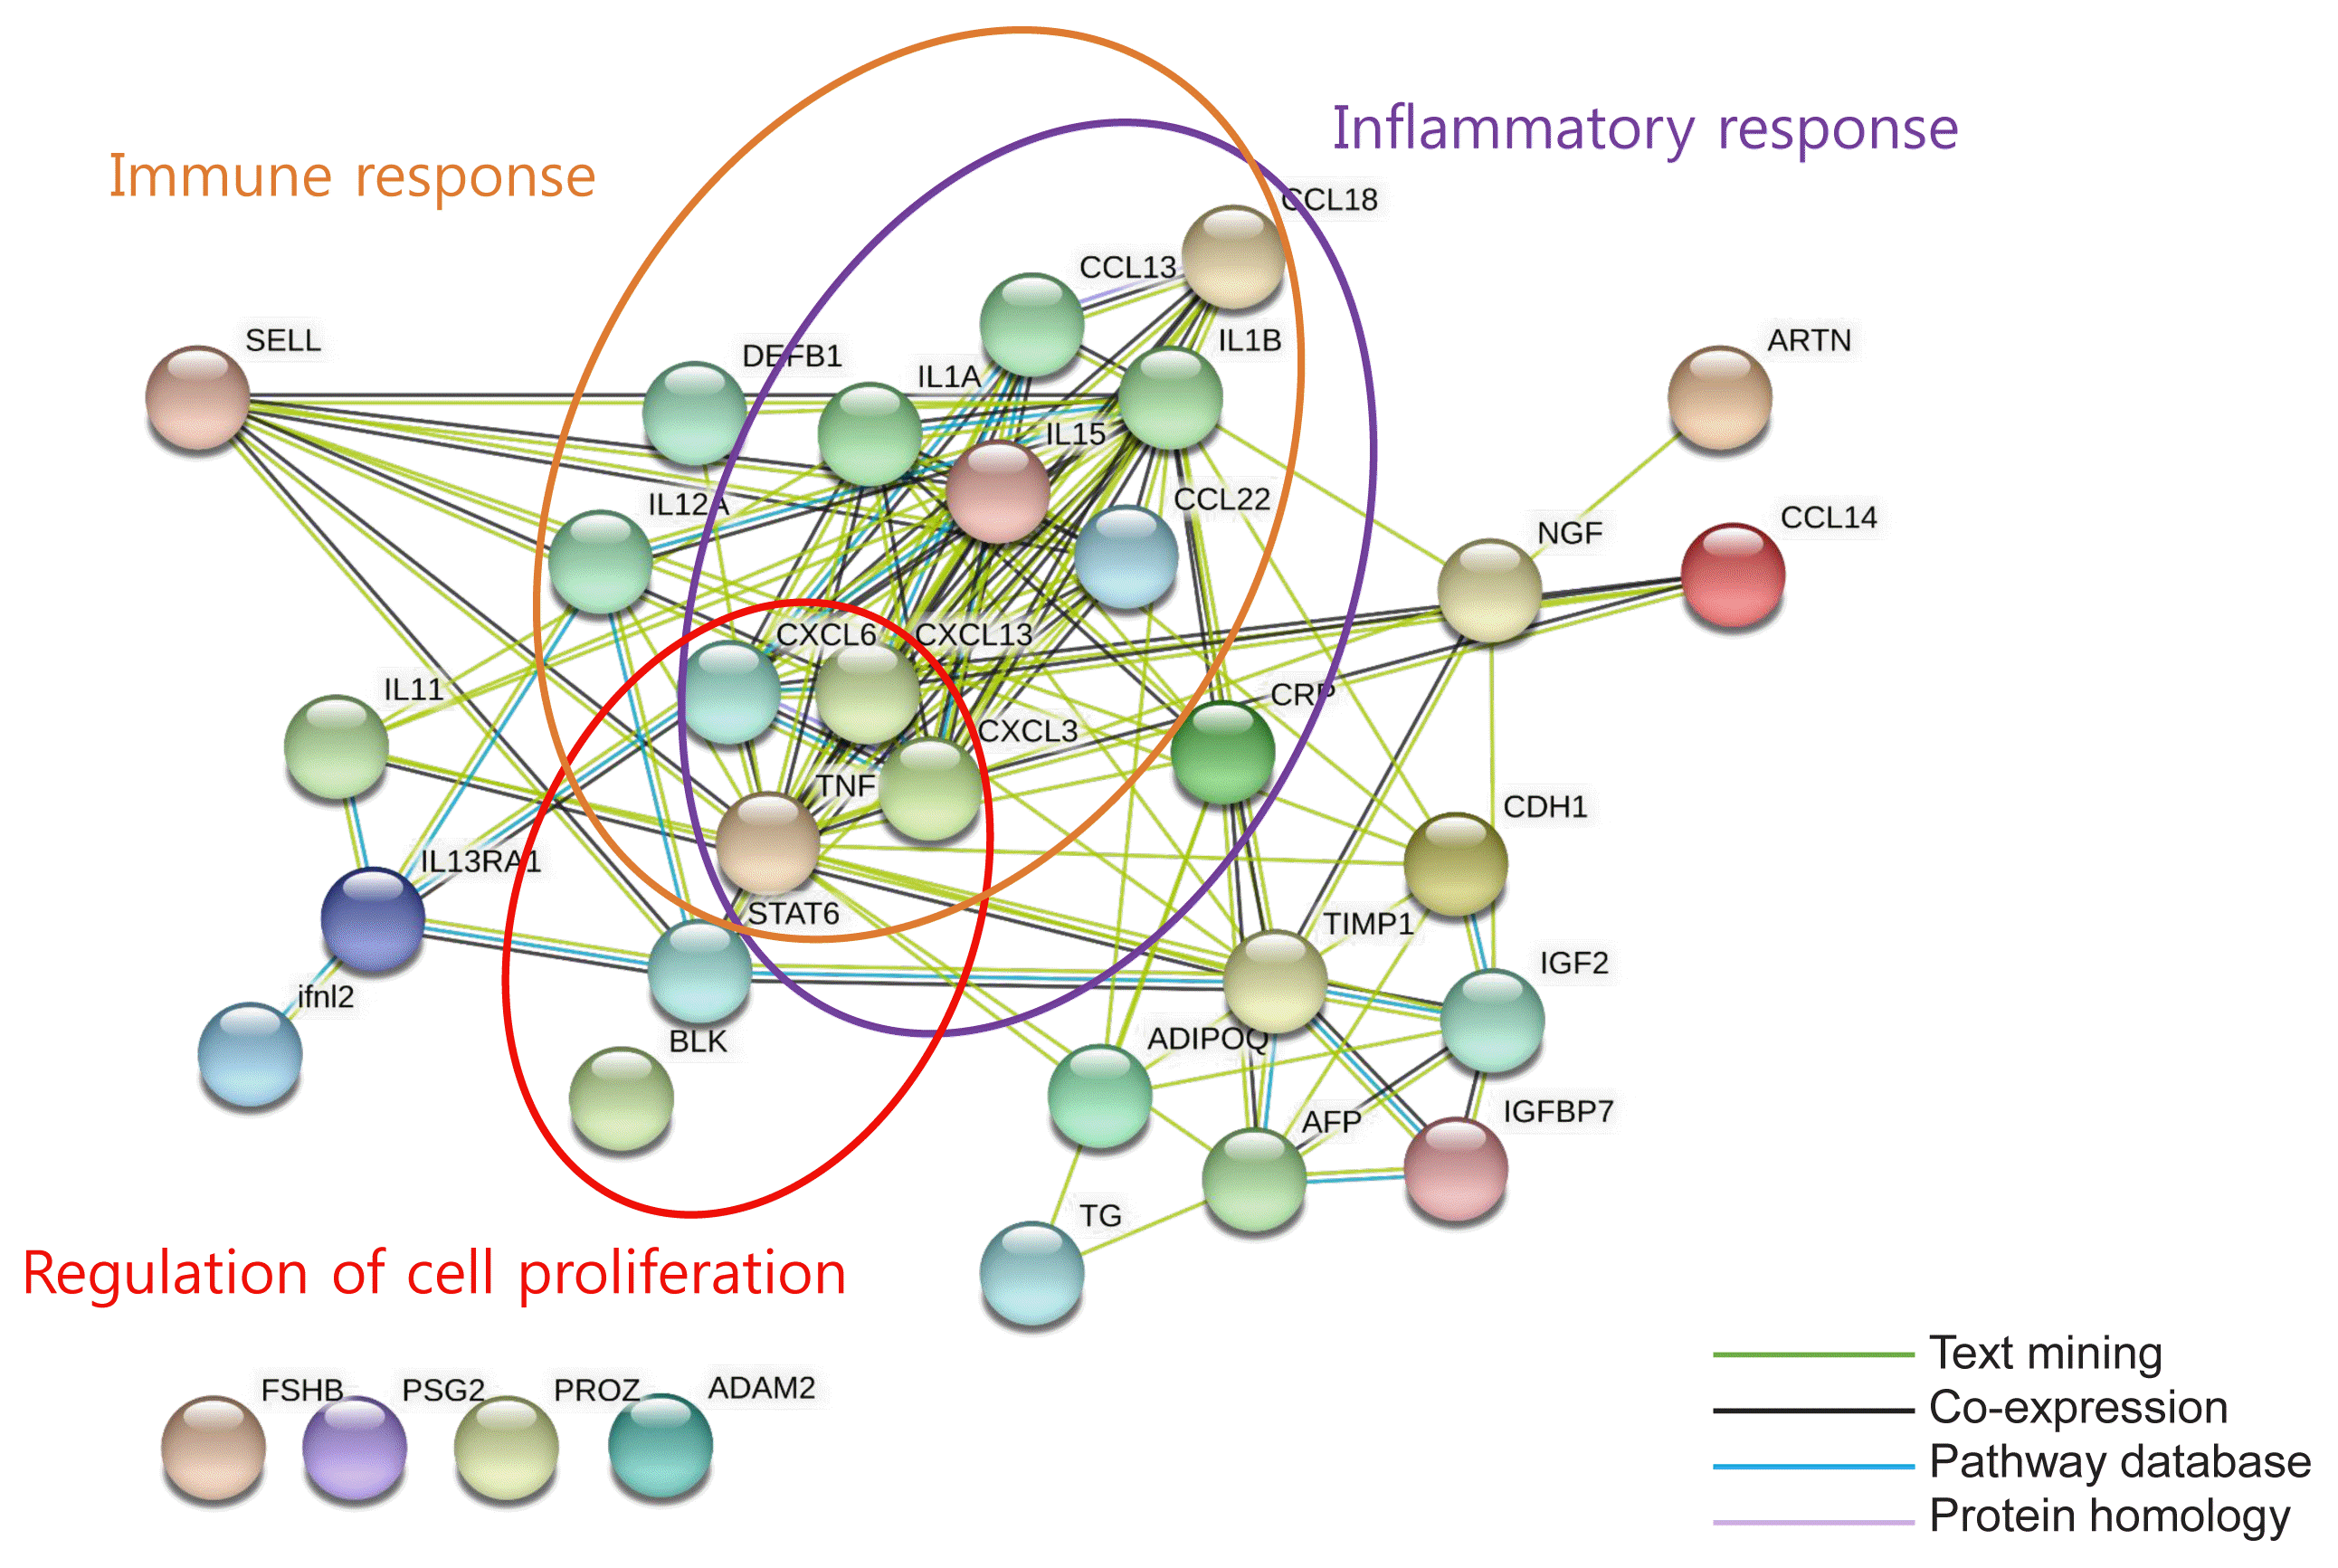
We carried out a bioinformatic analysis to investigate the associated biological activity of cytokines and screened 33 cytokines that differed by at least 1.5-fold in the prediabetes group compared with the normoglycemia group (Supplemental Table S2). We determined the predicted enriched biological processes and pathways associated with these 33 cytokines using DAVID, the results of which are presented in Supplemental Fig. S3. We used STRING to identify the protein–protein interactions (PPIs) for the 33 cytokines. It revealed strong enrichment of biological processes such as immune response, inflammatory response, and cell proliferation regulation (Fig. 2). However, PROZ, follicle stimulating hormone, CEA, and CA15-3 were not involved in these biological processes.

Validation of PROZ as a potential biomarker for prediabetes and T2DM

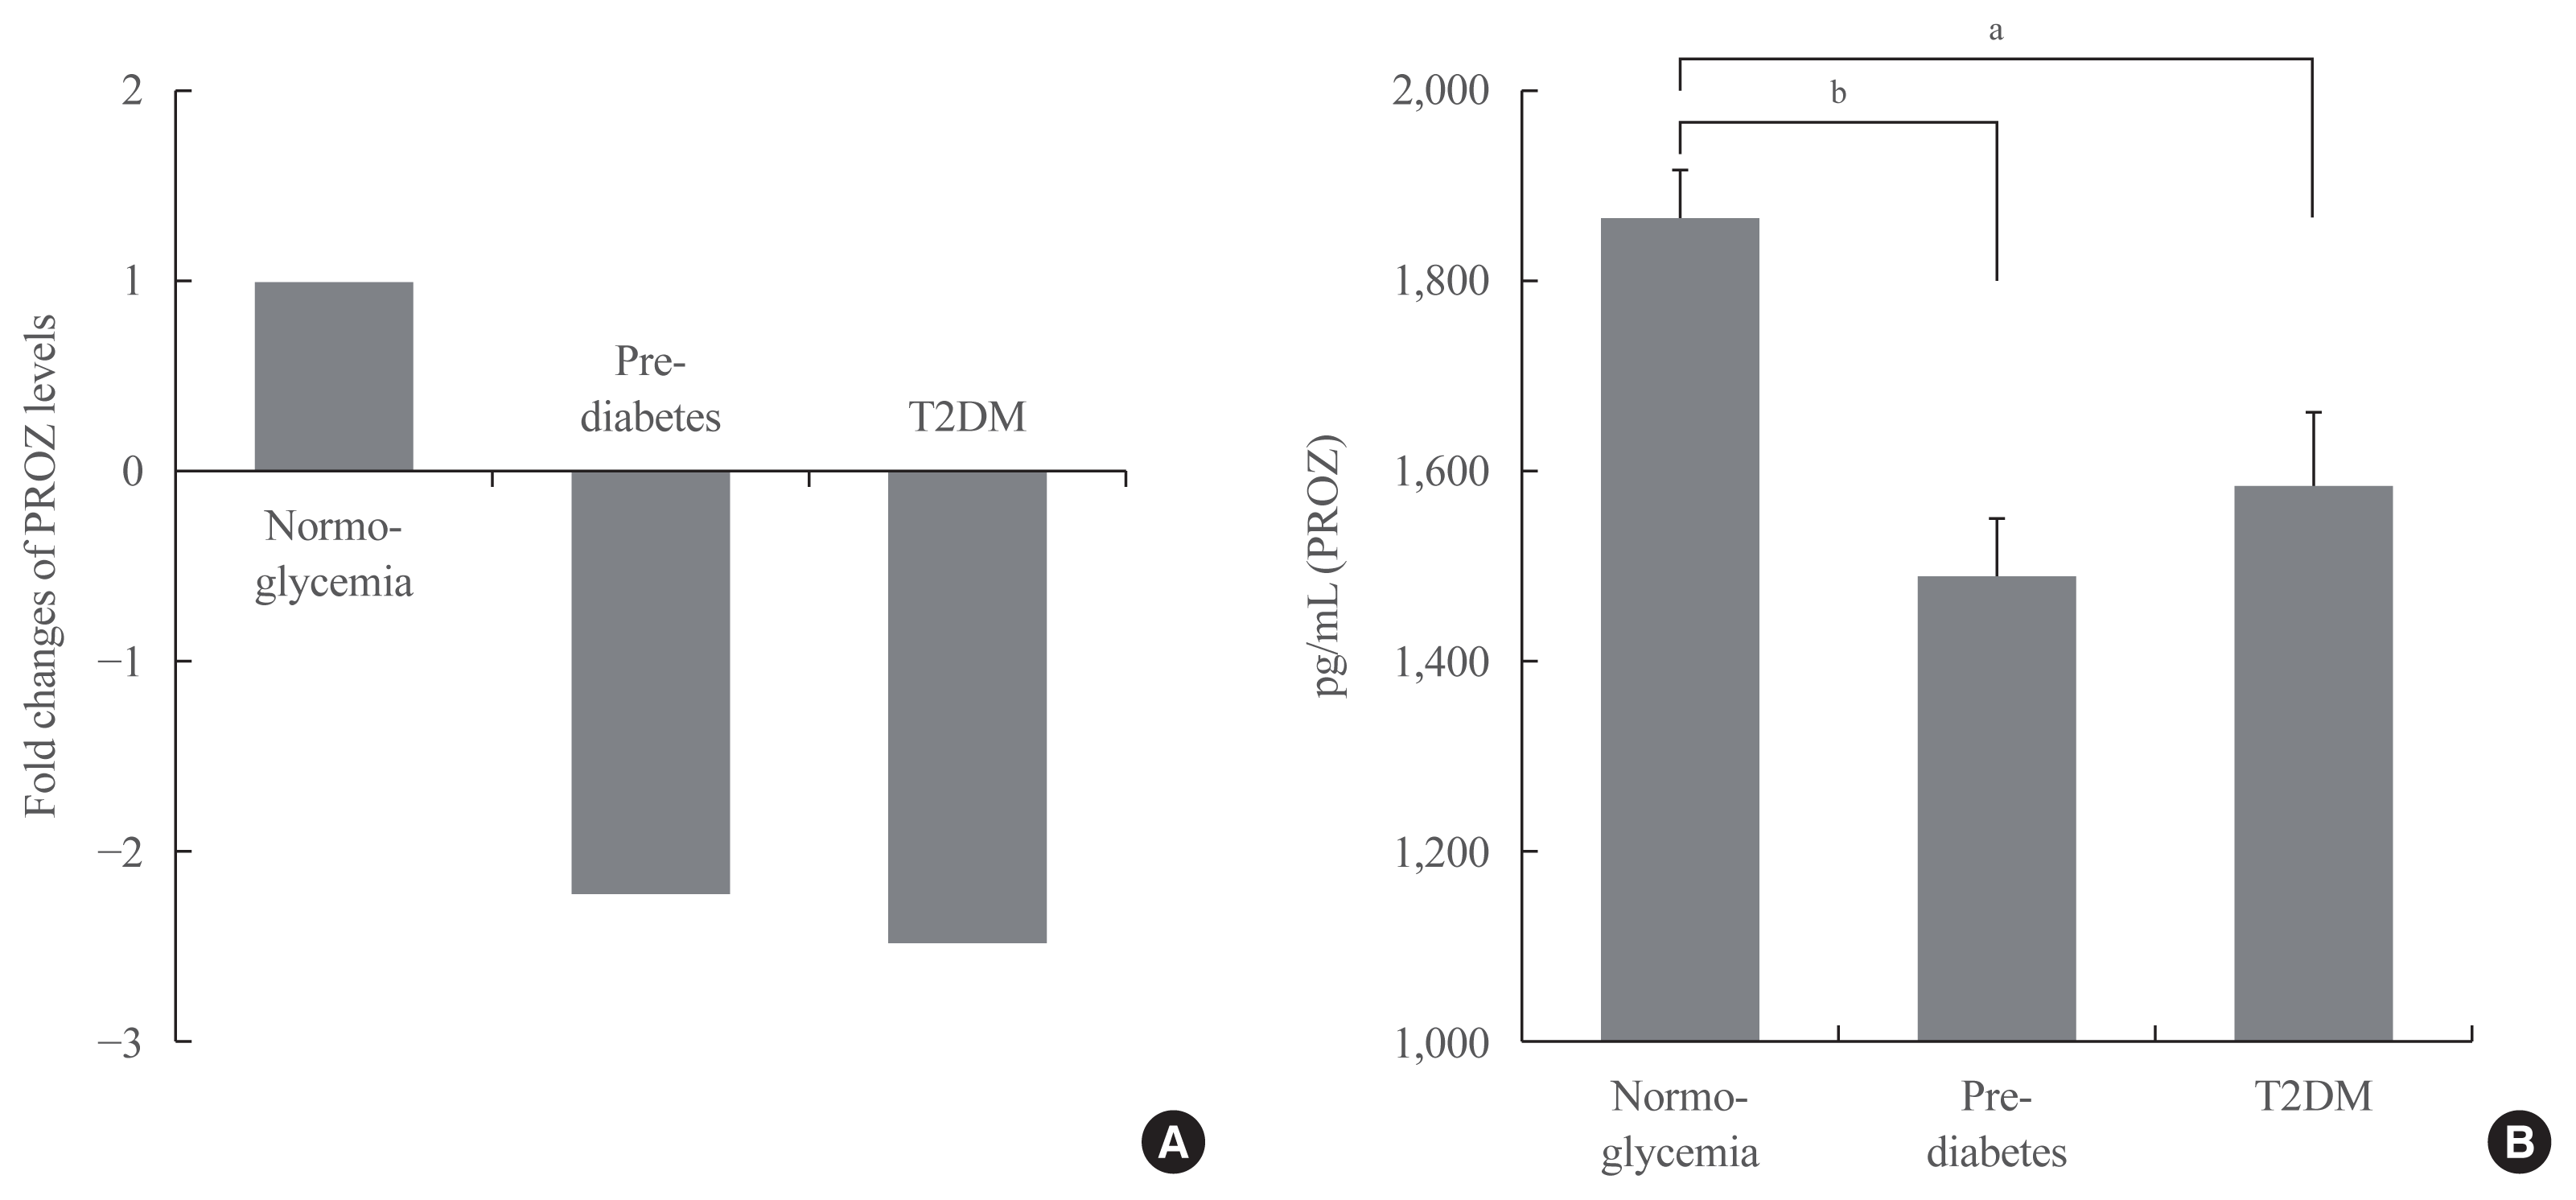
In order to find a promising biomarker for prediabetes from the listed cytokines, we decided to validate PROZ. We selected PROZ because its expression showed a marked decrease in patients with prediabetes compared to those with normoglycemia (Fig. 3A), and it has not been identified as a factor associated with diabetes in any previous study. We performed ELISA on the samples from all the groups to determine PROZ levels. Table 2 shows the baseline characteristics of the subjects of the different groups that underwent validation. Through a validation study, the average plasma levels of PROZ in 35 subjects with prediabetes and 36 subjects with T2DM were determined and compared with those in the 71 subjects with normoglycemia. Plasma PROZ levels were decreased in subjects with prediabetes (1,490.32±367.19 pg/mL) and T2DM (1,583.34±465.43 pg/mL) compared to those in subjects with normoglycemia (1,864.07±450.83 pg/mL) (P<0.001) (Fig. 3B).

Correlation analysis between PROZ and clinical parameters

The correlations between PROZ and the other clinical parameters are shown in Table 3. There were significant negative correlations between PROZ and FPG (Pearson R=–0.284, Pearson P=0.001) as well as between PROZ and HbA1c (Pearson R= −0.216, Pearson P=0.010). PROZ had negative correlations with insulin and HOMA-IR, whereas it had a positive correlation with homeostasis model assessment of β-cell function (HOMA-β); however, these were not statistically significant. Other parameters did not show a significant correlation with PROZ.

ROC curve of PROZ

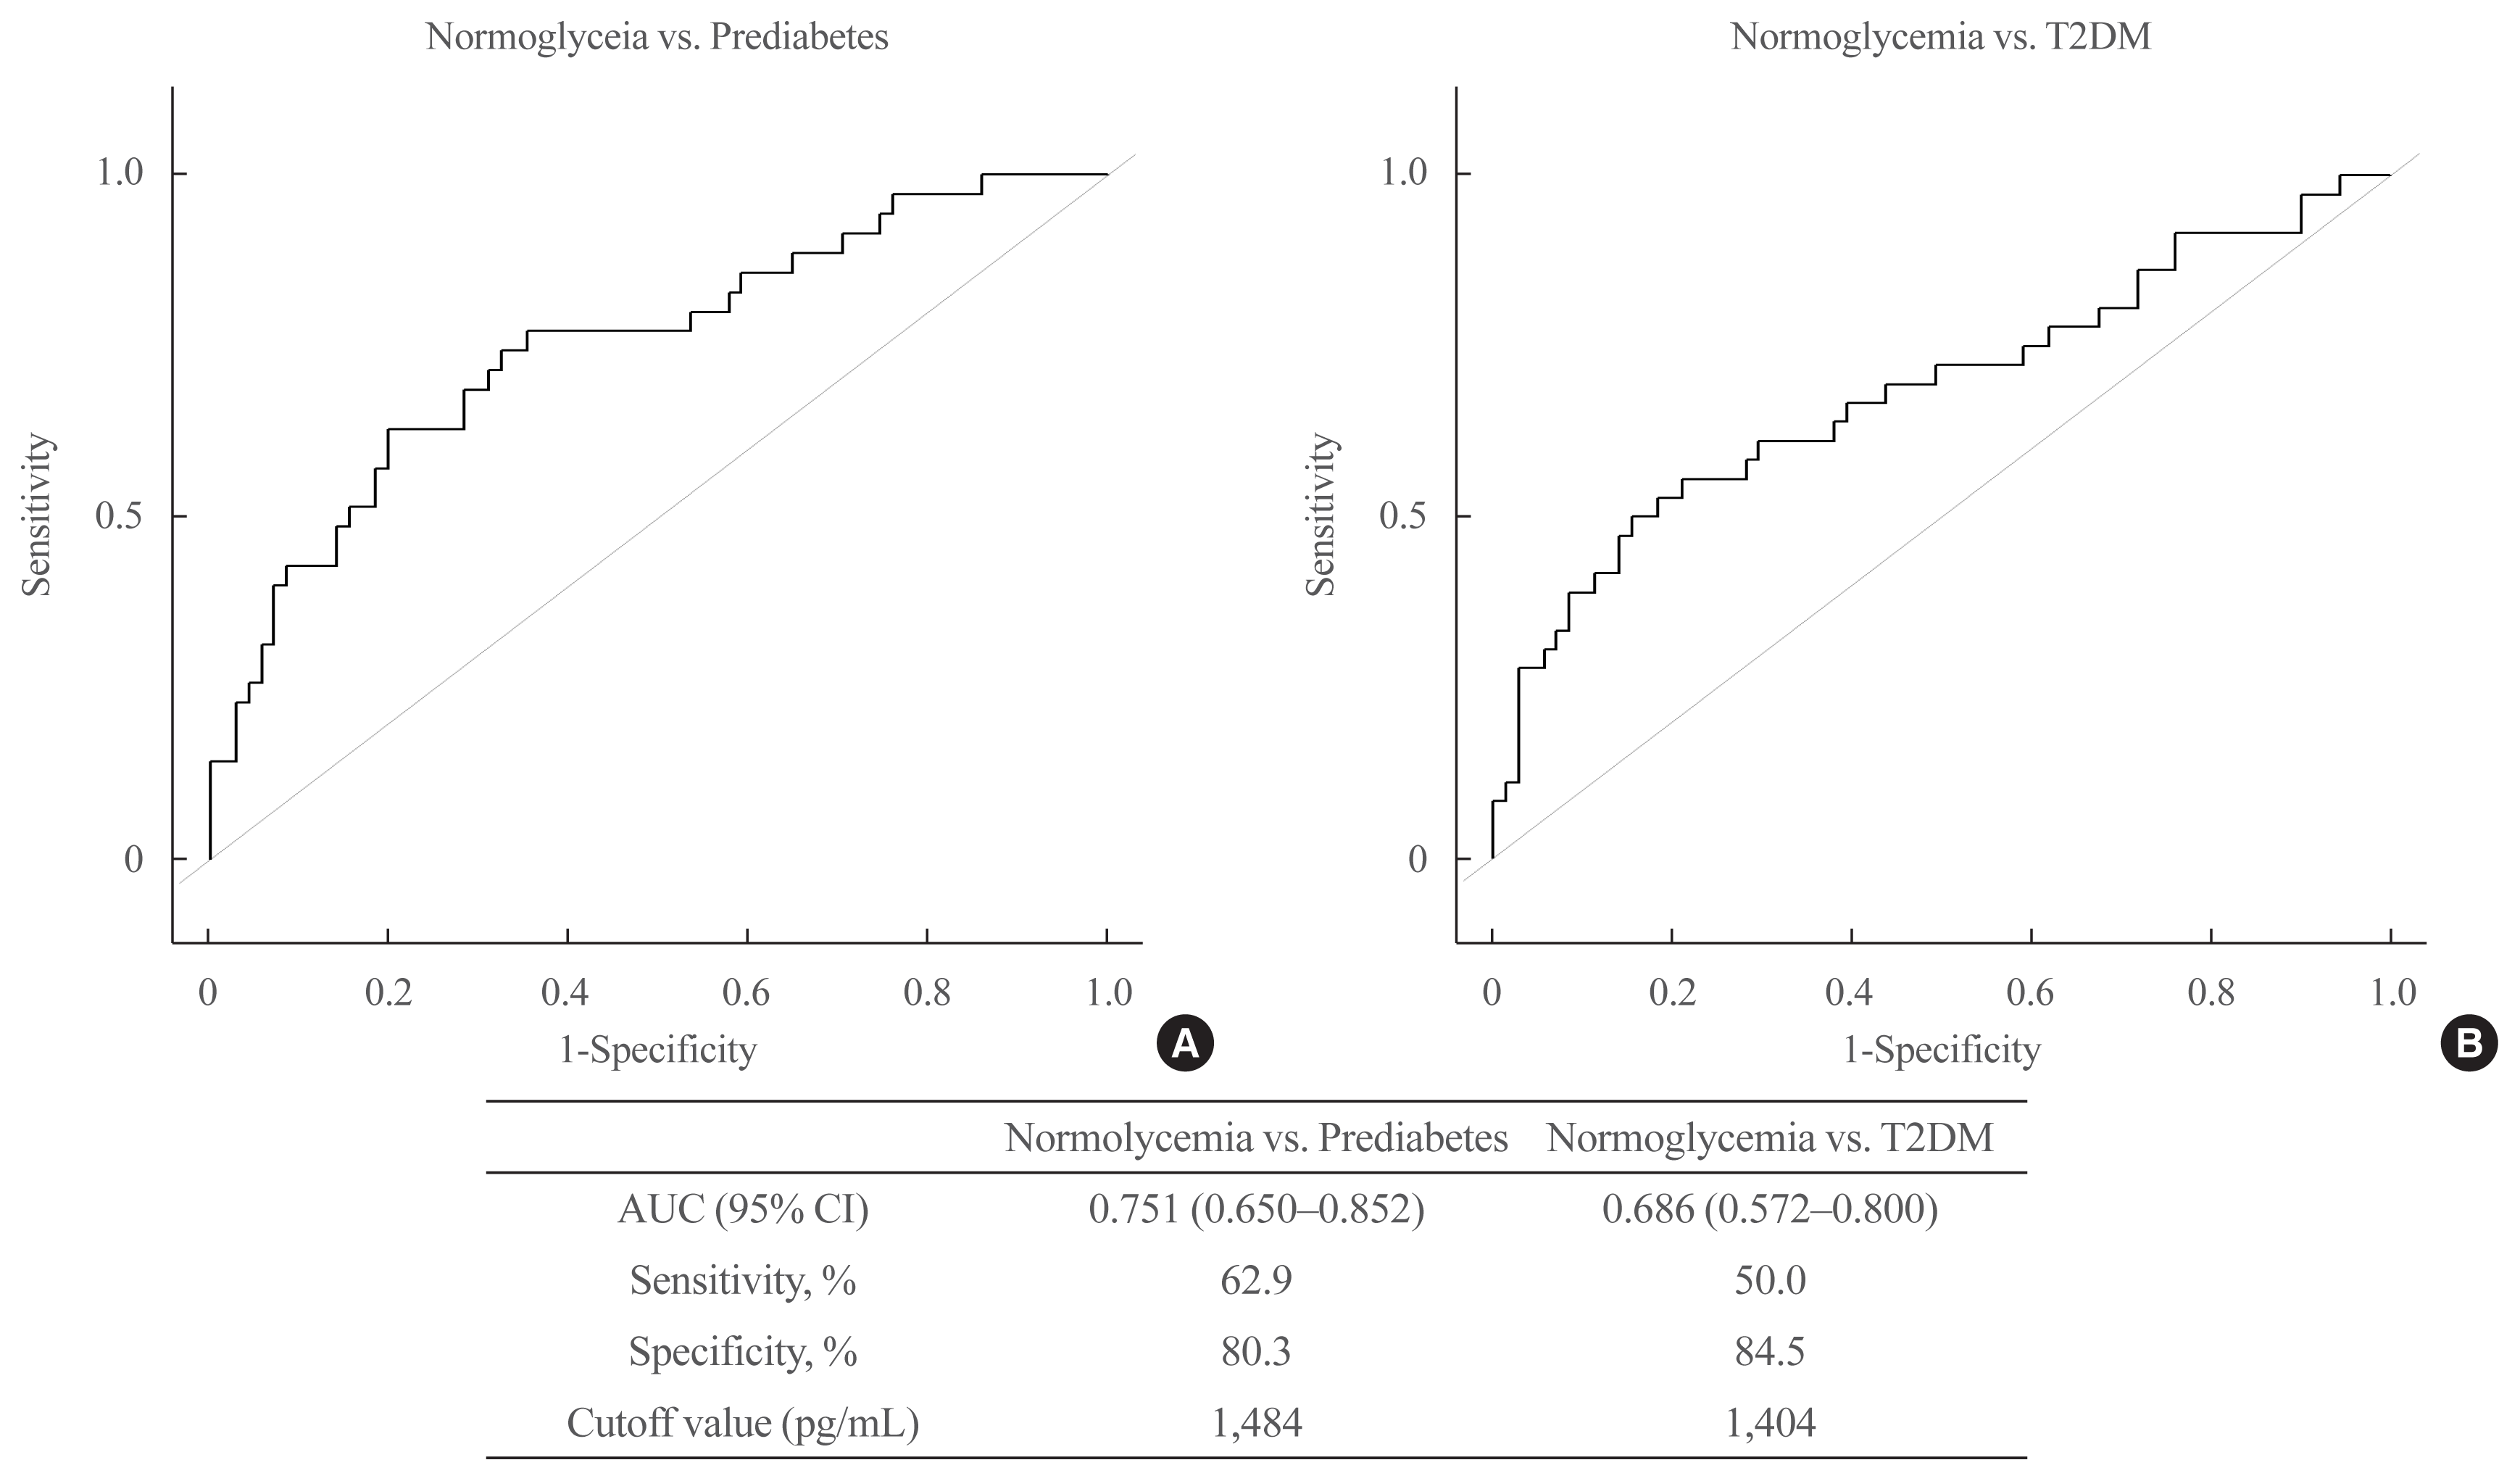
Fig. 4 shows the ROC curves of PROZ levels for prediabetes and T2DM compared with those in normoglycemia. The AUC of PROZ between prediabetes and normoglycemia was 0.751 (0.650 to 0.852), sensitivity was 62.9%, and specificity was 80.3%. The AUC of PROZ between T2DM and normoglycemia was 0.686 (0.572 to 0.800), sensitivity was 50.0%, and specificity was 84.5%.

DISCCUSION

In this study, we extensively profiled cytokines using cytokine microarray analysis and identified 41 cytokines that differed by 1.5-fold or more in at least one of the three group comparisons, out of 310 cytokines. From the differentially expressed cytokines, we finally selected PROZ and demonstrated that its levels significantly decreased in both prediabetes and T2DM groups as compared to that of the normoglycemia group. To the best of our knowledge, this is the first study to investigate the association between PROZ and prediabetes and T2DM.
PROZ is a vitamin K-dependent glycoprotein that is made in the liver and secreted into the plasma [16]. PROZ inhibits blood coagulation by forming complexes with the PROZ-dependent protease inhibitor to directly inhibit activated factor X at the phospholipid surface [17,18]. Previous clinical studies have reported the role of PROZ in patients with coronary disease [19], ischemic stroke [20], and deep vein thrombosis [21]. These studies reported that low PROZ levels were related with increased risk of cardio-cerebrovascular disease and thrombosis. However, there have been no report on the association between PROZ and glucose dysmetabolism. Our bioinformatic analysis showed that PROZ levels were associated with glycemic status without involvement in regulation of inflammatory response [2224], immune response [25], and cell proliferation response [26] pathways, although these response pathways have been known to play important roles in prediabetes and T2DM [2226]. Additionally, PROZ was not associated with HOMA-IR and HOMA-β in our analysis. Studies indicate that people with prediabetes and T2DM compared to healthy people have a higher risk of vascular complications [4,5]. On the basis of previous studies of PROZ [1721], we supposed that changes in PROZ levels could be related to vascular complications in prediabetes and T2DM. Further studies are needed to elucidate the role of PROZ in prediabetes, which may reveal the hidden mechanisms of T2DM.
Our data showed that the sensitivity of PROZ for prediabetes (62.9%) was relatively high as compared to that of HbA1c. Guo et al. [7] reported that HbA1c used for diagnosis of prediabetes demonstrated a low AUC (0.67) and low sensitivity (35.4%) in patients with IFG and/or IGT. Lipska et al. [8] showed that the sensitivity of HbA1c compared with FPG was 47.0% in older adults. High sensitivity of PROZ for detecting prediabetes may be able to compensate for the limitations of HbA1c. So, it is needed to confirm sensitivity and specificity of PROZ for detecting prediabetes in large-scale population study.
Previous studies have characterized various cytokines in patients with prediabetes or T2DM. IL-6 and CRP levels were elevated in patients with prediabetes and T2DM [12,27]. In our study, CRP levels were increased in subjects with prediabetes and T2DM compared to its levels in subjects with normoglycemia; however, IL-6 levels were not significantly different between the study groups. We found that NGF-β was significantly lower in subjects with prediabetes, but not in those with T2DM, than in subjects with normoglycemia. NGF-β is one of neurotrophins [28], and regulates the expression of angiogenic factors and angiogenesis [29,30]. NGF-β levels were higher in subjects with diabetic retinopathy than those with T2DM [31]. However, NGF-β levels did not significantly vary in our study. AFP, a marker used in the screening and diagnosis of hepatocellular carcinoma [32], is known to be associated with diabetes. Maternal serum AFP levels are significantly decreased in pregnant women with diabetes [33]. In our study, AFP levels were also significantly lower in subjects with prediabetes and T2DM than in those with normoglycemia. These contrasting results regarding some cytokines could be attributable to the relatively small sample size of our study. Further studies with larger sample sizes are warranted to investigate cytokines as biomarkers of glucose intolerance.
Our study is the first to evaluate the association between PROZ and prediabetes and T2DM. PROZ may be a promising biomarker to compensate for the limitations of the existing tests. However, this study has some limitations. First, the groups were relatively small. Second, this was a cross-sectional study. A longitudinal study involving observation of a group of pre-determined healthy controls proceeding to prediabetes or T2DM would have allowed a better interpretation of the research purpose. Third, we did not include coagulation parameters and high sensitivity CPR and did not analyze the relationship between PROZ levels and these parameters, depending on differential glycemic status. Lastly, we were unable to find a protein that interacts with PROZ in PPI network. Applying larger protein pool for PPI network using in-depth characterization of quantitative liquid chromatography-mass spectrometry proteomics may help to reveal the interaction of PROZ with other proteins.
Our study identified a potential cytokine, PROZ, that is related to prediabetes and could act as a promising biomarker of glucose dysmetabolism. The association between PROZ and prediabetes and T2DM may also reveal other mechanisms related to glucose dysmetabolism. Further large studies are needed to evaluate the potential of PROZ for detecting prediabetes.

Supplementary Information

Supplemental Table S1.
Baseline Characteristics of Subjects in Cytokine Microarray Analysis
enm-2021-962-suppl1.pdf
Supplemental Table S2.
List of 33 Cytokines Showing at Least 1.5-Fold Difference in Prediabetes Compared to Normoglycemia
enm-2021-962-suppl2.pdf
Supplemental Fig. S1.
Venn diagram displaying the number of differentially expressed cytokines among the three groups. (A) Up regulation proteins, (B) down regulation proteins. Pre-DM, prediabetes; Nor-Gly, normoglycemia; T2DM, type 2 diabetes mellitus.
enm-2021-962-suppl3.pdf
Supplemental Fig. S2.
Principal component analysis plots of three groups with normoglycemia, prediabetes, and type 2 diabetes mellitus (T2DM). Blue dot=normoglycemia, green dot=prediabetes, red dot=T2DM.
enm-2021-962-suppl4.pdf
Supplemental Fig. S3.
Gene Ontology (GO) term enrichment analysis for biological process (A) and Kyoto Encyclopedia of Genes and Genomes (KEGG) pathway analysis (B) of the cytokines with 1.5-fold difference between subjects with normoglycemia and patients with prediabetes. Analysis was performed using the Database for Annotation, Visualization and Integrated Discovery (DAVID) tool with the human genome as a reference.
enm-2021-962-suppl5.pdf

Notes

CONFLICTS OF INTEREST

No potential conflict of interest relevant to this article was reported.

AUTHOR CONTRIBUTIONS

Conception or design: Y.U.B., J.H.Y., H.C.C. Acquisition, analysis, or interpretation of data: Y.U.B., J.H.Y., L.E.K., H.M.S., J.H.P., H.C.C. Drafting the work or revising: Y.U.B., J.H.Y., H.C.C. Final approval of the manuscript: Y.U.B., J.H.Y., J.H.P., H.C.C.

ACKNOWLEDGMENTS

This research was supported by a grant (Ho Chan Cho, 2012) from the Korean Diabetes Association, a grant of the Korea Health technology R&D project through the Korea Health Industry Development Institute (KHIDI), funded by the Ministry of Health & Welfare, Republic of Korea (grant number: HI14-C1324), and Basic Science Research Program through the National Research Foundation of Korea (NRF) funded by the Ministry of Education (NRF-2018R1D1A1B07043990).
The part of the manuscript was reported as an abstract of AOCE-SICEM 2020 (The 17th Asia-Oceania Congress of Endocrinology and the 8th Seoul International Congress of Endocrinology and Metabolism).

REFERENCES

1. Tabak AG, Herder C, Rathmann W, Brunner EJ, Kivimaki M. Prediabetes: a high-risk state for diabetes development. Lancet. 2012; 379:2279–90.
crossref
2. American Diabetes Association. Diagnosis and classification of diabetes mellitus. Diabetes Care. 2010; 33(Suppl 1):S62–9.
3. Hostalek U. Global epidemiology of prediabetes: present and future perspectives. Clin Diabetes Endocrinol. 2019; 5:5.
4. Rask-Madsen C, King GL. Vascular complications of diabetes: mechanisms of injury and protective factors. Cell Metab. 2013; 17:20–33.
crossref
5. Milman S, Crandall JP. Mechanisms of vascular complications in prediabetes. Med Clin North Am. 2011; 95:309–25.
crossref
6. Bansal N. Prediabetes diagnosis and treatment: a review. World J Diabetes. 2015; 6:296–303.
crossref
7. Guo F, Moellering DR, Garvey WT. Use of HbA1c for diagnoses of diabetes and prediabetes: comparison with diagnoses based on fasting and 2-hr glucose values and effects of gender, race, and age. Metab Syndr Relat Disord. 2014; 12:258–68.
crossref
8. Lipska KJ, De Rekeneire N, Van Ness PH, Johnson KC, Kanaya A, Koster A, et al. Identifying dysglycemic states in older adults: implications of the emerging use of hemoglobin A1c. J Clin Endocrinol Metab. 2010; 95:5289–95.
crossref
9. Sehrawat T, Jindal A, Kohli P, Thour A, Kaur J, Sachdev A, et al. Utility and limitations of glycated hemoglobin (HbA1c) in patients with liver cirrhosis as compared with oral glucose tolerance test for diagnosis of diabetes. Diabetes Ther. 2018; 9:243–51.
crossref
10. Goldberg RB. Cytokine and cytokine-like inflammation markers, endothelial dysfunction, and imbalanced coagulation in development of diabetes and its complications. J Clin Endocrinol Metab. 2009; 94:3171–82.
crossref
11. Wang Z, Shen XH, Feng WM, Ye GF, Qiu W, Li B. Analysis of inflammatory mediators in prediabetes and newly diagnosed type 2 diabetes patients. J Diabetes Res. 2016; 2016:7965317.
crossref
12. Dorcely B, Katz K, Jagannathan R, Chiang SS, Oluwadare B, Goldberg IJ, et al. Novel biomarkers for prediabetes, diabetes, and associated complications. Diabetes Metab Syndr Obes. 2017; 10:345–61.
crossref
13. Huang da W, Sherman BT, Lempicki RA. Systematic and integrative analysis of large gene lists using DAVID bioinformatics resources. Nat Protoc. 2009; 4:44–57.
crossref
14. Huang da W, Sherman BT, Lempicki RA. Bioinformatics enrichment tools: paths toward the comprehensive functional analysis of large gene lists. Nucleic Acids Res. 2009; 37:1–13.
crossref
15. Doncheva NT, Morris JH, Gorodkin J, Jensen LJ. Cytoscape StringApp: network analysis and visualization of proteomics data. J Proteome Res. 2019; 18:623–32.
crossref
16. Broze GJ Jr, Miletich JP. Human protein Z. J Clin Invest. 1984; 73:933–8.
crossref
17. Han X, Fiehler R, Broze GJ Jr. Isolation of a protein Z-dependent plasma protease inhibitor. Proc Natl Acad Sci U S A. 1998; 95:9250–5.
crossref
18. Broze GJ Jr. Protein Z-dependent regulation of coagulation. Thromb Haemost. 2001; 86:8–13.
crossref
19. Fedi S, Sofi F, Brogi D, Tellini I, Cesari F, Sestini I, et al. Low protein Z plasma levels are independently associated with acute coronary syndromes. Thromb Haemost. 2003; 90:1173–8.
crossref
20. Heeb MJ, Paganini-Hill A, Griffin JH, Fisher M. Low protein Z levels and risk of ischemic stroke: differences by diabetic status and gender. Blood Cells Mol Dis. 2002; 29:139–44.
crossref
21. Santacroce R, Sarno M, Cappucci F, Sessa F, Colaizzo D, Brancaccio V, et al. Low protein Z levels and risk of occurrence of deep vein thrombosis. J Thromb Haemost. 2006; 4:2417–22.
crossref
22. Arora P, Garcia-Bailo B, Dastani Z, Brenner D, Villegas A, Malik S, et al. Genetic polymorphisms of innate immunity-related inflammatory pathways and their association with factors related to type 2 diabetes. BMC Med Genet. 2011; 12:95.
crossref
23. Donath MY, Shoelson SE. Type 2 diabetes as an inflammatory disease. Nat Rev Immunol. 2011; 11:98–107.
crossref
24. Maschirow L, Khalaf K, Al-Aubaidy HA, Jelinek HF. Inflammation, coagulation, endothelial dysfunction and oxidative stress in prediabetes: biomarkers as a possible tool for early disease detection for rural screening. Clin Biochem. 2015; 48:581–5.
25. Berbudi A, Rahmadika N, Tjahjadi AI, Ruslami R. Type 2 diabetes and its impact on the immune system. Curr Diabetes Rev. 2020; 16:442–9.
crossref
26. Chen C, Cohrs CM, Stertmann J, Bozsak R, Speier S. Human beta cell mass and function in diabetes: recent advances in knowledge and technologies to understand disease pathogenesis. Mol Metab. 2017; 6:943–57.
crossref
27. Pradhan AD, Manson JE, Rifai N, Buring JE, Ridker PM. C-reactive protein, interleukin 6, and risk of developing type 2 diabetes mellitus. JAMA. 2001; 286:327–34.
crossref
28. Levi-Montalcini R, Skaper SD, Dal Toso R, Petrelli L, Leon A. Nerve growth factor: from neurotrophin to neurokine. Trends Neurosci. 1996; 19:514–20.
crossref
29. Calza L, Giardino L, Giuliani A, Aloe L, Levi-Montalcini R. Nerve growth factor control of neuronal expression of angiogenetic and vasoactive factors. Proc Natl Acad Sci U S A. 2001; 98:4160–5.
crossref
30. Cantarella G, Lempereur L, Presta M, Ribatti D, Lombardo G, Lazarovici P, et al. Nerve growth factor-endothelial cell interaction leads to angiogenesis in vitro and in vivo. FASEB J. 2002; 16:1307–9.
crossref
31. Park KS, Kim SS, Kim JC, Kim HC, Im YS, Ahn CW, et al. Serum and tear levels of nerve growth factor in diabetic retinopathy patients. Am J Ophthalmol. 2008; 145:432–7.
crossref
32. Vora SR, Zheng H, Stadler ZK, Fuchs CS, Zhu AX. Serum alpha-fetoprotein response as a surrogate for clinical outcome in patients receiving systemic therapy for advanced hepatocellular carcinoma. Oncologist. 2009; 14:717–25.
33. Henriques CU, Damm P, Tabor A, Pedersen JF, Molsted-Pedersen L. Decreased alpha-fetoprotein in amniotic fluid and maternal serum in diabetic pregnancy. Obstet Gynecol. 1993; 82:960–4.
crossref

Fig. 1
Identification of cytokines associated with glucose dysmetabolism using antibody array profiling. The columns and rows in the heatmap represent samples and gene symbol, respectively. In each row, the intensities were divided by the standard deviation after subtracting the mean intensity from them. Red and blue represent the increase and decrease in abundance, respectively. The color bar represents the gradient of the auto scaled log2 intensities. T2DM, type 2 diabetes mellitus; IL, interleukin; ARTN, artemin; CXCL, C-X-C motif chemokine ligand; IGFBP, insulin like growth factor-binding protein; CCL, C-C motif chemokine ligand; DEFB1, defensin beta 1; TIMP1, TIMP metallopepetidase inhibitor 1; BLK, BLK proto-oncogene; ADIPOQ, adiponectin, C1Q and collagen domain containing; TNFRSF1B, tumor necrosis factor receptor superfamily 1B; LTA, lymphotoxin alpha; CDH1, cadherin 1; NTF4, neurotrophin 4; CRP, C-reactive protein; CTNNA1, catenin alpha 1; MMP2, matrix metallopeptidase 2; PROZ, protein Z; FSHB, follicle stimulating hormone subunit beta; STAT6, signal transducer and activator of transcription 6; IL13RA1, interleukin 13 receptor subunit alpha 1; AFP, alpha-fetoprotein; PSG2, pregnancy specific beta-1-glycoprotein 2; IGF2, insulin-like growth factor 2; IFNL2, interferon lambda 2; TG, thyroglobulin; ADAM2, ADAM metallopeptidase domain 2; TNF, tumor necrosis factor; NGF, nerve growth factor; SELL, selectin L.
enm-2021-962f1.gif
Fig. 2
Functional network analysis showing at least 1.5-fold change between normoglycemia and prediabetes. Proteins with well-defined relevant functions have been grouped (orange circle=immune response; red circle=regulation of cell proliferation; purple circle=inflammatory response). Green line=text mining (listing the proteins that are frequently mentioned together), black line=co-expression of proteins, blue line=pathway database, light purple line=protein homology. The network was generated using the Search Tool for the Retrieval of Interacting Genes/Proteins (STRING) database in Cytoscape. ADAM2, ADAM metallopeptidase domain 2; ADIPOQ, adiponectin, C1Q and collagen domain containing; AFP, alpha-fetoprotein; ARTN, artemin; BLK, BLK proto-oncogene; CCL, C-C motif chemokine ligand; CDH1, cadherin 1; CRP, C-reactive protein; CXCL, C-X-C motif chemokine ligand; DEFB1, defensin beta 1; FSHB, follicle stimulating hormone subunit beta; IFNL2, interferon lambda 2; IGF2, insulin-like growth factor 2; IGFBP7, insulin like growth factor-binding protein 7; IL, interleukin; IL13RA1, interleukin 13 receptor subunit alpha 1; TIMP1, TIMP metallopepetidase inhibitor 1; NGF, nerve growth factor; PROZ, protein Z; PSG2, pregnancy specific beta-1-glycoprotein 2; SELL, selectin L; STAT6, signal transducer and activator of transcription 6; TG, thyroglobulin; TNF, tumor necrosis factor.
enm-2021-962f2.gif
Fig. 3
The association of protein Z (PROZ) with normoglycemia, prediabetes, and type 2 diabetes mellitus (T2DM). (A) Fold changes of PROZ levels in subjects with normoglycemia, prediabetes, and T2DM. (B) Plasma levels of PROZ in subjects with normoglycemia, prediabetes, and T2DM. Values are presented as mean±standard error of the mean. Figures are representative of duplicate experiments. aP<0.01; bP<0.001.
enm-2021-962f3.gif
Fig. 4
Receiver operating characteristic (ROC) curves of protein Z (PROZ). (A) The ROC curves of PROZ levels for prediabetes and type 2 diabetes mellitus (T2DM) compared with those in normoglycemia. (B) The area under the curve, sensitivity, specificity and cutoff value of PROZ for prediabetes and T2DM compared with those in normoglycemia. AUC, area under the curve; CI, confidence interval.
enm-2021-962f4.gif
Table 1
List of Representative Cytokines Showing More than 2-Fold Change at Least Once in the Three Comparisons
Gene symbol List of cytokines Fold change P value
Prediabetes/normoglycemia T2DM/prediabetes T2DM/normoglycemia
IGF2 IGF-II −2.303 1.166 −1.976 <0.001
IFNL2 IFN-lambda2 −5.722 1.198 −4.777 <0.001
IL15 IL-15 −1.965 −1.155 −2.269 <0.001
NGF NGF-β −3.751 3.888 1.037 0.007
BLK BLK 3.330 −1.416 2.352 0.003
PROZ PROZ −2.192 −1.124 −2.463 <0.001
AFP AFP −6.373 2.889 −2.206 <0.001
ADAM2 CA15-3 −4.385 4.739 1.081 0.001
PSG2 CEA −2.080 1.375 −1.512 <0.001
CRP CRP 1.593 2.379 3.789 0.025
FSHB FSH −2.126 −1.388 −2.952 <0.001
TG Thyroglobulin −2.474 2.103 −1.177 <0.001
STAT6 STAT6 −2.188 −1.312 −2.872 <0.001

T2DM, type 2 diabetes mellitus; IGF2, insulin-like growth factor 2; IFNL2, interferon lambda 2; IL, interleukin; NGF, nerve growth factor; BLK, BLK proto-oncogene; PROZ, protein Z; AFP, alpha-fetoprotein; ADAM2, ADAM metallopeptidase domain 2; CA15-3, carbohydrate antigen 15-3; PSG2, pregnancy specific beta-1-glycoprotein 2; CEA, carcinoembryonic antigen; CRP, C-reactive protein; FSHB, follicle stimulating hormone beta; TG, thyroglobulin; STAT6, signal transducer and activator of transcription 6.

Table 2
Baseline Characteristics of Subjects for Validation of PROZ
Characteristic Normoglycemia (n=71) Prediabetes (n=35) T2DM (n=36) P value
Sex, male/female 59/12 29/6 30/6 0.999
Hypertension 9 6 10 0.152
Dyslipidemia 0 3 19 <0.001
CVD 0 2 6 0.001
Smoking 9 4 11 0.040
Alcohol 40 18 13 0.139
Age, yr 55.7±11.0 57.5±12.5 59.1±10.2 0.309
Height, cm 167.04±7.67 166.40±9.09 165.14±7.71 0.519
Weight, kg 62.96±7.01 64.15±8.20 63.90±8.14 0.702
BMI, kg/m2 22.69±1.48 23.22±1.24 23.30±1.80 0.079
Waist, cm 79.86±6.42 82.75±5.18 86.60±6.81 <0.001
SBP, mm Hg 122.31±13.46 120.74±11.38 126.78±17.81 0.242
DBP, mm Hg 78.41±9.18 73.09±8.51 75.83±12.71 0.017
WBC, 103/μL 5.76±0.98a 6.38±1.56 6.71±1.60 0.003
Hb, g/dL 14.44±1.30b 14.37±1.12 14.68±1.86 0.691
AST, U/L 22.54±6.26 23.11±7.07 25.44±8.46 0.131
ALT, U/L 18.32±8.19 22.03±8.96 25.83±11.78 0.001
Creatinine, mg/dL 0.89±0.15 0.90±0.14 0.83±0.18 0.093
TG, mg/dL 138.31±99.00 139.85±96.98 178.90±102.10 0.116
HDL, mg/dL 51.03±14.01 53.78±12.43 44.77±10.19 0.010
LDL, mg/dL 109.69±25.21 113.74±31.17 113.37±50.06 0.766
HbA1c, % 5.29±0.20 5.93±0.20 7.29±1.49 <0.001
FPG, mg/dL 86.77±6.01 107.89±7.39 136.83±43.09 <0.001
Insulin, μIU/mL 2.09±1.37 5.45±3.48 7.75±5.68 <0.001
HOMA-IR 0.45±0.30 1.45±0.91 2.54±1.64 <0.001
HOMA-β 32.62±23.30 44.57±30.99 52.08±65.20 0.050
PROZ, pg/mL 1,864.07±450.83 1,490.32±367.19 1,583.34±465.43 <0.001

Values are expressed as number or mean±standard deviation. The definitions of smoking and alcohol are numbers of currently smoking and drinking in each group.

PROZ, protein Z; T2DM, type 2 diabetes mellitus; CVD, cardiovascular disease; BMI, body mass index; SBP, systolic blood pressure; DBP, diastolic blood pressure; WBC, white blood cell; Hb, hemoglobin; AST, aspartate aminotransferase; ALT, alanine aminotransferase; TG, triglyceride; HDL, high-density lipoprotein; LDL, low-density lipoprotein; HbA1c, hemoglobin A1c; FPG, fasting plasma glucose; HOMA-IR, homeostatic model assessment for insulin resistance; HOMA-β, homeostasis model assessment of β-cell function.

a,b We analyzed WBC levels of 60 subjects with normoglycemia and Hb levels of 70 subjects with normoglycemia except for the missing data.

Table 3
Correlation between PROZ and Clinical Parameters
Variable Pearson R Pearson P
FPG −0.284 0.001
HbA1c −0.216 0.010
Insulin −0.054 0.521
HOMA-IR −0.129 0.127
HOMA-β 0.103 0.223

PROZ, protein Z; FPG, fasting plasma glucose; HbA1c, hemoglobin A1c; HOMA-IR, homeostatic model assessment for insulin resistance; HOMA-β, homeostasis model assessment of β-cell function.

TOOLS
Similar articles