Journal List > Endocrinol Metab > v.36(3) > 1516079072

Lee, Jung, Lee, Kim, Kim, Kang, Kang, Yi, Ko, Lee, Ku, Shong, and Kim: Expression of LONP1 Is High in Visceral Adipose Tissue in Obesity, and Is Associated with Glucose and Lipid Metabolism

Abstract

Background

The nature and role of the mitochondrial stress response in adipose tissue in relation to obesity are not yet known. To determine whether the mitochondrial unfolded protein response (UPRmt) in adipose tissue is associated with obesity in humans and rodents.

Methods

Visceral adipose tissue (VAT) was obtained from 48 normoglycemic women who underwent surgery. Expression levels of mRNA and proteins were measured for mitochondrial chaperones, intrinsic proteases, and components of electron-transport chains. Furthermore, we systematically analyzed metabolic phenotypes with a large panel of isogenic BXD inbred mouse strains and Genotype-Tissue Expression (GTEx) data.

Results

In VAT, expression of mitochondrial chaperones and intrinsic proteases localized in inner and outer mitochondrial membranes was not associated with body mass index (BMI), except for the Lon protease homolog, mitochondrial, and the corresponding gene LONP1, which showed high-level expression in the VAT of overweight or obese individuals. Expression of LONP1 in VAT positively correlated with BMI. Analysis of the GTEx database revealed that elevation of LONP1 expression is associated with enhancement of genes involved in glucose and lipid metabolism in VAT. Mice with higher Lonp1 expression in adipose tissue had better systemic glucose metabolism than mice with lower Lonp1 expression.

Conclusion

Expression of mitochondrial LONP1, which is involved in the mitochondrial quality control stress response, was elevated in the VAT of obese individuals. In a bioinformatics analysis, high LONP1 expression in VAT was associated with enhanced glucose and lipid metabolism.

INTRODUCTION

Adipose tissue undergoes dynamic remodeling in response to nutritional status. The remodeling process includes qualitative and quantitative changes in adipocytes and adipose tissue-resident cells [1]. Chronic overnutrition leads to obesity, which is accompanied by stress and an adaptive response that is associated with altered homeostasis of cellular organelles, such as endoplasmic reticulum and mitochondria, in adipocytes, liver, and skeletal muscle [2,3]. Mitochondrial homeostasis may play critical roles in both normal and pathological adipocyte remodeling, and a better understanding of the molecular links between mitochondrial homeostasis and energy metabolism should help to identify potential targets for the treatment of obesity.
Mitochondrial homeostasis requires the induction of several pathways that are responsible for mitochondrial quality control, including the mitochondrial unfolded protein response (UPRmt) [46]. The UPRmt senses proteostatic disturbances specifically in the mitochondria and resolves the stress by retrograde signaling to the nucleus, resulting in transcriptional activation of protective genes [7]. The damaged proteins are recognized by mitochondrial chaperones, such as 60 kDa heat shock protein, mitochondrial (encoded by HSPD1) and DnaJ heat shock protein family (Hsp40) member A3 (encoded by DNAJA3), then unfolded. Those proteins thereby become substrates for proteases such as caseinolytic mitochondrial matrix peptidase proteolytic subunit (encoded by CLPP), and Lon protease homolog, mitochondrial (encoded by LONP1) [4,8], which degrade them.
In this study, we investigated the molecular features of UPRmt in human visceral adipose tissue (VAT) in relation to obesity. We found that expression of the AAA+ family protease LONP1 is associated with obesity. We performed a bioinformatics analysis that determined the metabolic phenotypes that were associated with high and low expression of LONP1 in human VAT. Furthermore, we identified an association between Lonp1 expression and systemic glucose metabolism in murine white adipose tissue (WAT), by use of a genetic database.

METHODS

Participants

Patients who were scheduled for elective surgery were prospectively enrolled at the Department of Gynecology of Chungnam National University Hospital (CNUH), Daejeon, Republic of Korea. The Institutional Review Board of CNUH approved the study (approval number: 2016-07-026), and written informed consent was obtained from all participants. The study was performed in accordance with the principles of the Declaration of Helsinki. Inclusion criteria were age >19 years, and elective surgery for benign uterine and ovarian disorders. Individuals with cancer, prediabetes, diabetes mellitus, active liver disease, and/or end-stage renal disease were excluded. Finally, 48 participants were included in this study. Blood chemistry of participants was assessed, and serum insulin concentrations were measured as previously described [9].

Biopsy

Omental adipose tissue samples from the distal portion of the greater omentum were collected during surgery under general anesthesia. Adipose tissue specimens were snap-frozen in liquid nitrogen and stored at −70°C.

RNA isolation and quantitative real-time polymerase chain reaction

The methods that were used for RNA extraction, cDNA synthesis, and real-time polymerase chain reaction (RT-PCR) analysis have been described previously [10]. The primers for RT-PCR are listed in Supplemental Table S1. Target mRNA expression was normalized to 18S mRNA expression and determined by the 2−ΔΔCt method. Mitochondrial DNA (mtDNA) content was determined by quantitative RT-PCR, as previously described [11].

Protein analysis

Antibodies targeting cytochrome c oxidase subunit 1 (COX1), ubiquinol-cytochrome-c reductase complex core protein 2 (UQCRC2), DNAJA3, LONP1, and β-actin were purchased from Abcam (Cambridge, UK); antibody to NADH dehydrogenase (ubiquinone) 1 beta subcomplex subunit 8, mitochondrial (NDUFB8) was purchased from Novex (Carlsbad, CA, USA); and antibodies recognizing succinate dehydrogenase (ubiquinone) iron-sulfur subunit, mitochondrial (SDHB), transcription factor A, mitochondrial (TFAM), HSPD1, and CLPP were purchased from Santa Cruz Biotechnology (Dallas, TX, USA). Anti-rabbit secondary antibodies were obtained from Santa Cruz Biotechnology, and anti-mouse secondary antibodies were obtained from Cell Signaling Technology (Danvers, MA, USA). Western blotting images were scanned and quantified using an Odyssey imaging system and Image Studio DiGit software (LI-COR Biosciences, Lincoln, NE, USA). Lipid peroxidation was analyzed by measuring malondialdehyde concentrations with a commercial thiobarbituric acid-reactive substances assay kit (Cayman Chemical, Ann Arbor, MI, USA), according to the manufacturer’s specifications.

Statistical analysis

Statistical analyses were performed with SPSS software version 24.0 (IBM, Armonk, NY, USA). Clinical data are expressed as mean±standard deviation. mRNA levels are expressed as mean±standard error of the mean. Continuous variables were tested for normality with the Kolmogorov-Smirnov test. Clinical characteristics and mRNA levels of genes related to oxidative phosphorylation (OXPHOS) and UPRmt were compared between groups of individuals with body mass index (BMI) <23 kg/m2 and those with BMI ≥23 kg/m2 by Student’s t test or the Mann-Whitney U test for data with or without a normal distribution, respectively. The strengths of the relationships between variables of interest were analyzed by calculation of Spearman’s correlation coefficients. P<0.05 was considered to represent statistical significance.

Gene Ontology and pathway-enrichment analysis with the GTEx database

All the available Genotype-Tissue Expression (GTEx) data for VAT (n=541) were obtained from the UCSC database (http://xena.ucsc.edu/). The data used for our analyses were obtained from dbGaP, accession number: phos000424.v8.02 on April 13, 2020. Of the 541 VAT samples in the GTEx database, those with LONP1 expression in the highest (n=134) and lowest (n=134) quartiles were used for Gene Ontology (GO) and Kyoto Encyclopedia of Genes and Genomes (KEGG) pathway analysis. Differentially expressed genes were identified by the establishment of two groups based on LONP1 expression with the R package DESeq2 [12]. The gene-set collection of KEGG was obtained from Enrichr (https://amp.pharm.mssm.edu/Enrichr/), and the gene-set enrichment analysis was conducted with the R package Platform for Integrative Analysis of Omics data (PIANO). P values were adjusted using Benjamini-Hochberg correction for controlling false-discovery rate, and results were considered statistically significant when adjusted P values were <0.05. The full list of significantly enriched pathways is included in Supplemental Material S1.

Murine metabolic phenotype analysis with BXD recombinant inbred mouse strains

To analyze murine metabolic phenotypes in relation to expression of Lonp1, GeneNetwork (www.genenetwork.org) was used for multi-omics data for BXD recombinant inbred (RI) strains [13]. Expression of Lonp1 in subcutaneous WAT (sWAT) of BXD mice that were fed either chow or high-fat diets (GN accession numbers: GN779 and GN778, respectively) was used for the analysis. Metabolic phenotypes were compared between mice in the upper (Lonp1-high) and lower (Lonp1-low) quartiles with respect to WAT Lonp1 expression (n=9–10 mice per group). Phenotypic data recorded for the mice were body weight in males aged 8, 16, and 28 weeks old (GN record ID: 17557-17562); blood glucose measured during the oral glucose-tolerance test (OGTT) at 17 weeks old (GN record ID: 17643-17660); insulin measured during OGTT at 17 weeks old (GN record ID: 17665-17670); and lipid profiles measured in fasted state at 29 weeks old (GN record ID:17801-17812) [14,15]. Metabolic phenotypes and Lonp1 mRNA levels in sWAT were compared between Lonp1-low and Lonp1-high groups with Student’s t test. A paired-sample comparison of Lonp1 expression in the sWAT of mice fed chow versus high-fat diets was conducted in 35 mouse strains.

RESULTS

VAT mRNA levels of OXPHOS-complex and UPRmt genes in relation to BMI

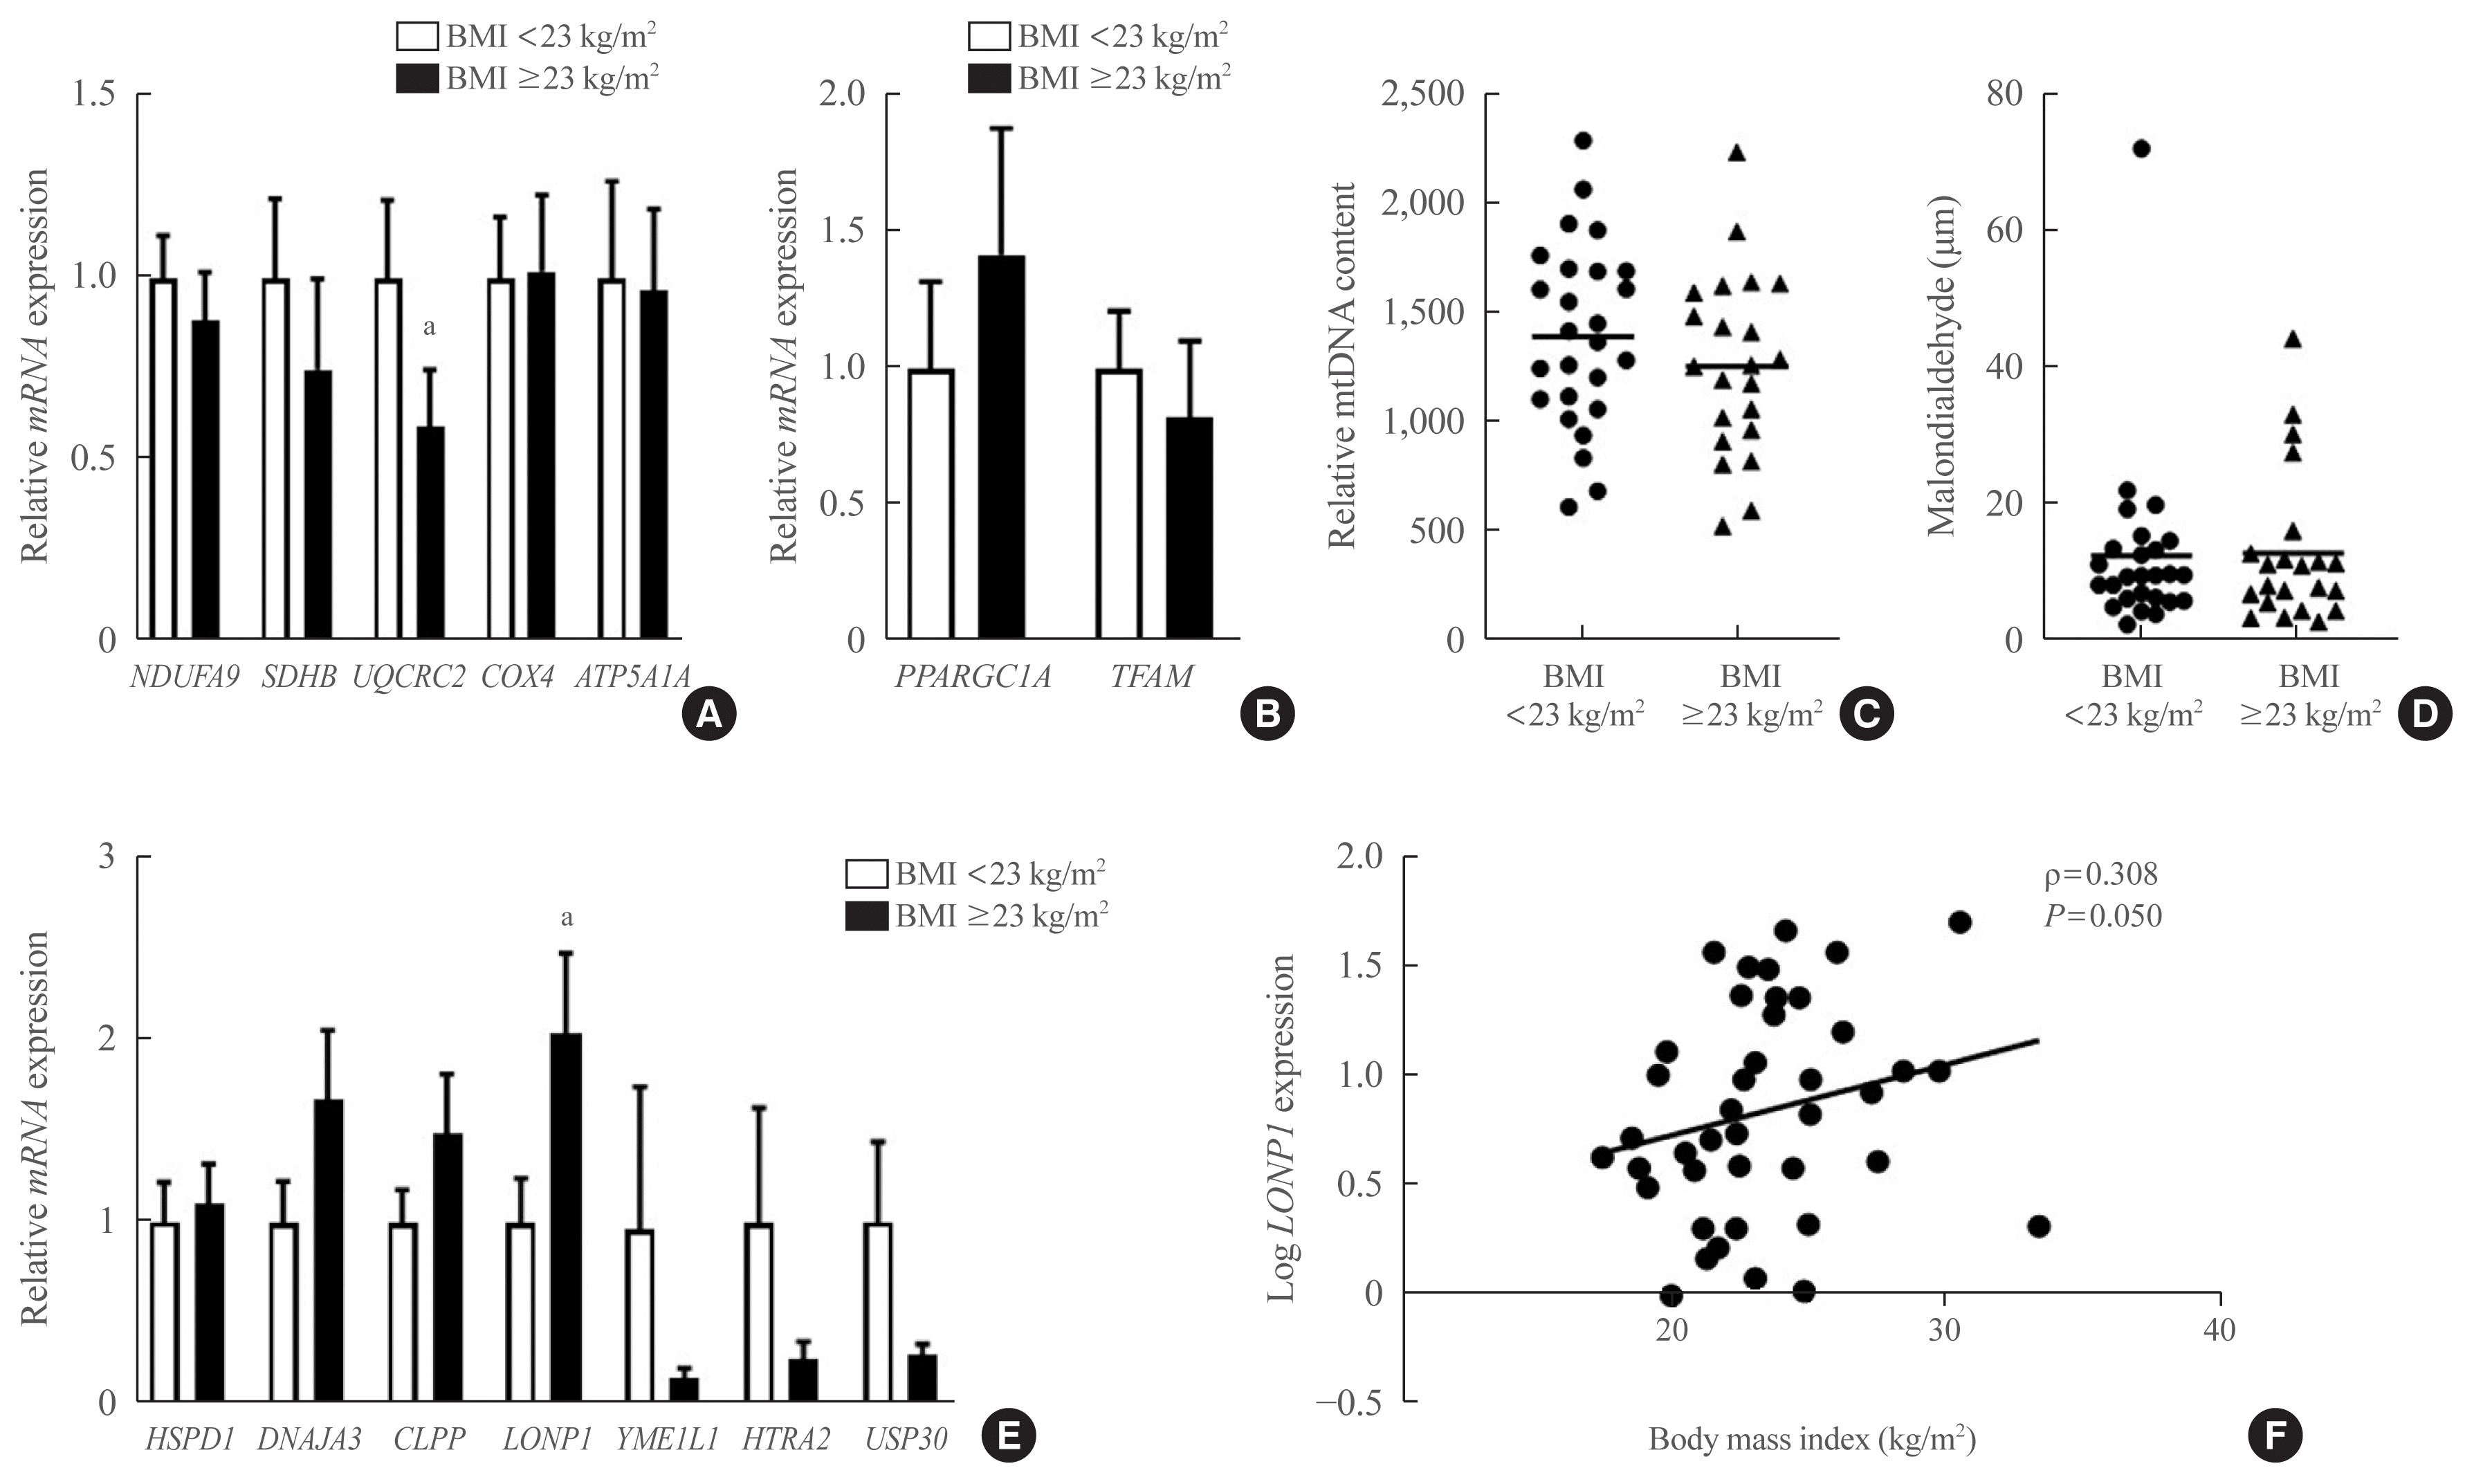
Among 48 patients, 11 were obese (≥25 kg/m2), 11 were overweight (23 to 24.9 kg/m2), and 26 were of normal or underweight (<22.9 kg/m2), according to the World Health Organization Asia-Pacific Obesity Classification [16]. Clinical characteristics of the participants stratified by BMI (<23 kg/m2 vs. ≥23 kg/m2) are summarized in Table 1. BMI, waist circumference, fasting blood glucose, fasting blood insulin, homeostatic model assessment of insulin resistance (HOMA-IR), and alanine aminotransferase values were significantly higher in the high-BMI than in the low-BMI group, whereas age and other variables did not differ significantly between the two groups. Among OXPHOS-complex genes (NADH:ubiquinone oxidoreductase subunit A9 [NDUFA9], SDHB, UQCRC2, COX4, and ATP synthase F1 subunit alpha [ATP5A1A]), UQCRC2 (from OXPHOS complex III) was only significantly lower in the high-BMI group than in the low-BMI group (Fig. 1A). The mitochondrial biogenesis-related genes, PPARGC1A (which encodes PPARG coactivator 1α), a key activator of mitochondrial transcription, TFAM expression and mtDNA content did not differ significantly between the groups (Fig. 1B, C). Although excess fat accumulation increases mitochondrial production of reactive oxygen species to cause adipocyte mitochondrial dysfunction [2], cellular concentrations of malondialdehyde, a naturally occurring product of lipid peroxidation, did not differ significantly between the groups (Fig. 1D). In correlation analyses, expression of these genes including UQCRC2, VAT mtDNA content, and cellular malondialdehyde concentrations did not correlate significantly with BMI (data not shown).
We compared the expression of genes encoding mitochondrial chaperones (HSPD1 and DNAJA3), mitochondrial matrix proteases (CLPP and LONP1), inner membrane protease (YME1 like 1 ATPase [YME1L1]), intramembrane protease (HtrA serine peptidase 2 [HTRA2]), outer membrane protease (ubiquitin specific peptidase 30 [USP30]) in VAT in relation to BMI. Among these UPRmt-related genes, LONP1 expression was around twice as high in the high-BMI group as in the low-BMI group (Fig. 1E). LONP1 gene expression was positively correlated with BMI (ρ=0.308, P=0.050) (Fig. 1F). LONP1 expression was also positively correlated with expression of HSPD1 and DNAJA3 (ρ=0.622, P<0.001 and ρ=0.409, P= 0.012, respectively), but was not correlated with expression of OXPHOS genes, PPARGC1A or TFAM, VAT mtDNA content or malondialdehyde concentration, participant age, serum glucose, lipid profile or HOMA-IR (data not shown). This finding indicates that transcriptional activation of LONP1 is a signature feature occurred in the course of human visceral obesity.

Association of BMI with expression of UPRmt proteins in VAT

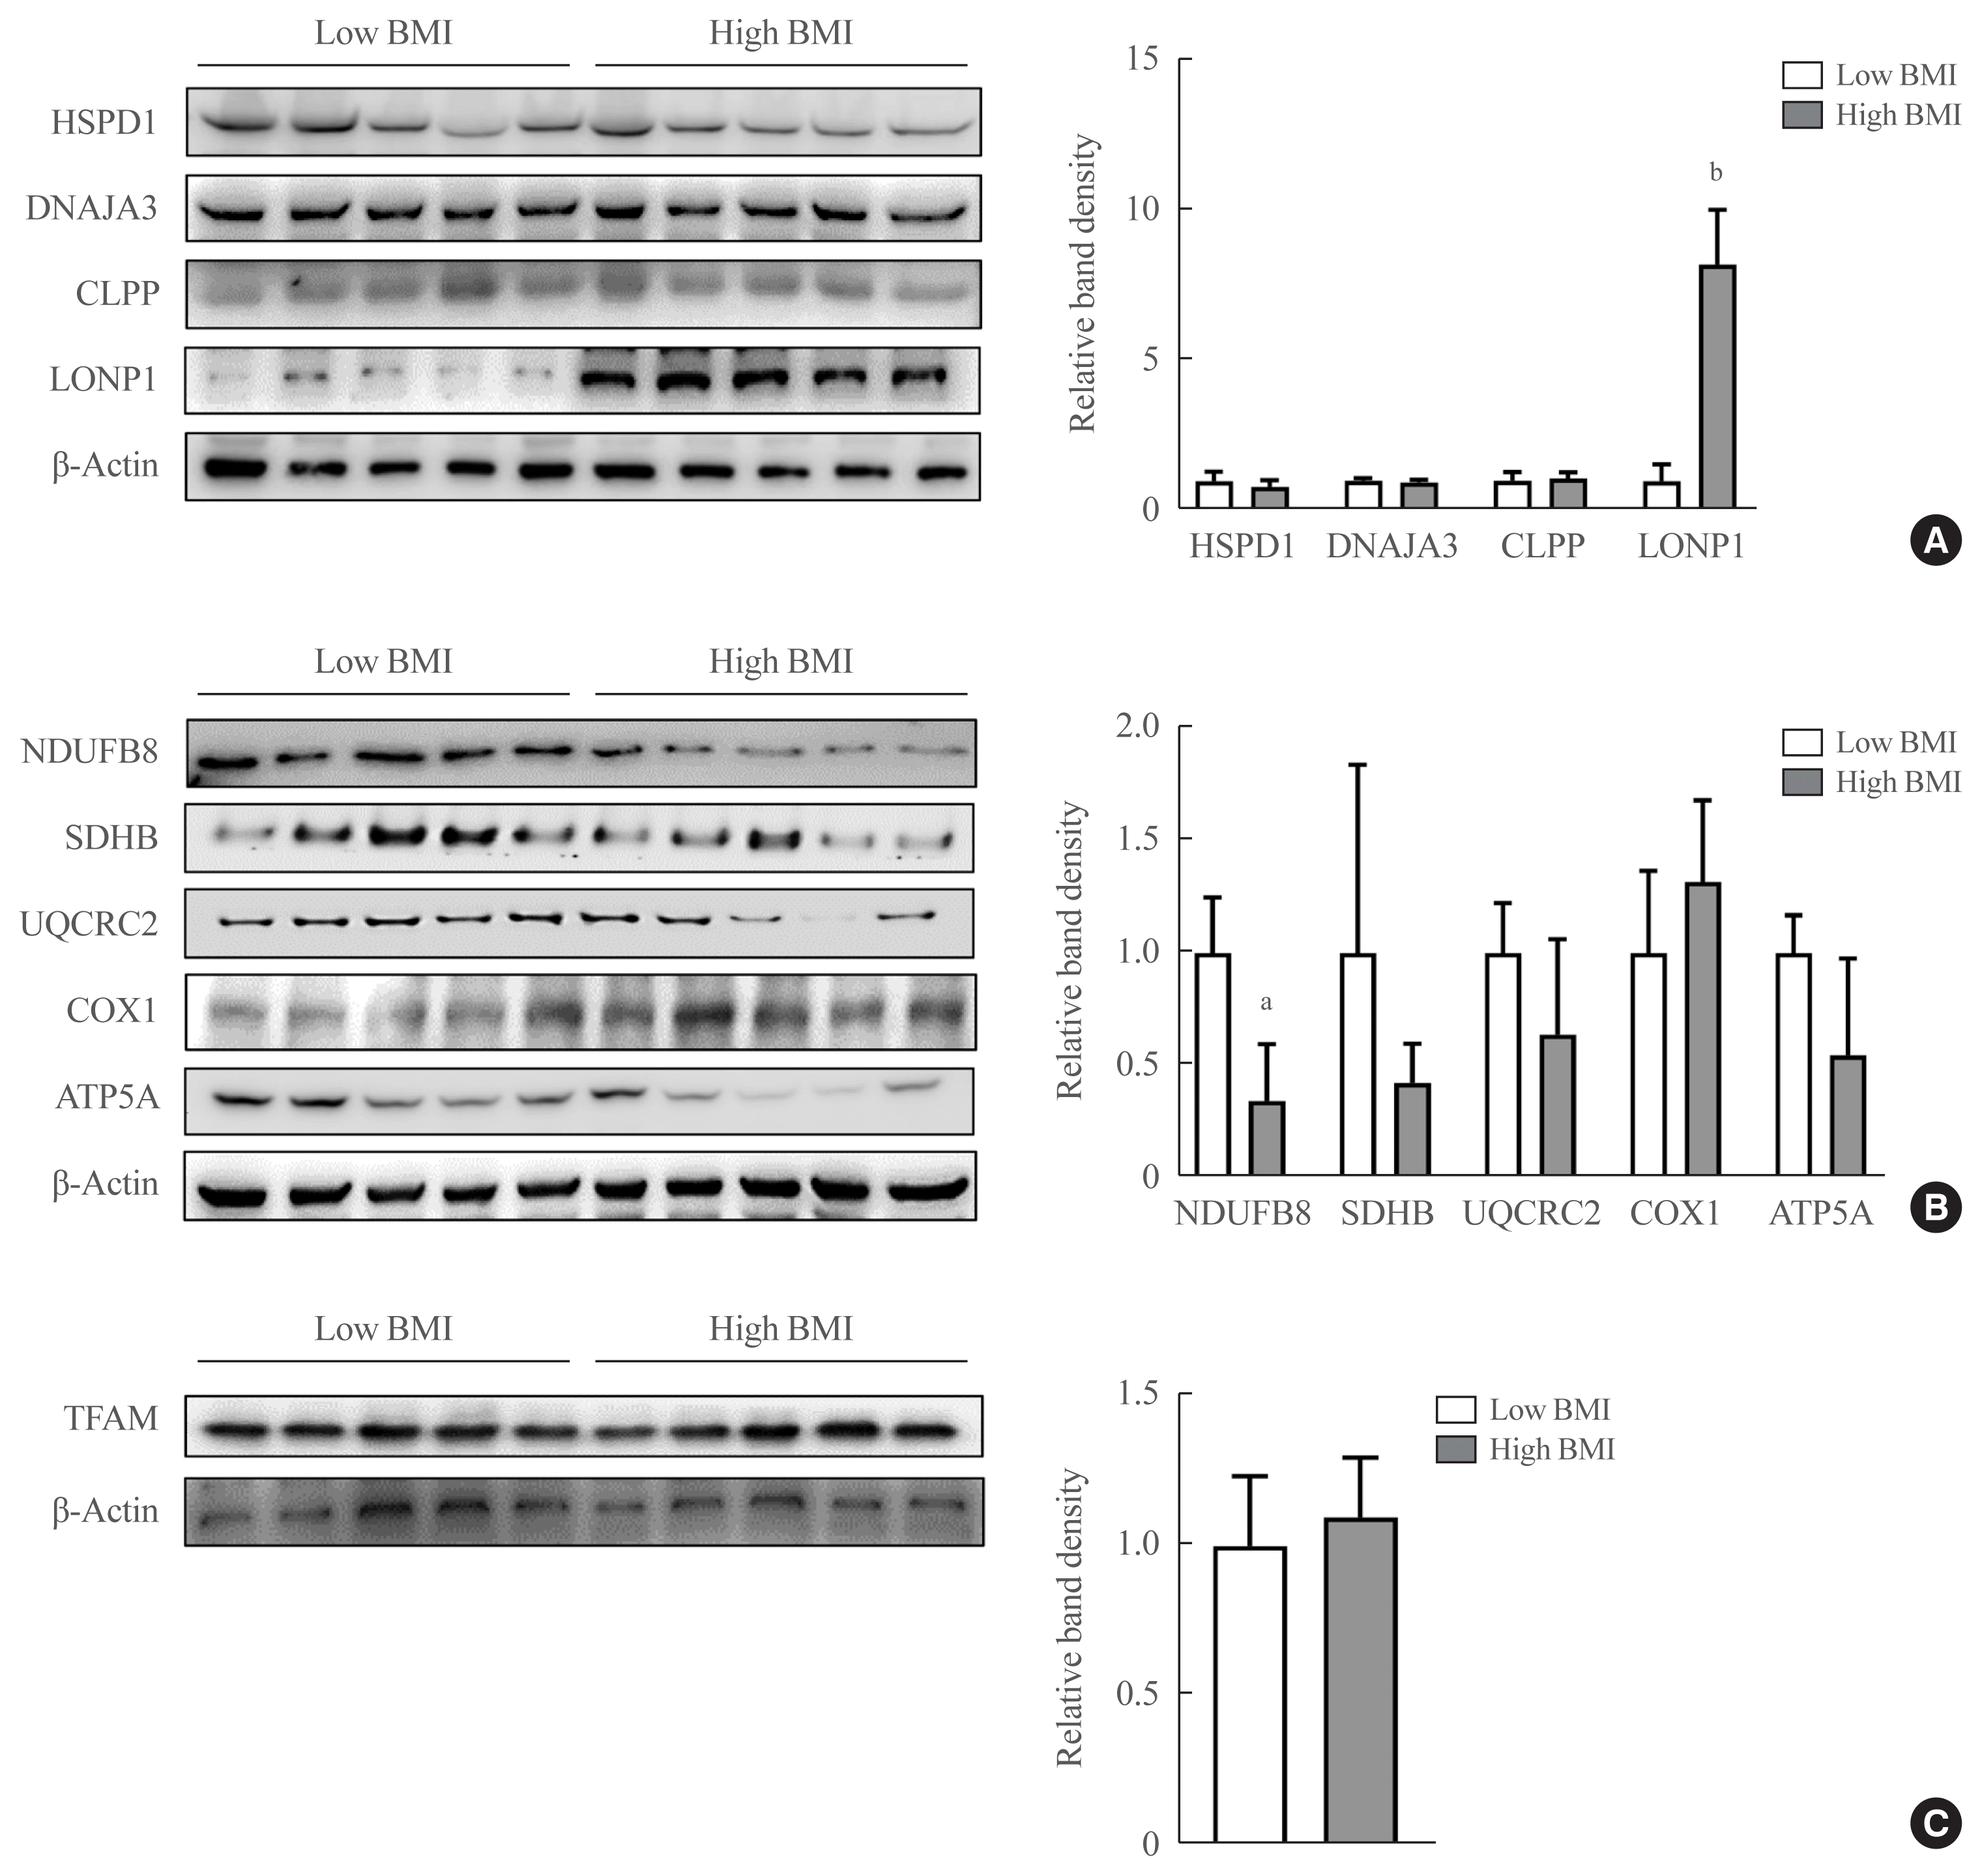
We measured the expression of mitochondrial chaperones, proteases, OXPHOS-complex proteins, and proteins involved in mitochondrial biogenesis in VAT of the five participants with the lowest BMI (mean 18.6 kg/m2, range 17.4 to 19.3 kg/m2) and the five with the highest BMI (mean 29.6 kg/m2, range 27.5 to 31.8 kg/m2). Among the UPRmt proteins, only LONP1 showed a difference in expression, which was significantly higher in the VAT of participants with high BMI (Fig. 2A). Among the OXPHOS-complex proteins, participants with high BMI had significantly lower expression of the OXPHOS complex I protein NDUFB8 than those with low BMI; no other differences in expression were observed (Fig. 2B). Expression of the mitochondrial biogenesis-related protein TFAM was similar in participants with low BMI and those with high BMI (Fig. 2C). LONP1 was therefore the only differentially expressed protein for which a consistent change in mRNA levels occurred in the UPRmt in the VAT of participants with high BMI, suggesting that LONP1 is a marker for nutritional stress in the mitochondria of human VAT.

GTEx gene-set-enrichment analysis of VAT, in relation to LONP1 expression

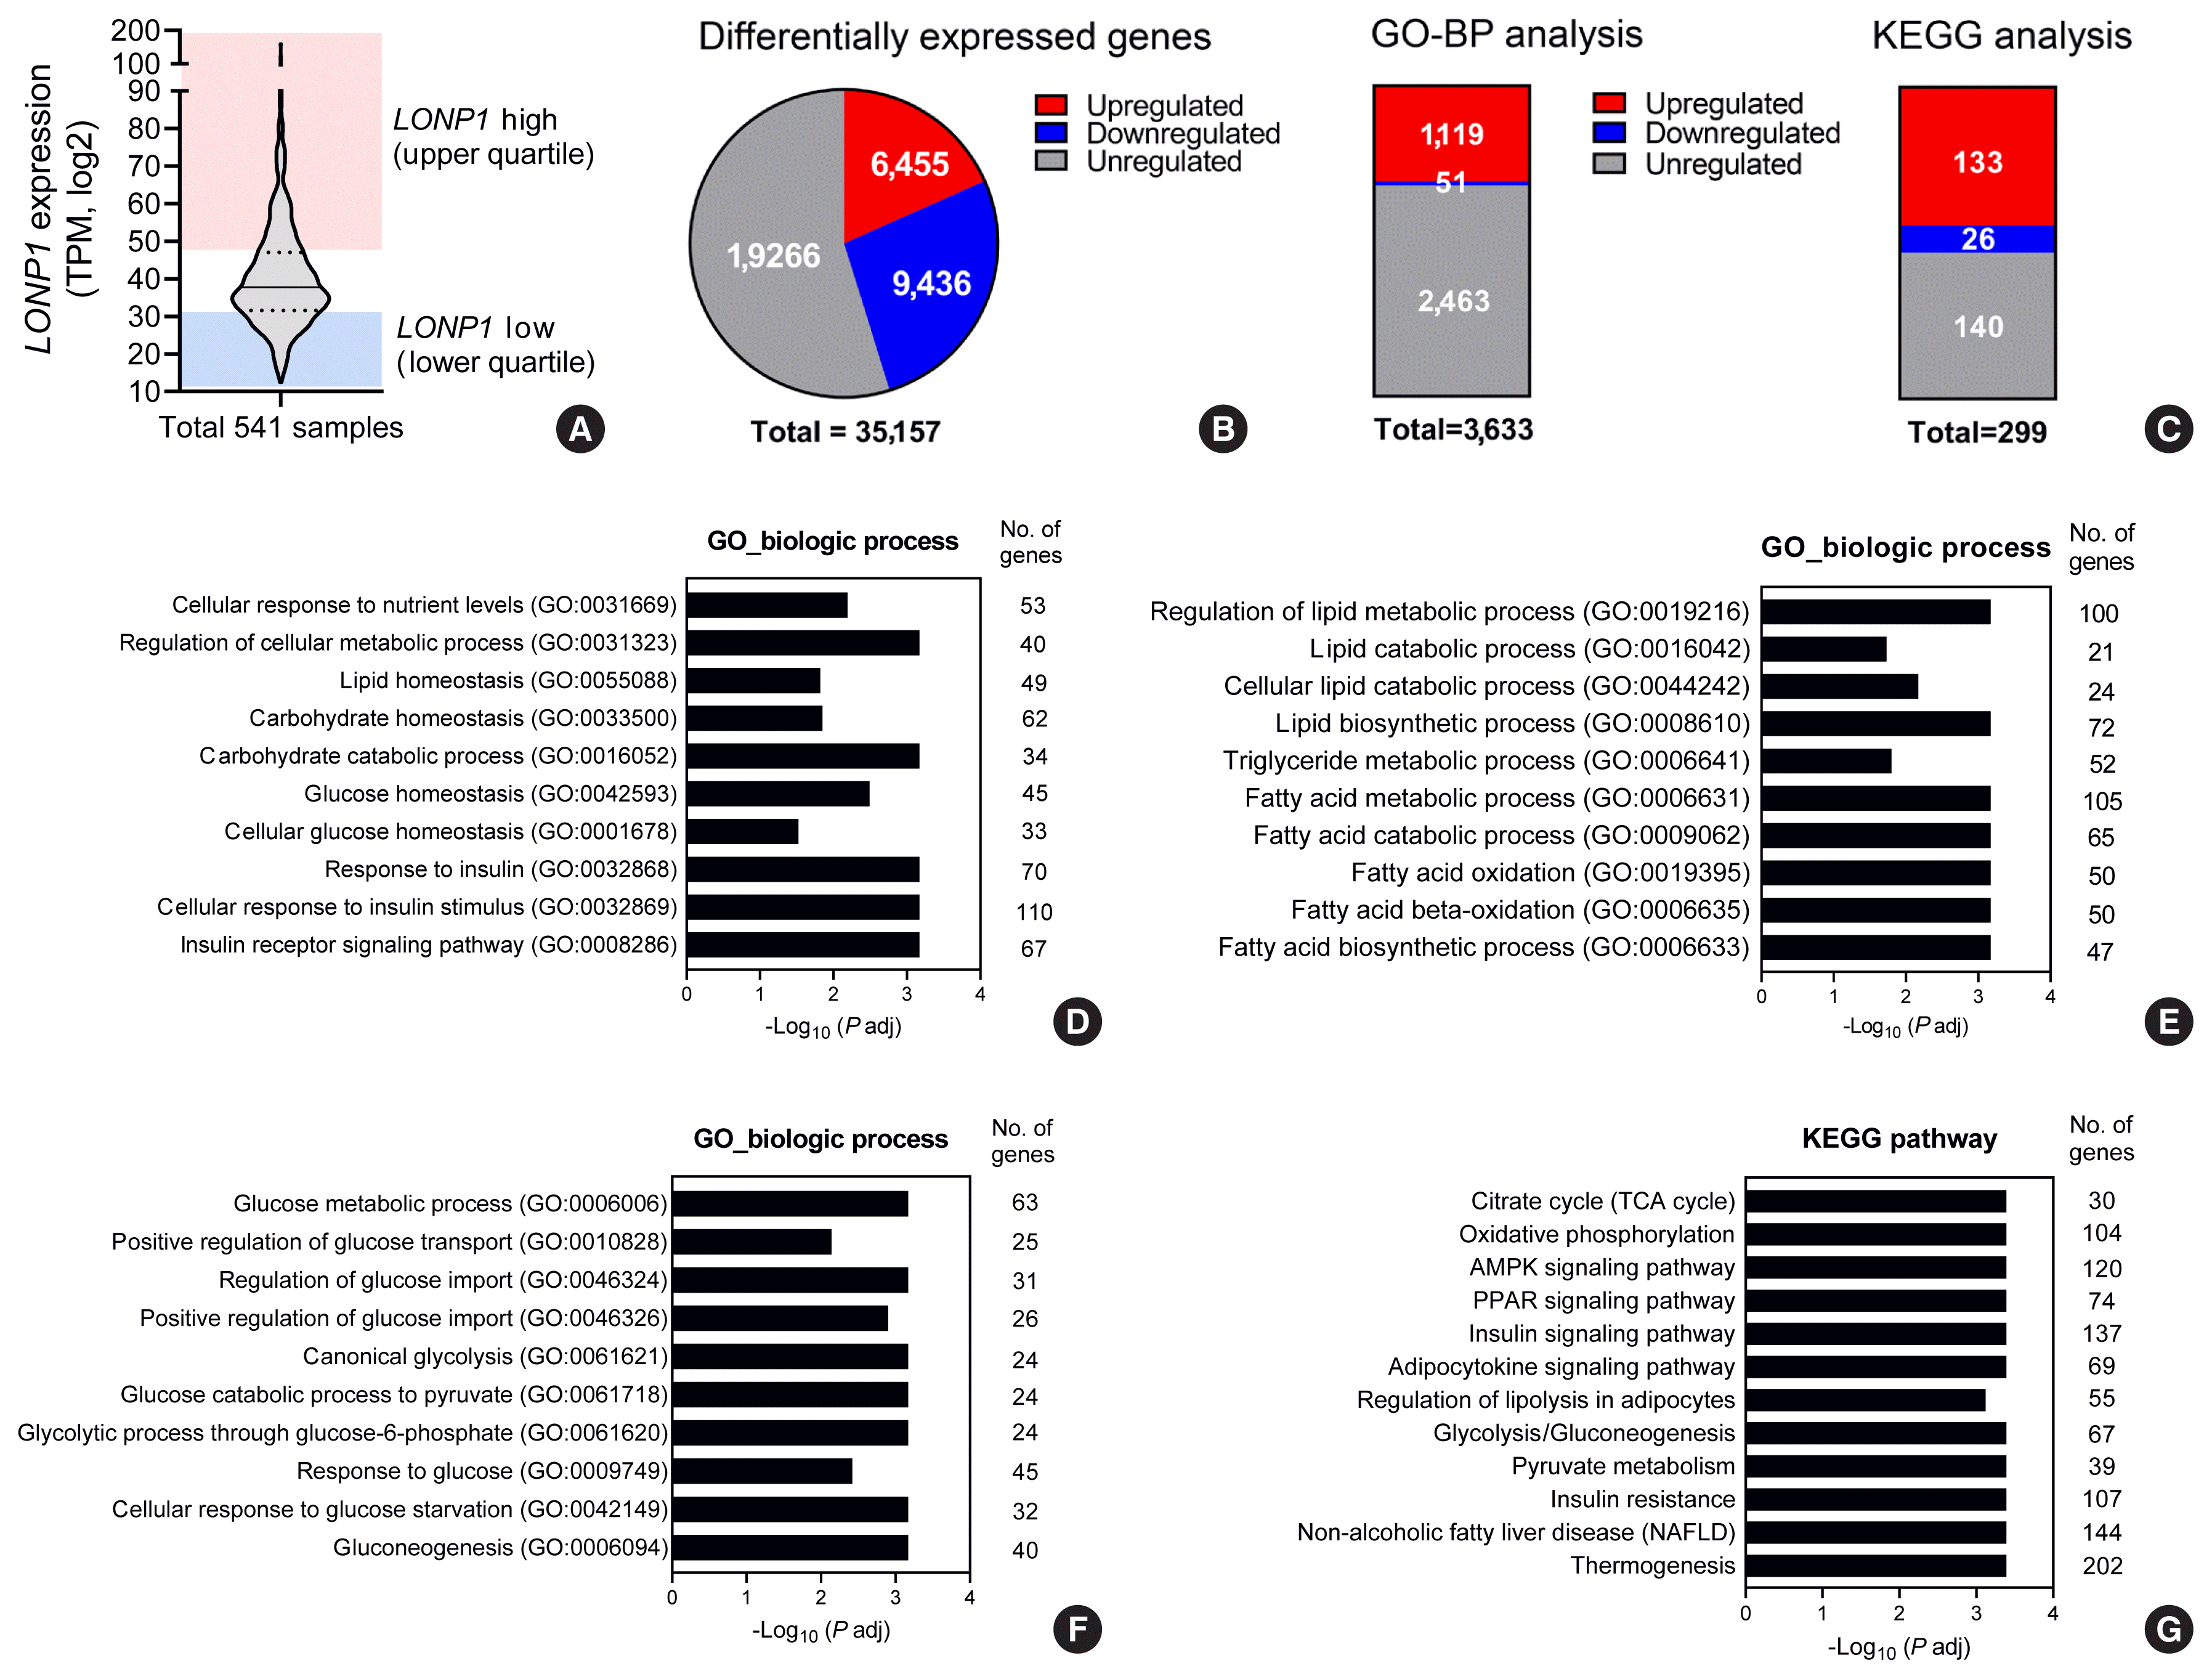
To gain further insight into the relationship between energy metabolism and LONP1 expression in human VAT, gene-enrichment analysis was performed with VAT expression data from the GTEx database, with reference to levels of LONP1 expression. Of the 541 VAT samples in the GTEx database, samples with LONP1 expression levels in the highest quartile (n=134) and the lowest quartile (n=134) were used for GO and KEGG pathway analyses (Fig. 3A). In these samples, 6,455 genes were upregulated in the high-LONP1 group compared with the low-LONP1 group (Fig. 3B). In a GO–biological-process analysis, 1,119 processes were upregulated in the high-LONP1 group compared with the low-LONP1 group (Fig. 3C). Among the significantly upregulated processes were cellular response to nutrient level, lipid homeostasis, carbohydrate and glucose homeostasis, and response to insulin (Fig. 3D). In addition, genes involved in regulation of the lipid metabolic process, fatty acid metabolic process, and fatty acid oxidation were upregulated in the VAT of individuals with higher LONP1 expression (Fig. 3E), as were genes involved in the glucose metabolic process and response to glucose (Fig. 3F).
In the KEGG analysis, 133 pathways were upregulated in the VAT of the high-LONP1 group compared with the low-LONP1 group (Fig. 3C), including pathways related to the citrate cycle, OXPHOS, insulin signaling pathway, regulation of lipolysis in adipocytes, and insulin resistance (Fig. 3G). These results indicate that LONP1 expression in human VAT is associated with metabolic regulation involving processes such as the TCA cycle, and glucose and lipid metabolism.

Murine metabolic phenotype according to the Lonp1 expression level of WAT in BXD RI mouse strain

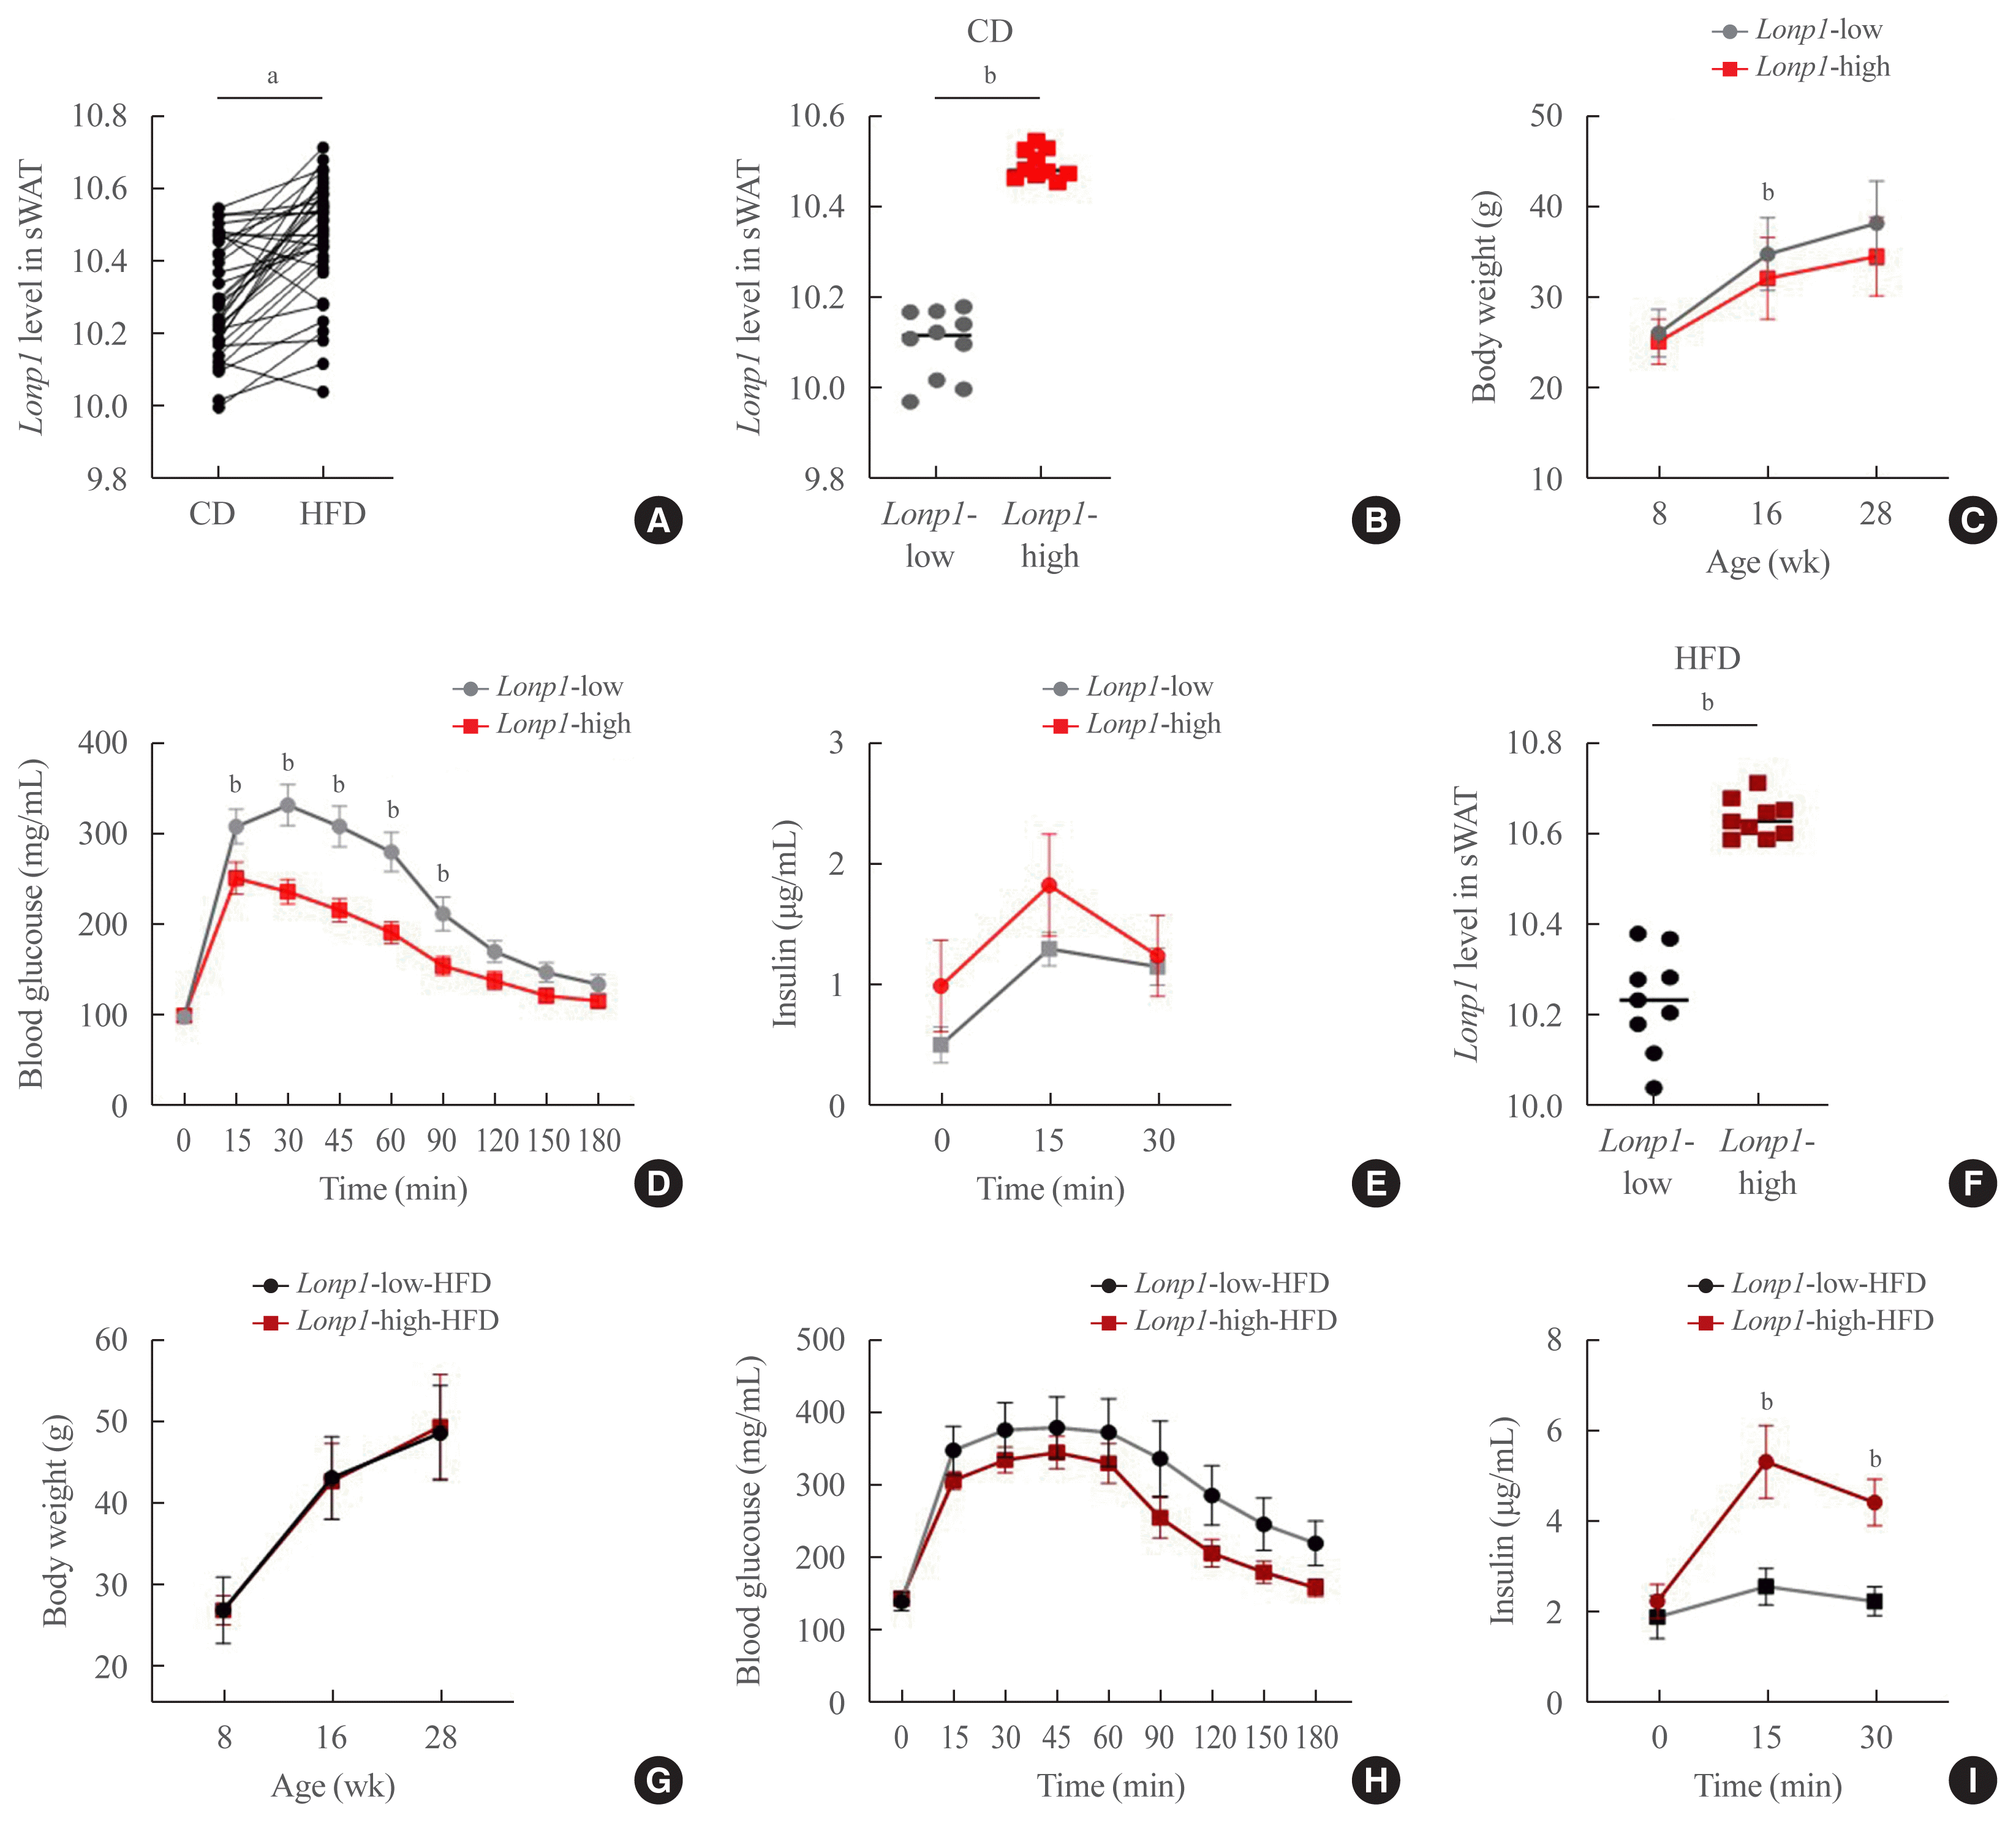
To attempt to validate the physiological role of LONP1, we analyzed phenotypic data in the BXD RI mouse strain database according to Lonp1 expression in the sWAT (data for VAT were not available). Lonp1 expression was significantly higher in the sWAT of mice that were fed a high-fat diet than in the corresponding mice that were fed a chow diet (Fig. 4A), which was consistent with the high LONP1 expression that we observed in the VAT of individuals with high BMI. In comparisons between chow-fed BXD strains in the highest quartile for Lonp1 expression in sWAT (Lonp1-high) and those in the lowest quartile (Lonp1-low), body weight was significantly lower in the Lonp1-high group at 16 weeks old, and blood glucose was significantly lower in the Lonp1-high group during OGTT at 17 weeks old, although insulin levels during OGTT did not differ significantly (Fig. 4B–E). In comparisons between high-fat-diet-fed mice in the highest quartile for Lonp1 expression in sWAT (Lonp1-high-HFD) and those in the lowest quartile (Lonp1-low-HFD), body weight and blood glucose did not differ between the groups (Fig. 4F–H), but the insulin level during OGTT was more than twofold higher in the Lonp1-high-HFD group than in Lonp1-low-HFD mice (Fig. 4I). Therefore, Lonp1 expression in murine sWAT was related to systemic glucose metabolism, which was consistent with the results of the human VAT GTEx gene analysis. On the other hands, the lipid profiles including free fatty acids, high-density lipoprotein, low-density lipoprotein, triglycerides and cholesterol, were not significantly different according to Lonp1-expression level in the both chow and high fat diet BXD RI mouse strain (data not shown).

DISCUSSION

Mitochondria play an essential role in energy homeostasis and have evolved to respond to nutritional status [17]. Therefore, mitochondrial homeostatic responses are expected in conditions such as obesity, chronic overnutrition, and starvation. In this study, we found that, among human genes that are involved in UPRmt (which is a central part of the mitohormetic response) in VAT, LONP1 expression is associated with obesity. Furthermore, bioinformatics analysis of the GTEx database demonstrated that high levels of expression of LONP1 were associated with upregulation of lipid and glucose metabolism in human VAT. Similarly, mice with high levels of Lonp1 gene expression in sWAT had better glucose-tolerance profiles than those with low Lonp1 expression.
Mitochondrial quality control is a process that operates in response to mitochondrial stress [4]. Different quality control mechanisms are activated depending on the type and duration of the stress, thereby maintaining mitochondrial function. Characterization of the quality control network is important to further our understanding of complex biological processes such as obesity and related metabolic diseases. Previous results have demonstrated the effect of UPRmt signaling components on metabolic phenotype [18]. OXPHOS-complex inhibition in skeletal muscle and adipose tissue activates UPRmt in those tissues, and is associated with protection against obesity and insulin resistance in a mouse model [19,20]. Here, we investigated the expression of both mitochondrial chaperones and proteases in human VAT, which is the primary responsive organ in obesity. Our results showed that LONP1 was significantly upregulated in the VAT of individuals with high BMI, and that it was the only one of the UPRmt genes that we studied that was significantly associated with BMI.
The LONP1, which is a member of the highly conserved AAA+ superfamily, is involved in protein quality control in the mitochondrial matrix, which it achieves by degrading misfolded or oxidized polypeptides, and it is one of the principal components of the UPRmt [21,22]. An association between LONP1 and metabolic disorders has been shown by the presence of low levels of LONP1 expression in the livers of diabetic db/db mice [23], and by the fact that a reduction in LONP1 expression causes impairment of insulin signaling and elevation of expression of gluconeogenic enzymes in human liver cells [23]. In the present study, we showed that LONP1 expression was significantly higher in the VAT of individuals with high BMI than in those with low BMI. Furthermore, high LONP1 expression was related to upregulation of lipid and glucose metabolism in the GTEx database. These results suggested that the mitochondrial matrix protease LONP1 of the VAT, in response to a high-nutrient state in obesity, modulates systemic glucose metabolism. We also showed that glucose tolerance was associated with Lonp1 expression in the sWAT in BXD RI mice. However, we could not show correlation between Lonp1 expression of VAT and serum glucose, lipid profiles and HOMA-IR, because those were not much different among the participants who have normal glucose tolerance in this study.
In human VAT, we found that mtDNA count and expression of genes related to the OXPHOS complex and mitochondrial biogenesis were generally not significantly associated with BMI, although UQCRC2 mRNA level and NDUFB8 protein level were lower in the VAT of individuals with high BMI than in those with low BMI. In previous studies, the relation between mitochondrial gene expression of human WAT with obesity has varied according to the depot studied, the presence or absence of type 2 diabetes mellitus, and the methods of gene-expression analysis used [2426]. In one study, global downregulation of mitochondrial oxidative pathways, mtDNA levels, and expression of proteins of the OXPHOS machinery was identified in the subcutaneous adipose tissue of individuals with high BMI relative to their lower BMI monozygotic twins [24]. However, in another study, with Affymetrix gene profiling, none of the genes of the electron-transport chain were downregulated in the visceral fat of healthy obese women compared with healthy non-obese women [25]. In a mitochondrial functional analysis, oxygen-consumption rates and citrate-synthase activity were significantly lower in adipocytes from obese individuals than from those who were not obese, although adipocyte mitochondrial content did not significantly differ [27]. Our results contribute to the existing body of evidence, identifying elevation of LONP1 as a response to metabolic stress in obesity.
We found that LONP1 expression in VAT did not correlate with expression of OXPHOS-complex genes or with mtDNA count. However, LONP1 expression was closely associated with systemic energy metabolism in the GTEx analysis. We also found that Lonp1 expression was higher in the sWAT of BXD RI mice on high-fat diets than in those on chow diets, which was consistent with our findings in human VAT. Furthermore, mouse strains with high Lonp1 expression in subcutaneous tissue had better systemic glucose metabolic profiles than those with low Lonp1 expression. Therefore, elevation of LONP1 expression in the human VAT in obesity could be a homeostatic mechanism for preservation of mitochondrial function and systemic metabolism as well as the glucose metabolism.
Some limitation should be noted in this study. First, we did not analyze the correlation of Lonp1 expression in VAT with the BMI as well as gender and age in the GTEx dataset, because phenotypic data are not freely available. Second, we analyzed murine metabolic phenotypes in relation to Lonp1 expression in the sWAT of BXD RI mouse strains, although sWAT is somewhat different from VAT in the metabolic profiles [28]. The data for VAT were not available in the BXD RI mouse strain database.
In conclusion, we found that mitochondrial LONP1, which is involved in mitochondrial quality control in response to stress, showed differential expression in VAT that was dependent upon BMI. Moreover, high LONP1 expression in VAT was associated with enhancement of glucose and lipid metabolism in a bioinformatics analysis.

Supplementary Information

Supplemental Table S1.
Primer Sequence
enm-2021-1023-suppl1.pdf
Supplemental Material S1.
The Full List of Significantly Enriched Pathways in Gene Ontology (GO) and Kyoto Encyclopedia of Genes and Genomes (KEGG) Pathway Analysis Obtained from Genotype-Tissue Expression (GTEx) Datasets
enm-2021-1023-suppl2.xlsx

Notes

CONFLICTS OF INTEREST

No potential conflict of interest relevant to this article was reported.

AUTHOR CONTRIBUTIONS

Conception or design: J.H.L., S.B.J. Acquisition, analysis, or interpretation of data: J.H.L., S.B.J., S.E.L., J.E.K., J.T.K., Y.E.K., S.G.K., H.S,Y., Y.B.K., K.H.L., B.J.K., M.S., H.J.K. Drafting the work or revising: J.H.L., S.B.J., M.S., H.J.K. Final approval of the manuscript: J.H.L., S.B.J., H.J.K.

ACKNOWLEDGMENTS

This work was supported by the 2017S-Hyangseol grant (Ju Hee Lee) from Korean Diabetes Association, Korea. Ju Hee Lee was supported by the Basic Science Research Program, through the National Research Foundation of Korea (NRF) by the Ministry of Science, ICT (NRF-2020R1C1C1003269), Korea.

REFERENCES

1. Sun K, Kusminski CM, Scherer PE. Adipose tissue remodeling and obesity. J Clin Invest. 2011; 121:2094–101.
crossref
2. Kusminski CM, Scherer PE. Mitochondrial dysfunction in white adipose tissue. Trends Endocrinol Metab. 2012; 23:435–43.
crossref
3. Ozcan U, Cao Q, Yilmaz E, Lee AH, Iwakoshi NN, Ozdelen E, et al. Endoplasmic reticulum stress links obesity, insulin action, and type 2 diabetes. Science. 2004; 306:457–61.
crossref
4. Held NM, Houtkooper RH. Mitochondrial quality control pathways as determinants of metabolic health. Bioessays. 2015; 37:867–76.
crossref
5. Moehle EA, Shen K, Dillin A. Mitochondrial proteostasis in the context of cellular and organismal health and aging. J Biol Chem. 2019; 294:5396–407.
crossref
6. Melber A, Haynes CM. UPRmt regulation and output: a stress response mediated by mitochondrial-nuclear communication. Cell Res. 2018; 28:281–95.
crossref
7. Mottis A, Jovaisaite V, Auwerx J. The mitochondrial unfolded protein response in mammalian physiology. Mamm Genome. 2014; 25:424–33.
crossref
8. Jovaisaite V, Mouchiroud L, Auwerx J. The mitochondrial unfolded protein response, a conserved stress response pathway with implications in health and disease. J Exp Biol. 2014; 217(Pt 1):137–43.
crossref
9. Lee JH, Kim JM, Choi MJ, Kang YE, Joung KH, Yi HS, et al. Clinical implications of UCP1 mRNA expression in human cervical adipose tissue under physiological conditions. Obesity (Silver Spring). 2018; 26:1008–16.
10. Kang YE, Kim JM, Joung KH, Lee JH, You BR, Choi MJ, et al. The roles of adipokines, proinflammatory cytokines, and adipose tissue macrophages in obesity-associated insulin resistance in modest obesity and early metabolic dysfunction. PLoS One. 2016; 11:e0154003.
crossref
11. Venegas V, Halberg MC. Measurement of mitochondrial DNA copy number. Methods Mol Biol. 2012; 837:327–35.
crossref
12. Love MI, Huber W, Anders S. Moderated estimation of fold change and dispersion for RNA-seq data with DESeq2. Genome Biol. 2014; 15:550.
crossref
13. Andreux PA, Williams EG, Koutnikova H, Houtkooper RH, Champy MF, Henry H, et al. Systems genetics of metabolism: the use of the BXD murine reference panel for multiscalar integration of traits. Cell. 2012; 150:1287–99.
crossref
14. Williams EG, Wu Y, Jha P, Dubuis S, Blattmann P, Argmann CA, et al. Systems proteomics of liver mitochondria function. Science. 2016; 352:aad0189.
crossref
15. Wu Y, Williams EG, Dubuis S, Mottis A, Jovaisaite V, Houten SM, et al. Multilayered genetic and omics dissection of mitochondrial activity in a mouse reference population. Cell. 2014; 158:1415–30.
crossref
16. World Health Organization. The Asia-Pacific perspective: redefining obesity and its treatment. Geneva: World Health Organization Western Pacific Regional Office;2000.
17. Liesa M, Shirihai OS. Mitochondrial dynamics in the regulation of nutrient utilization and energy expenditure. Cell Metab. 2013; 17:491–506.
crossref
18. Yi HS, Chang JY, Shong M. The mitochondrial unfolded protein response and mitohormesis: a perspective on metabolic diseases. J Mol Endocrinol. 2018; 61:R91–105.
crossref
19. Choi MJ, Jung SB, Lee SE, Kang SG, Lee JH, Ryu MJ, et al. An adipocyte-specific defect in oxidative phosphorylation increases systemic energy expenditure and protects against diet-induced obesity in mouse models. Diabetologia. 2020; 63:837–52.
crossref
20. Chung HK, Ryu D, Kim KS, Chang JY, Kim YK, Yi HS, et al. Growth differentiation factor 15 is a myomitokine governing systemic energy homeostasis. J Cell Biol. 2017; 216:149–65.
crossref
21. Nolden M, Ehses S, Koppen M, Bernacchia A, Rugarli EI, Langer T. The m-AAA protease defective in hereditary spastic paraplegia controls ribosome assembly in mitochondria. Cell. 2005; 123:277–89.
crossref
22. Zurita Rendon O, Shoubridge EA. LONP1 is required for maturation of a subset of mitochondrial proteins, and its loss elicits an integrated stress response. Mol Cell Biol. 2018; 38:e00412–17.
crossref
23. Lee HJ, Chung K, Lee H, Lee K, Lim JH, Song J. Downregulation of mitochondrial lon protease impairs mitochondrial function and causes hepatic insulin resistance in human liver SK-HEP-1 cells. Diabetologia. 2011; 54:1437–46.
crossref
24. Heinonen S, Buzkova J, Muniandy M, Kaksonen R, Ollikainen M, Ismail K, et al. Impaired mitochondrial biogenesis in adipose tissue in acquired obesity. Diabetes. 2015; 64:3135–45.
crossref
25. Dahlman I, Forsgren M, Sjogren A, Nordstrom EA, Kaaman M, Naslund E, et al. Downregulation of electron transport chain genes in visceral adipose tissue in type 2 diabetes independent of obesity and possibly involving tumor necrosis factor-alpha. Diabetes. 2006; 55:1792–9.
26. Qatanani M, Tan Y, Dobrin R, Greenawalt DM, Hu G, Zhao W, et al. Inverse regulation of inflammation and mitochondrial function in adipose tissue defines extreme insulin sensitivity in morbidly obese patients. Diabetes. 2013; 62:855–63.
crossref
27. Yin X, Lanza IR, Swain JM, Sarr MG, Nair KS, Jensen MD. Adipocyte mitochondrial function is reduced in human obesity independent of fat cell size. J Clin Endocrinol Metab. 2014; 99:E209–16.
crossref
28. Wajchenberg BL. Subcutaneous and visceral adipose tissue: their relation to the metabolic syndrome. Endocr Rev. 2000; 21:697–738.
crossref

Fig. 1
Visceral adipose tissue expression of genes encoding proteins of the oxidative phosphorylation (OXPHOS) complex, mitochondrial chaperones, and proteases in relation to body mass index (BMI). Relative mRNA expression of genes of the OXPHOS complex (A) and mitochondrial biogenesis (B) in the visceral adipose tissue between a group with BMI <23 kg/m2 (n=26) and a group with BMI ≥23 kg/m2 (n=26). Gene expression relative to the mean level in the group with BMI <23 kg/m2 was determined for each sample by real-time polymerase chain reaction. (C) Relative mitochondrial DNA (mtDNA) content. (D) Malondianldehyde concentration. (E) Relative mRNA expression of genes encoding mitochondrial chaperones and proteases. (F) Correlation between Lon peptidase 1, mitochondrial (LONP1) mRNA expression in the visceral adipose tissue and BMI. Relative mRNA expression is presented as mean±standard error of the mean. P values were calculated by the Mann-Whitney U test. NDUFA9, NADH:ubiquinone oxidoreductase subunit A9; SDHB, NADH dehydrogenase (ubiquinone) 1 beta subcomplex subunit 8, mitochondrial; UQCRC2, ubiquinol-cytochrome-c reductase complex core protein 2; COX2, cytochrome c oxidase subunit II; ATP5A1A, ATP synthase F1 subunit alpha; PPARGC1A, PPARG coactivator 1 alpha; TFAM, transcription factor A, mitochondrial; HSPD1, heat shock protein family D (Hsp60) member 1; DNAJA3, DnaJ heat shock protein family (Hsp40) member A3; CLPP, caseinolytic mitochondrial matrix peptidase proteolytic subunit; YME1L1, YME1 like 1 ATPase; HTRA2, HtrA serine peptidase 2; USP30, ubiquitin specific peptidase 30. aP<0.01.
enm-2021-1023f1.gif
Fig. 2
Expression of proteins of the oxidative phosphorylation (OXPHOS) complex, transcription factors, mitochondrial chaperones, and proteases in human visceral adipose tissue. (A) Expression of mitochondrial chaperones and proteases in visceral adipose tissue of the five participants with the lowest body mass index (BMI; low BMI: mean, 18.6 kg/m2; range, 17.4 to 19.3 kg/m2) and the five with the highest BMI (high BMI: mean, 29.6 kg/m2; range, 27.5 to 31.8 kg/m2). (B) Expression of proteins of the OXPHOS complex. (C) Expression of transcription factor A, mitochondrial (TFAM). Western blot band density relative to β-actin of each sample is calculated and presented as mean±standard error of the mean (n=5). P values were calculated by the Mann-Whitney U test. HSPD1, 60 kDa heat shock protein, mitochondrial; DNAJA3, DnaJ heat shock protein family (Hsp40) member A3; CLPP, caseinolytic mitochondrial matrix peptidase proteolytic subunit; LONP1, Lon protease homolog, mitochondrial; NDUFB8, NADH dehydrogenase (ubiquinone) 1 beta subcomplex subunit 8, mitochondrial (OXPHOS complex I); SDHB, succinate dehydrogenase (ubiquinone) iron-sulfur subunit, mitochondrial (OXPHOS complex II); UQCRC2, ubiquinol-cytochrome-c reductase complex core protein 2 (OXPHOS complex III); COX1, cytochrome c oxidase subunit 1 (OXPHOS complex IV); ATP5A1A, ATP synthase F1 subunit alpha (OXPHOS complex V). aP<0.01; bP<0.001.
enm-2021-1023f2.gif
Fig. 3
Upregulation of physiological pathways in visceral adipose tissue with high expression of Lon protease homolog, mitochondrial (LONP1) in the Genotype-Tissue Expression Database. (A) LONP1 expression levels in 541 human visceral adipose tissue samples in the UCSC database. (B) Numbers of differentially expressed genes in a comparison of the samples in the highest quartile for LONP1 expression (n=134) and those in the lowest quartile (n=134). (C) Association of differential LONP1 expression with Gene Ontology (GO) biological processes (GO-BP) and Kyoto Encyclopedia of Genes and Genomes (KEGG) pathways. (D, E, F, G) Upregulated biological processes in the GO annotation or KEGG pathway analysis. TPM, transcripts per million.
enm-2021-1023f3.gif
Fig. 4
Metabolic phenotypes in BXD mouse strains in relation to Lon protease homolog, mitochondrial (Lonp1) expression. (A) Lonp1 expression level in the subcutaneous white adipose tissue (sWAT) according to diet. (B) Comparison of lowest quartile (Lonp1-low) and highest quartile (Lonp1-high) of Lonp1 expression levels in the sWAT of BXD mouse strains with chow diet (CD). (C) Body weight change in BXD mice fed CD. Blood glucose (D) and insulin (E) were measured during the oral glucose-tolerance test (OGTT) in male mice at 17 weeks of age receiving CD. (F) Comparison of lowest quartile (Lonp1-low high-fat diet [HFD]) and highest quartile (Lonp1-high-HFD) of Lonp1 expression levels in the sWAT of BXD mouse strains with HFD. (G) Body weight change in BXD mice fed a HFD. Blood glucose (H) and insulin (I) measured during OGTT in male mice at 17 weeks of age receiving HFD. P values were calculated by t test. aP<0.001; bP<0.05.
enm-2021-1023f4.gif
Table 1
Baseline Characteristics of the Study Participants
Variable BMI <23.0 kg/m2 (n=26) BMI ≥23.0 kg/m2 (n=22) P value
Age, yr 42±5 (31–55) 43±6 (33–55) 0.345
BMI, kg/m2 20.9±1.5 (17.4–23.0) 26.2±2.9 (23.5–33.4) <0.001
Waist circumference, cm 76.4±5.3 (64–84) 88.6±7.1 (79–111) <0.001
Fasting blood glucose, mg/dL 82.7±6.8 (72–97) 88.2±5.9 (75–99) 0.005
Fasting blood insulin, mIU/L 7.0±2.5 (3.3–14.6) 9.5±3.5 (3.5–16.7) 0.005
HOMA-IR 1.4±0.6 (0.6–3.1) 2.1±0.8 (0.8–3.7) 0.003
Triglycerides, mg/dL 91±60 120±76 0.159
Total cholesterol, mg/dL 176±24 186±36 0.288
LDL-C, mg/dL 101±22 112±28 0.123
HDL-C, mg/dL 61±11 55±14 0.080
AST, IU/L 18±8 19±5 0.410
ALT, IU/L 13±4 19±12 0.034
eGFR, mL/min 124±21 118±27 0.453

Values are expressed as mean±standard deviation (range). P values are calculated by Student’s t test or Mann-Whitney U test.

BMI, body mass index; HOMA-IR, homeostatic model assessment of insulin resistance; LDL-C, low-density lipoprotein cholesterol; HDL-C, high-density lipoprotein cholesterol; AST, aspartate aminotransferase activity; ALT, alanine aminotransferase activity; eGFR, estimated glomerular filtration rate.

TOOLS
Similar articles