Abstract
Background
Methods
Results
REFERENCES
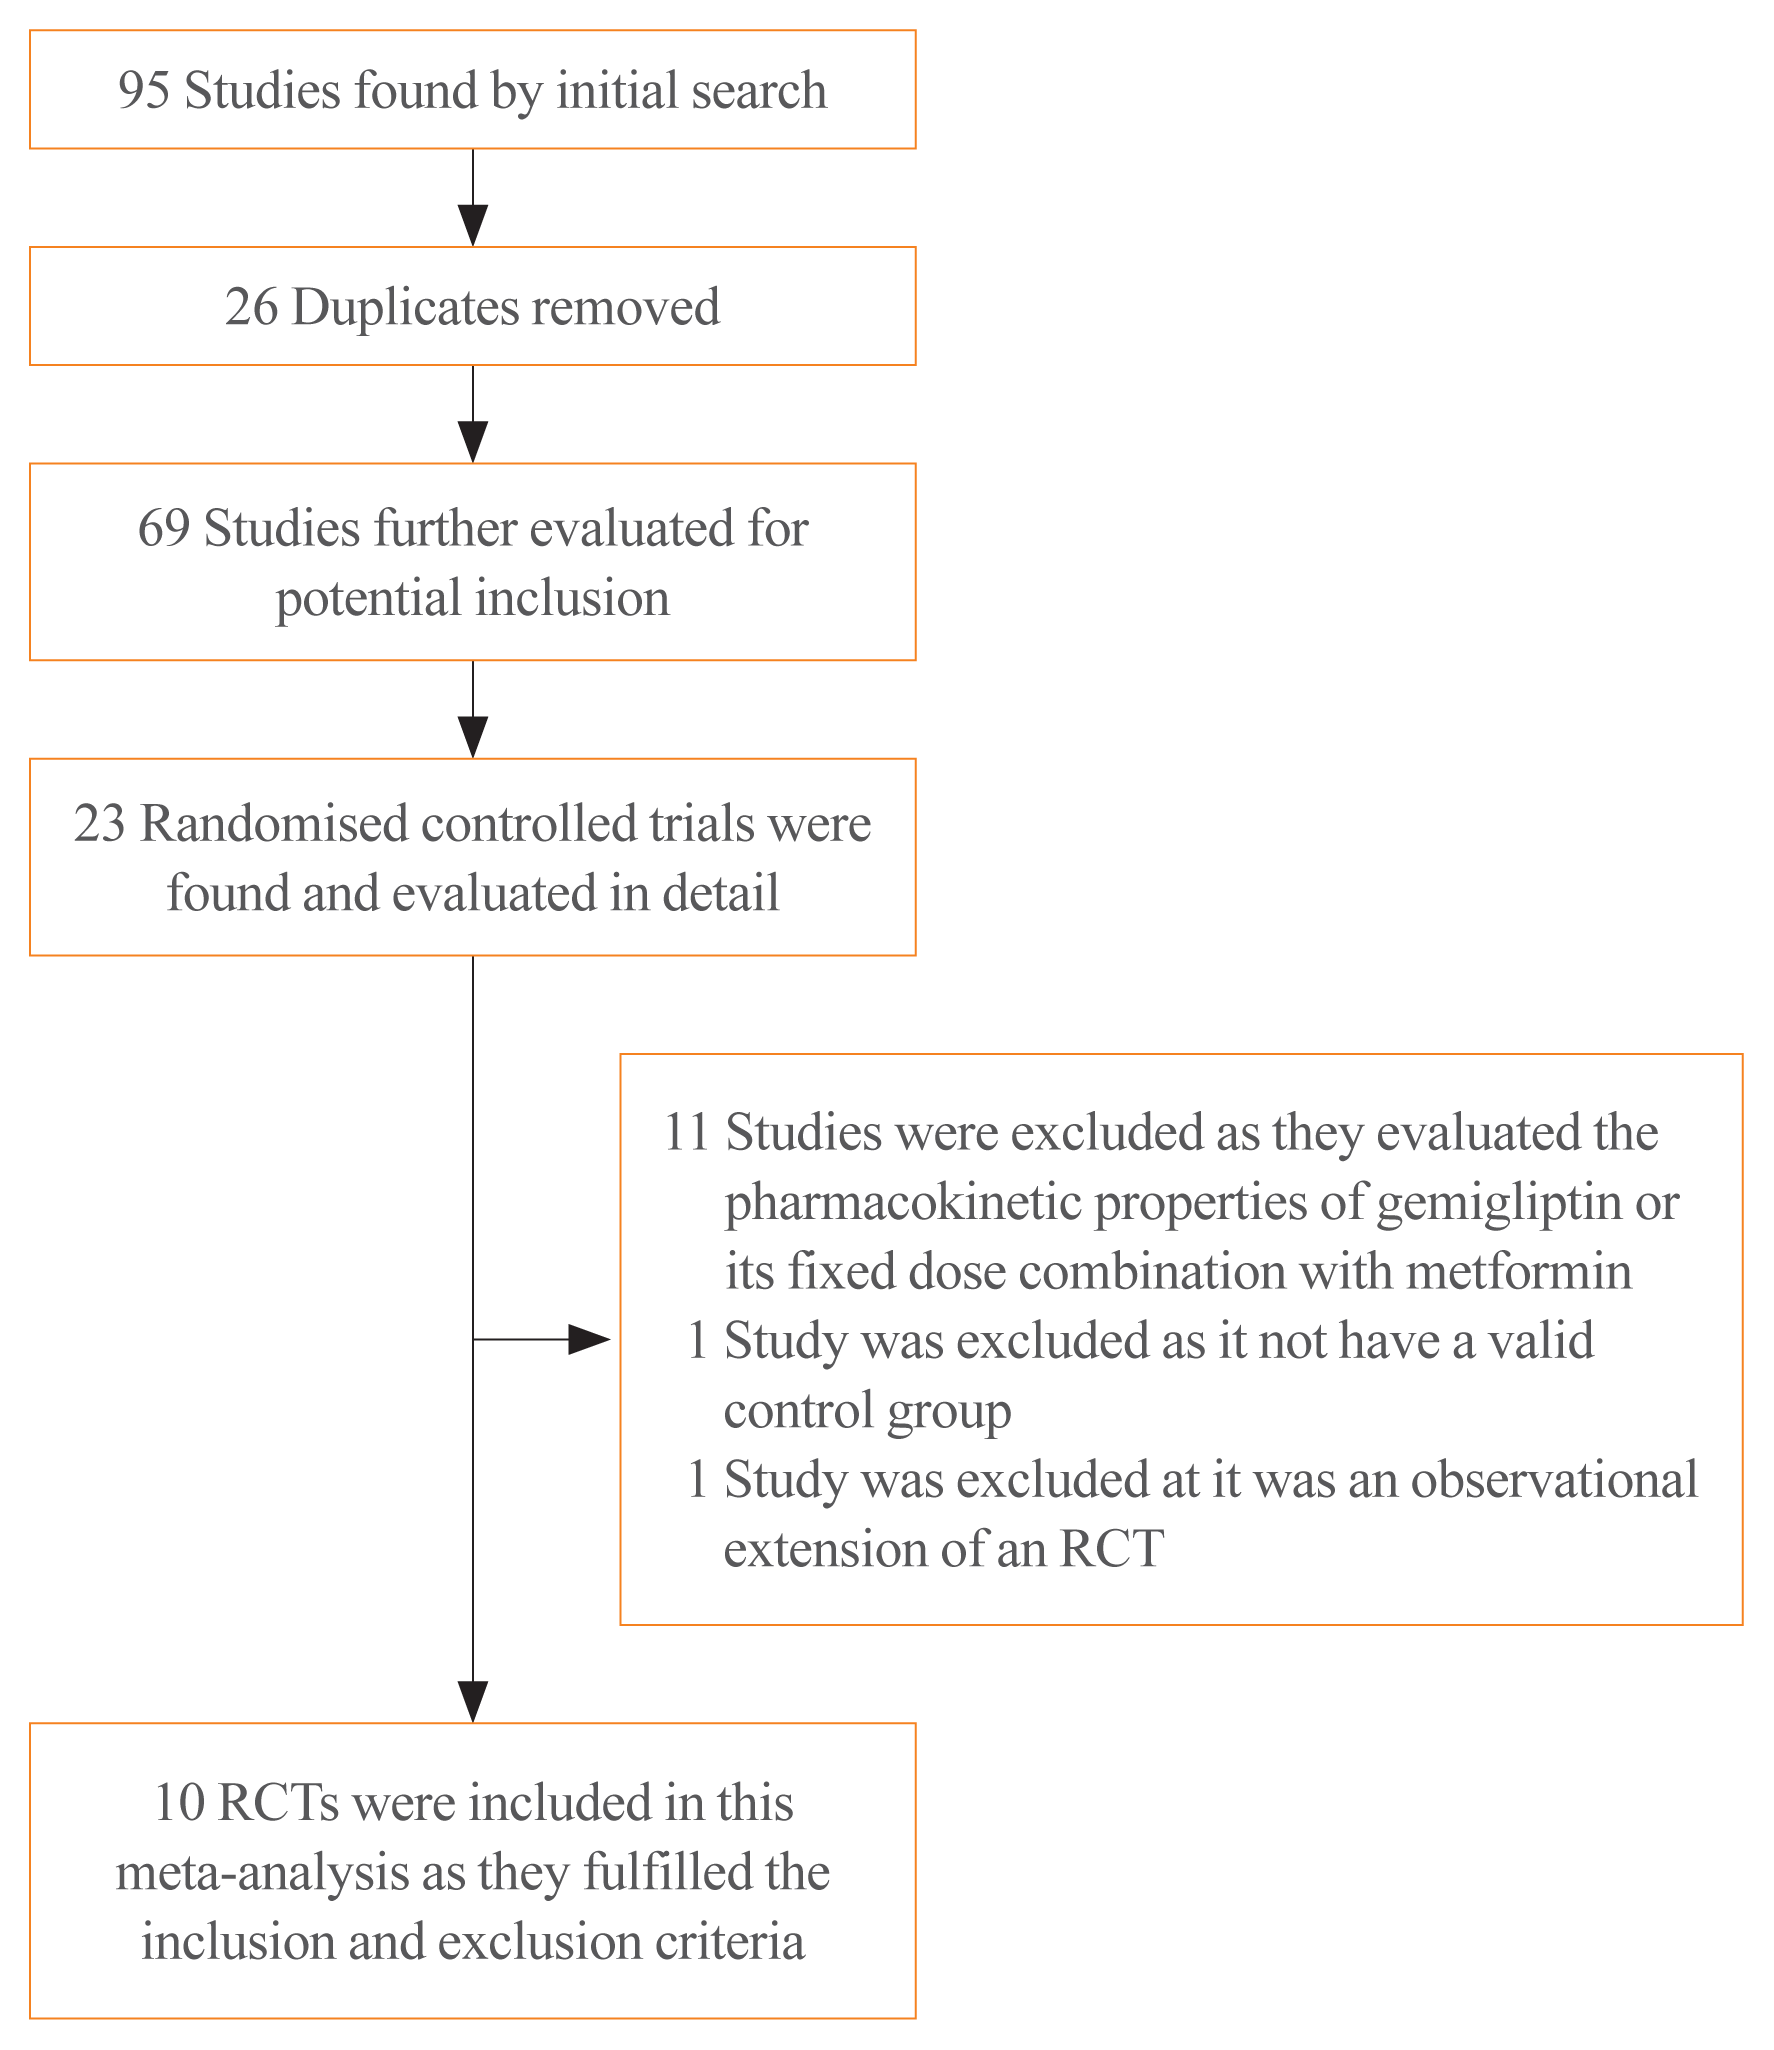
Fig. 1

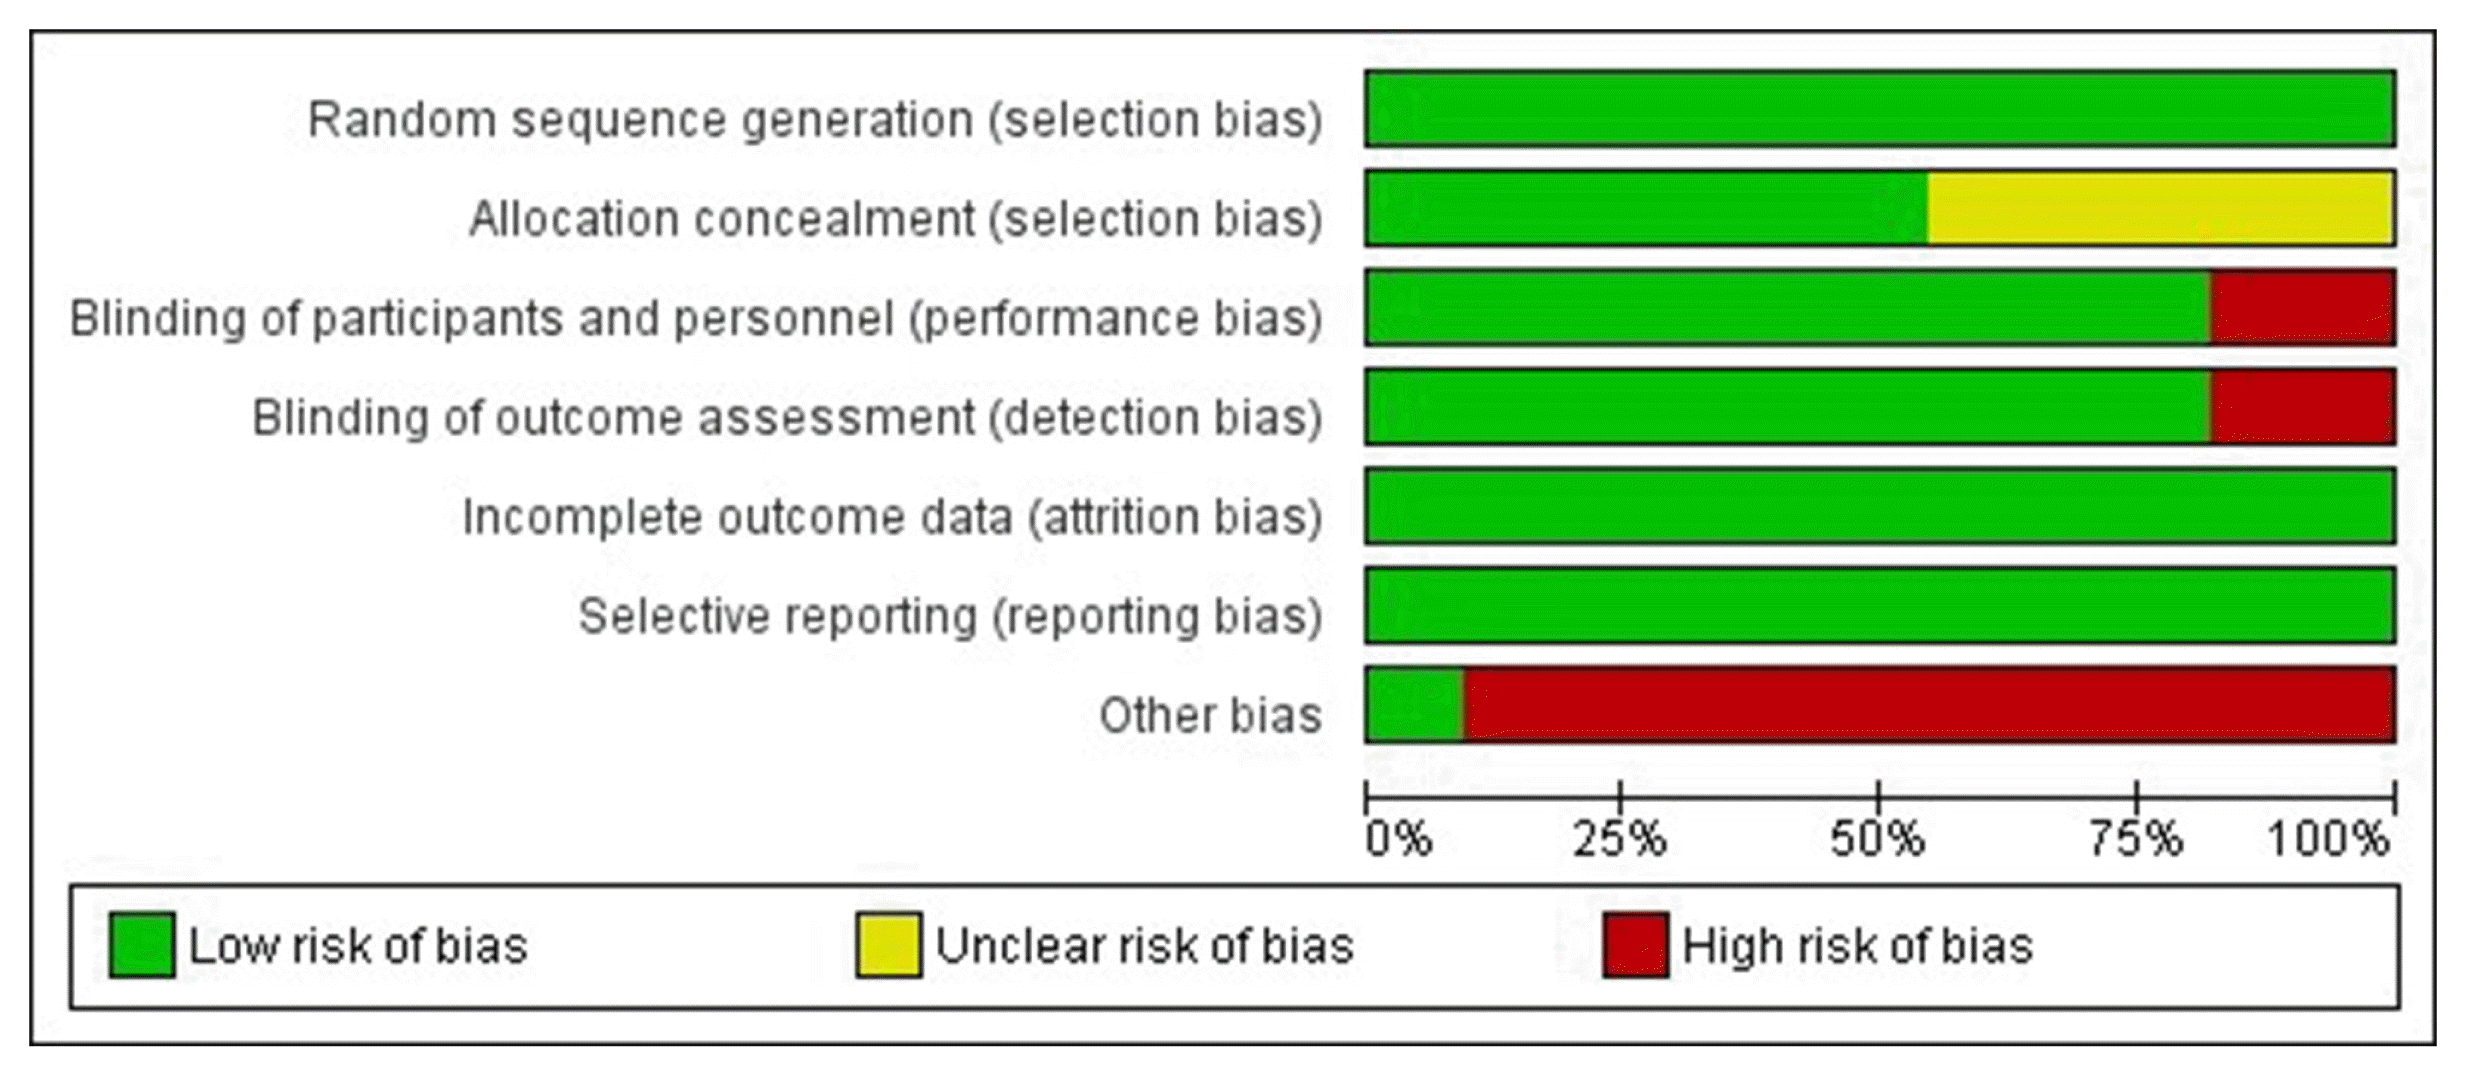
Fig. 2

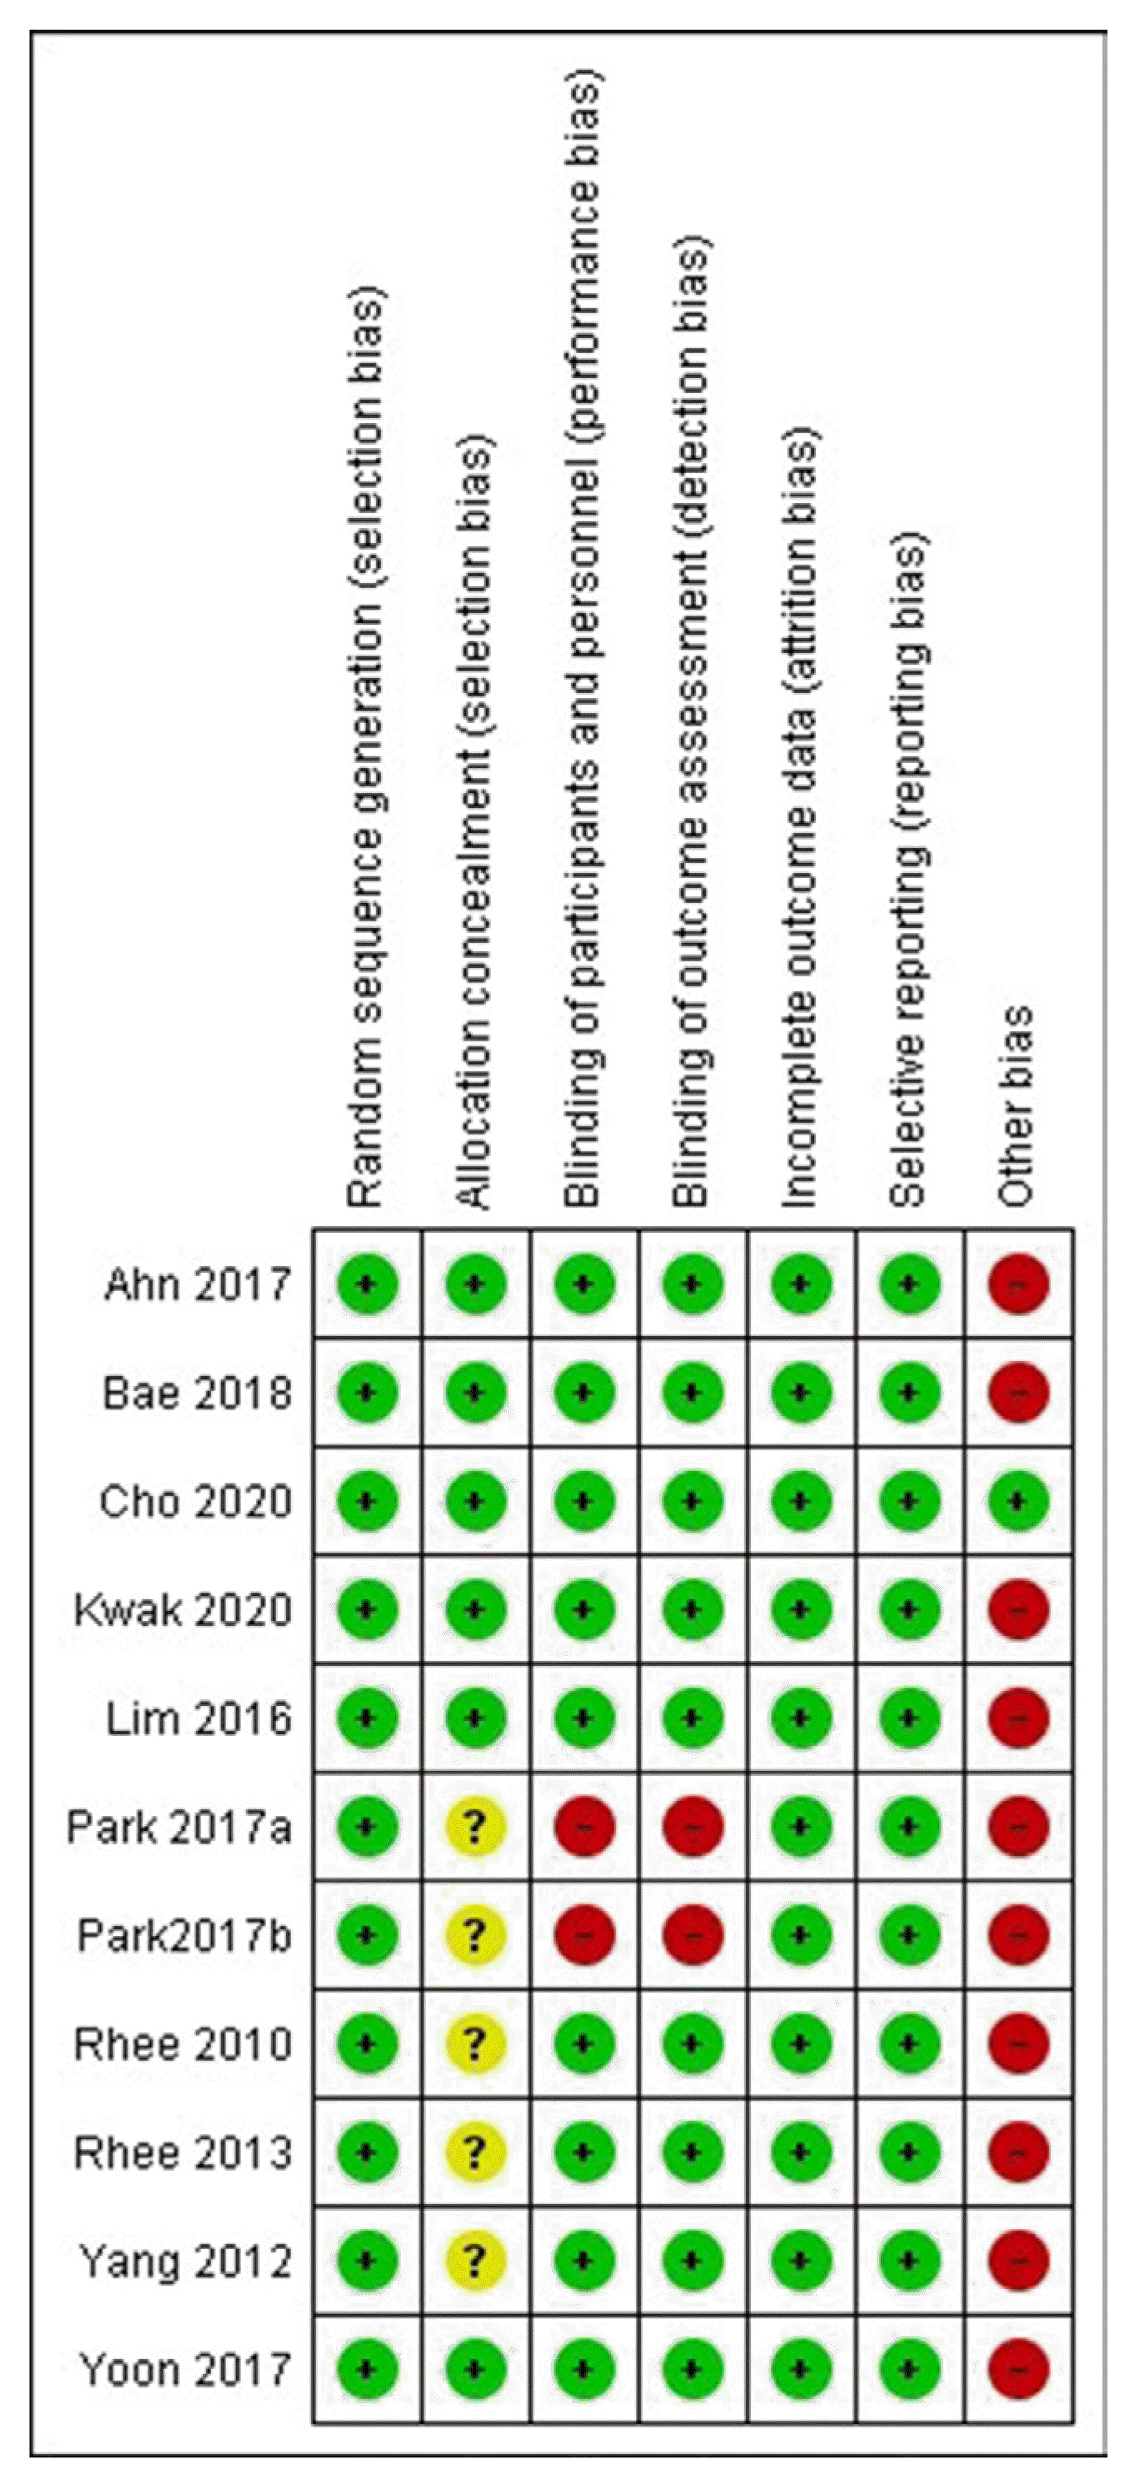
Fig. 3

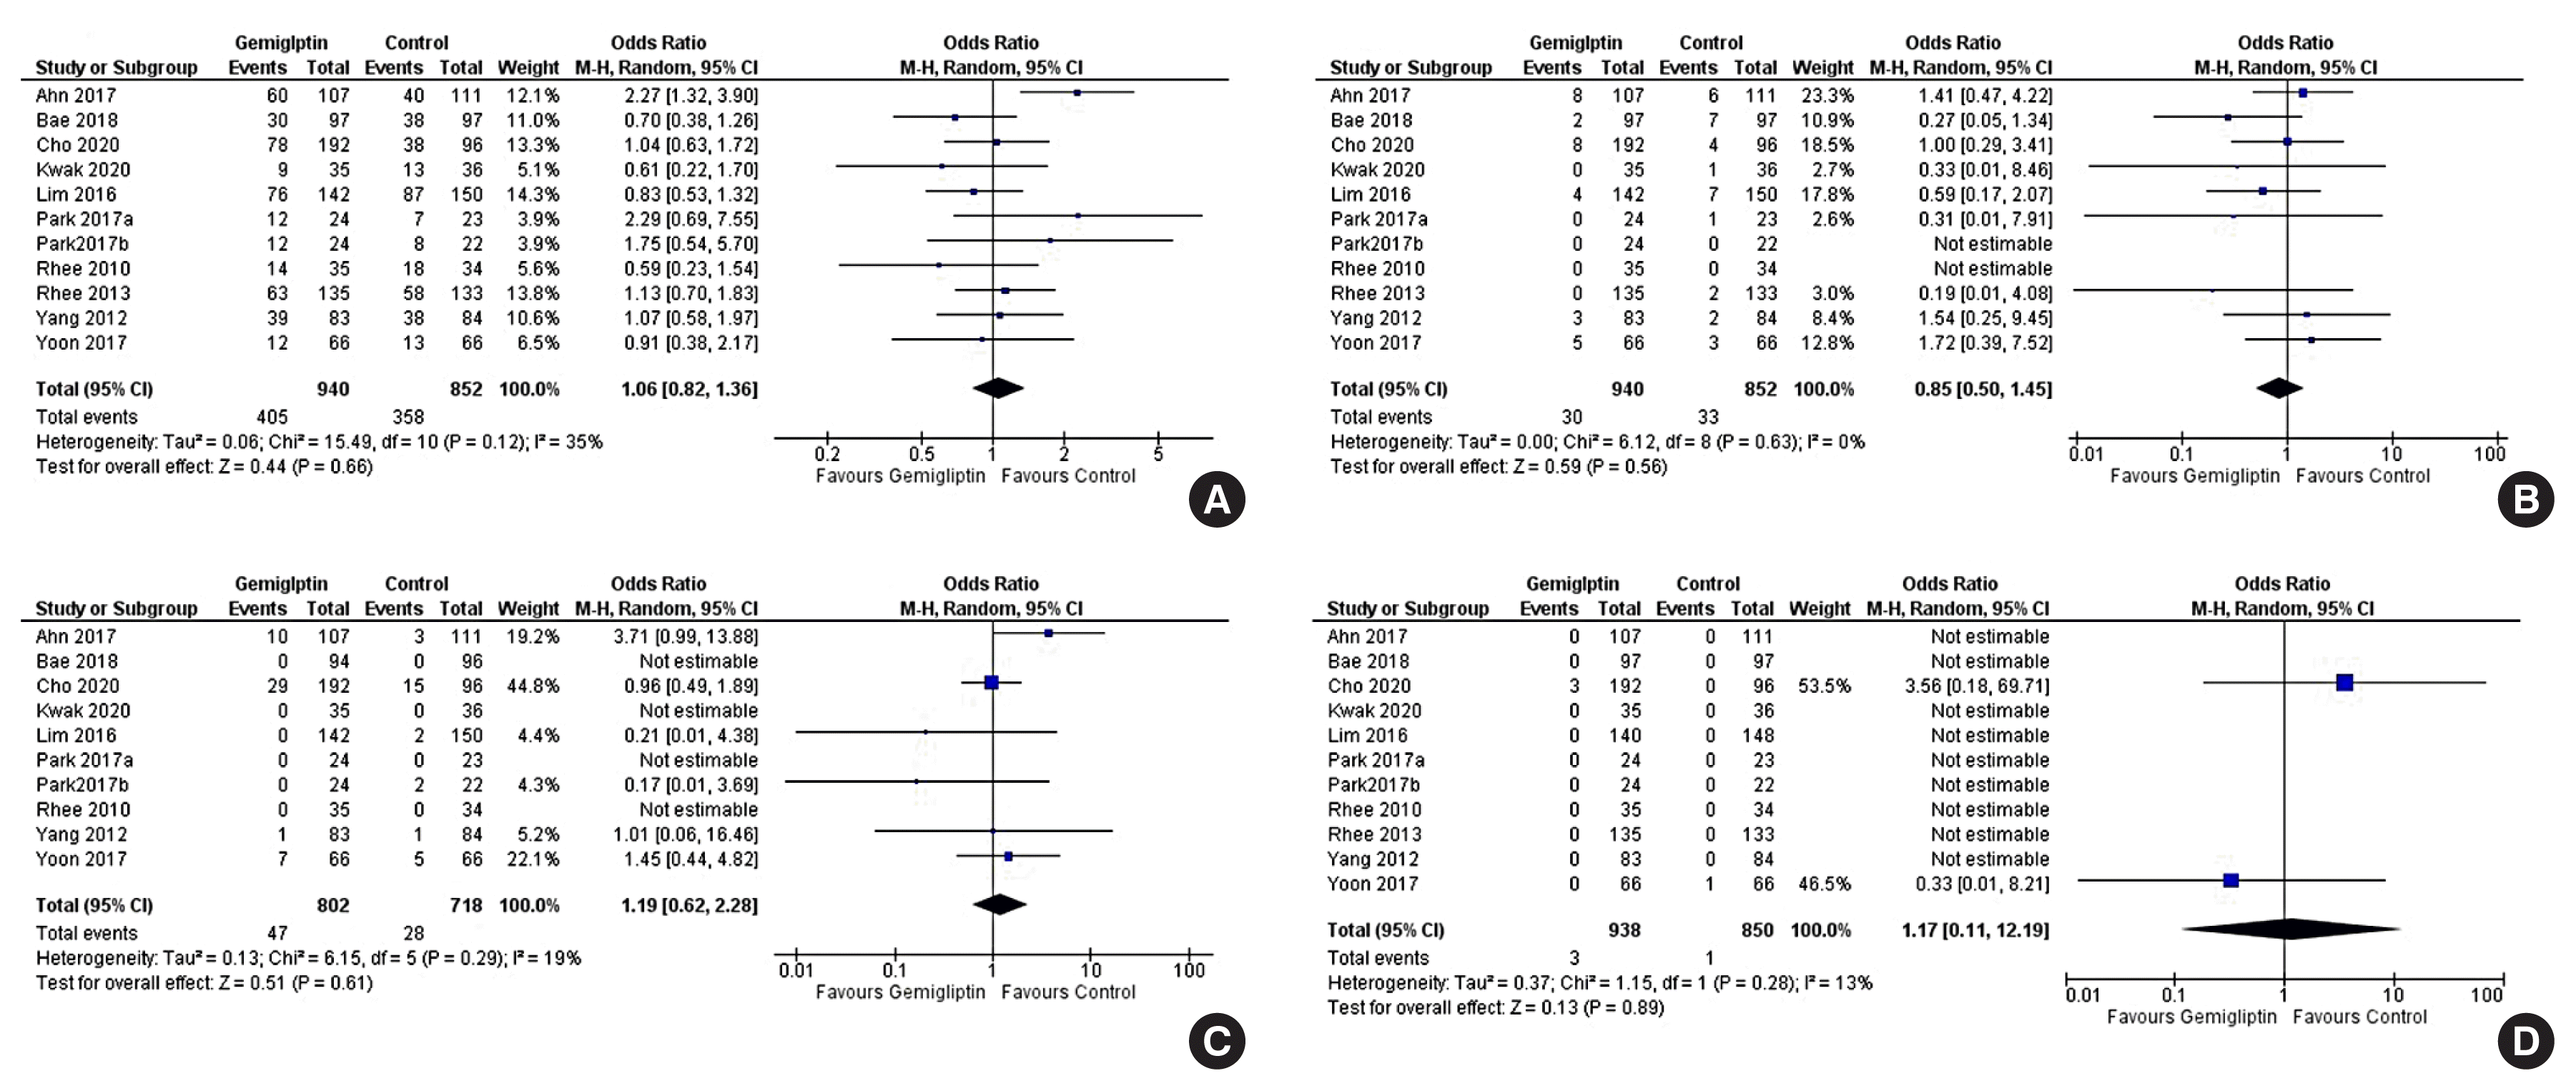
Fig. 4

Fig. 5

Fig. 6

Table 1
| Study | No. of patients in gemigliptin & control groups | Patient characteristics and nature of controls | Duration of study, wk | Outcomes evaluated in the study |
|---|---|---|---|---|
| Ahn et al. (2017) [15] | Gemigliptin 50 mg/day (n=107); placebo (n=109) |
Korean patients inadequately controlled with metformin and glimepiride Mean age 61.4 years (gemigliptin), 60.4 years (placebo) Baseline HbA1c 8.2% in both groups |
24 |
Mean change in HbA1c from baseline to week 24 The change in HbA1c was significantly greater in the gemigliptin group (−0.88%) than in the placebo group (−0.01%) |
| Bae et al. (2019) [20] |
Group 1: gemigliptin (50 mg)/rosuvastatin (20 mg) (n=96) Group 2: gemigliptin (50 mg) (n=97) Group 3: rosuvastatin (20 mg) (n=97) |
Patients with T2DM and dyslipidaemia on metformin for at least 6 weeks Mean age (years) 55.5, 56.1, 56.2 Baseline HbA1c 7.79%, 7.79%, 7.78% Baseline LDL-C (mg/dL) 133.4, 142.0, 133.6 in Groups 1, 2, 3, respectively |
24 |
Changes in HbA1c and LDL-C from baseline to week 24 between Groups 1, 3 and between Groups 1, 2, respectively Change in HbA1c was significantly greater in Group 1 (−0.54%) than in Group 3 (−0.27%) Change in LDL-C was significantly greater in Group 1 (−53 mg/dL) than in Group 2 (−1.1 mg/dL) |
| Cho et al. (2020) [16] | Gemigliptin 50 mg/day (n=188); placebo (n=95) |
Patients with T2DM, on background therapy with insulin or insulin plus metformin Mean age 61.1 years (gemigliptin), 59 years (placebo) Baseline HbA1c 8.4% in both groups |
24 |
Mean change in HbA1c from baseline to week 24 The mean change in HbA1c was significantly greater in the gemigliptin group (−0.7%) than in the dapagliflozin group (−0.1%) |
| Kwak et al. (2020) [11] | Gemigliptin 50 mg/day (n=35); dapagliflozin 10 mg/day (n=36) |
Patients with T2DM, who were either drug-naïve or uncontrolled with metformin Mean age 61.1 years (gemigliptin), 59 years (dapagliflozin) Baseline HbA1c 7.9% in both groups Use of metformin: n=17 (gemigliptin), n=23 (dapagliflozin) |
12 |
Change in MAGE after 12 weeks compared to baseline The change in MAGE was significantly greater in the gemigliptin group (−27.2 mg/dL), than in the dapagliflozin group (−7.9 mg/dL). |
| Lim et al. (2017) [12] |
Group 1: gemigliptin 50 mg/day+metformin 1,000–2,000 mg/day (n=136) Group 2: gemigliptin 50 mg/day (n=140) Group 3: metformin 1,000–2,000 mg/day (n=148) |
Patients with T2DM, who were either drug-naïve or on single OAD after a 8-week washout Mean age (years) 54.4, 53.4, 54 Baseline HbA1c 8.6%, 8.6%, 8.7% in Groups 1,2, 3, respectively |
24 |
Mean change in HbA1c from baseline to week 24 The mean change in HbA1c was significantly greater in Group 1 (−2%), than in Group 2 (−1.24%) and Group 3 (−1.47%) |
| Park et al. (2017) [14]a | Gemigliptin 50 mg/day (n=24); sitagliptin 100 mg/day (n=21) |
Patients with T2DM, who were either drug-naïve or on OADs for <8 weeks Mean age 50 years (gemigliptin), 50 years (sitagliptin) Baseline HbA1c 9.5% (gemigliptin), 9.1% (sitagliptin) |
12 |
Mean change in MAGE at week 12 compared with baseline The mean change in MAGE was comparable between the gemigliptin group and the sitagliptin group (−42 mg/dL in both groups) |
| Park et al. (2017) [14]b | Gemigliptin 50 mg/day (n=24); glimepiride 2 mg/day (n=21) |
Patients with T2DM, who were either drug-naïve or on OADs for <8 weeks Mean age 50 years (gemigliptin), 50 years (glimepiride) Baseline HbA1c 9.5% (gemigliptin), 9.7% (glimepiride) |
12 |
Mean change in MAGE at week 12 compared with baseline The mean change in MAGE was significantly greater in the gemigliptin group (−42 mg/dL) than in the glimepiride group (−21 mg/dL) |
| Study |
No. of patients in gemigliptin & control groups |
Patient characteristics and nature of controls |
Duration of study, wk |
Outcomes evaluated in the study |
| Rhee et al. (2010) [17] |
Group 1: gemigliptin 50 mg/day (n=35) Group 2: gemigliptin 100 mg/day (n=37) Group 3: gemigliptin 200 mg/day (n=35) Placebo (n=34) |
Patients with T2DM, who were drug-naïve Mean age (years) 52.4, 53.2, 54.2, 51.2 Baseline HbA1c 8.24%, 8.18%, 8.16%, 8.2% in Groups 1, 2, 3, 4 respectively |
12 |
Mean change in HbA1c from baseline to week 12 The mean change in HbA1c was greater in Group 1 (−0.98%) than in Groups 2, 3, 4 (−0.74%, −0.78%, and −0.06%, respectively) |
| Rhee et al. (2013) [13] |
Group 1: gemigliptin 25 mg/day (n=46) Group 2: gemigliptin 50 mg/day (n=49) Group 3: sitagliptin 100 mg/day (n=42) (added to metformin) |
Patients with T2DM on metformin monotherapy for at least 12 weeks Age 18–75 years Baseline HbA1c 8%, 7.9%, 8% in Groups 1, 2, 3, respectively |
24 |
Mean change in HbA1c from baseline to week 24 The mean change in HbA1c was comparable between Group 2 (−0.77%) and Group 3 (−0.8%) |
| Yang et al. (2013) [18] | Gemigliptin 50 mg/day (n=107); placebo (n=109) |
Patients with T2DM not on any OADs for at least 6 weeks Mean age 54 years (gemigliptin), 52 years (placebo) Baseline HbA1c 8.2% (gemigliptin), 8.3% (placebo) |
24 |
Mean change in HbA1c from baseline to week 24 The mean change in HbA1c was significantly greater in the gemigliptin group than in the placebo group (adjusted mean after subtracting the placebo effect size, −0.71%) |
| Yoon et al. (2017) [19] | Gemigliptin 50 mg/day (n=64); placebo (n=66) |
Patients with T2DM, either treatment naïve or on insulin or sulphonylurea, with moderate to severe renal impairment Mean age 61.7 years (gemigliptin), 62.3 years (placebo) Baseline HbA1c 8.3% (gemigliptin), 8.4% (placebo) eGFR (mL/min/1.73 m2) 31.2 (placebo), 35.4 (gemigliptin) |
12 |
Mean change in HbA1c from baseline to week 12 The mean change in HbA1c was significantly greater in the gemigliptin group (−0.82%) than in the placebo group (0.38%) |
Table 2
| Study | No. of patients in gemigliptin and control groups | Patient characteristics and nature of controls | Duration of study, wk | Outcomes evaluated in the study and reasons for exclusion |
|---|---|---|---|---|
| Jung et al. (2018) [22] | Gemigliptin 25 mg twice daily switched to 50 mg once daily: G1/G2 (n=118), gemigliptin 50 mg continued at the same dose: G2/G2 (n=111), sitagliptin 100 mg switched to gemigliptin 50 mg: S/G2 (n=106) | Baseline HbA1c 8.1%, 7.9%, 7.6%, respectively in Groups G1/G2, G2/G2, S/G2 | 52 |
Mean change in HbA1c from baseline to week 52 Excluded as it was not a RCT |
| Han et al. (2018) [21] |
Gemigliptin (n=66), placebo (n=66) After 12 weeks, gemigliptin group continued to receive gemigliptin (n=50), and placebo switched to linagliptin (n=52). |
Patients with T2DM, with moderate to severe renal impairment Mean age 62.6 years (gemigliptin), 62.1 years (linagliptin) Baseline HbA1c 8.4% in both groups eGFR (mL/min/1.73 m2) 36.1 (gemigliptin), 32.2 (linagliptin) |
52 |
Mean change in HbA1c from baseline to week 52 Excluded as it was an open-label, 52-week extension study |
| Ahn et al. (2017) [15] | Gemigliptin (n=5), placebo (n=5) |
Patients with T2DM inadequately controlled with OADs and/or lifestyle modification Median age 56.5 years Median HbA1c 7.2% |
4 |
Difference in peak lipopolysaccharide levels after high-fat meal tolerance test Excluded as it was a short RCT with a primary outcome related to lipopolysaccharide levels |
| Cha et al. (2017) [23] | Gemigliptin (n=69), linagliptin (n=55), SGLT2 inhibitor (n=60) |
Patients with T2DM who were receiving a DPP4 inhibitor or SGLT2 inhibitor as add-on therapy to metformin and/or a sulfonylurea Mean age (DPP4 inhibitors) 53.4 years (SGLT-2 inhibitors) 52.6 years Mean HbA1c (DPP4 inhibitors) 8.6% (SGLT-2 inhibitors) 8.3% |
24 |
Difference in lipid profile between baseline and 24 weeks Excluded as it was a observational study on difference in lipid levels |
| Bae et al. (2019) [20] | Gemigliptin (n=84) |
Patients with T2DM who were prescribed gemigliptin for more than 180 days after renal/hepatic transplantation Mean age 58.3 years Mean HbA1c 8.16% |
24 |
Change in HbA1c after 6 months, and safety associated with immunosuppressive treatment Excluded as it was a single-arm retrospective study |
Table 3
| Outcomes | Anticipated absolute effectsa (95% CI) | Relative effect, OR (95% CI) | No. of participants (studies) | Certainty of the evidence (GRADE) | |
|---|---|---|---|---|---|
| Risk with control | Risk with gemigliptin | ||||
| HbA1c (24 weeks): ACG | The mean HbA1c (24 weeks): ACG was 7.24 % | MD 0.09% higher (0.06 lower–0.23 higher) | - | 556 (2 RCTs) |
⊕⊕⊕○ Moderateb |
| HbA1c (24 weeks): PCG | The mean HbA1c (24 weeks): PCG was 8.27 % | MD 0.91% lower (1.18 lower–0.63 lower) | - | 856 (4 RCTs) |
⊕⊕⊕⊕ High |
| Fasting glucose (24 weeks): ACG | The mean fasting glucose (24 weeks): ACG was 128.55 mg/dL | MD 10.99 mg/dL higher (4.29 lower–26.27 higher) | - | 556 (2 RCTs) |
⊕⊕⊕○ Moderateb |
| Fasting glucose (24 weeks): PCG | The mean fasting glucose (24 weeks): PCG was 156.33 mg/dL | MD 16.82 mg/dL lower (18.7 lower–14.93 lower) | - | 674 (3 RCTs) |
⊕⊕⊕⊕ High |
| Percent of people achieving HbA1c <7% (24 weeks): ACG | 495 per 1,000 | 474 per 1,000 (337–615) | 0.92 (0.52–1.63) | 556 (2 RCTs) |
⊕⊕⊕○ Moderateb |
| Percent of people achieving HbA1c <7% (24 weeks): PCG | 125 per 1,000 | 390 per 1,000 (230–578) | 4.48 (2.09–9.60) | 666 (3 RCTs) |
⊕⊕⊕⊕ High |
| Percentage of people achieving HbA1c <6.5% (24 weeks): ACG | 203 per 1,000 | 216 per 1,000 (153–292) | 1.08 (0.71–1.62) | 556 (2 RCTs) |
⊕⊕⊕⊕ High |
| Percentage of people achieving HbA1c <6.5% (24 weeks): PCG | 14 per 1,000 | 114 per 1,000 (39–288) | 9.13 (2.89–28.88) | 667 (3 RCTs) |
⊕⊕⊕⊕ High |
| Total adverse events | 420 per 1,000 | 434 per 1,000 (373–496) | 1.06 (0.82–1.36) | 1,792 (11 RCTs) |
⊕⊕⊕⊕ High |
| Severe adverse events | 39 per 1,000 | 33 per 1,000 (20–55) | 0.85 (0.50–1.45) | 1,792 (11 RCTs) |
⊕⊕⊕⊕ High |
| Total hypoglycaemic episodes | 39 per 1,000 | 46 per 1,000 (25–85) | 1.19 (0.62–2.28) | 1,520 (10 RCTs) |
⊕⊕⊕⊕ High |
Patient or population: people living with type 2 diabetes mellitus; Setting: RCTs having either an active control subgroup (metformin/dapagliflozin/sitagliptin/glimepiride) or a passive control subgroup (placebo/rosuvastatin); Intervention: gemigliptin; Comparison: control. GRADE Working Group grades of evidence—High certainty: We are very confident that the true effect lies close to that of the estimate of the effect; Moderate certainty: We are moderately confident in the effect estimate. The true effect is likely to be close to the estimate of the effect, but there is a possibility that it is substantially different; Low certainty: Our confidence in the effect estimate is limited. The true effect may be substantially different from the estimate of the effect; Very low certainty: We have very little confidence in the effect estimate. The true effect is likely to be substantially different from the estimate of effect.
GRADE, Grades of Recommendation, Assessment, Development and Evaluation; CI, confidence interval; OR, odds ratio; HbA1c, haemoglobin A1c; ACG, active control group; MD, mean difference; RCT, randomised controlled trial; PCG, passive control group.
a The risk in the intervention group (and its 95% confidence interval) is based on the assumed risk in the comparison group and the relative effect of the intervention (and its 95% CI);
b The funnel plot is suggestive of the presence of most of the studies outside the plot; hence, it is likely that significant publication bias is present (Supplemental Fig. S5).


 PDF
PDF Citation
 Print
Print


 XML Download