



 PDF
PDF Citation
 Print
Print


INTRODUCTION
METHODS
Study participants
Clinical and biochemical assessments
Definitions of clinical variables and outcomes
Transient elastography
Statistical analysis
RESULTS
Table 1
| Characteristic | All | Training set | Testing set | P value (training vs. testing set) |
|---|---|---|---|---|
| Number | 766 | 534 (70) | 232 (30) | - |
|
|
||||
| Clinical variable | ||||
| Male sex, % | 50.8 | 49.6 | 53.4 | 0.331 |
| Age, yr | 59.4±10.3 | 59.3±10.1 | 59.7±10.6 | 0.653 |
| Ever smoker, % | 24.4 | 22.7 | 28.4 | 0.087 |
| Duration of diabetes, yr | 16.6±9.2 | 16.4±9.0 | 17.1±9.6 | 0.346 |
| BMI, kg/m2 | 28.6±4.5 | 28.6±4.6 | 28.4±4.3 | 0.597 |
| WC, cm | 97.6±11.7 | 97.9±12.1 | 97.0±10.7 | 0.359 |
| Systolic BP, mm Hg | 136±16 | 137±16 | 135±16 | 0.187 |
| Diastolic BP, mm Hg | 78±10 | 78±10 | 77±9 | 0.064 |
|
|
||||
| Biochemical variable | ||||
| HbA1c, % | 7.7±1.2 | 7.7±1.2 | 7.7±1.3 | 0.500 |
| TC, mmol/L | 4.08±0.86 | 4.06±0.80 | 4.12±0.99 | 0.390 |
| HDL-C, mmol/L | 1.16±0.29 | 1.17±0.29 | 1.13±0.29 | 0.105 |
| LDL-C, mmol/L | 2.12±0.73 | 2.09±0.69 | 2.18±0.80 | 0.122 |
| TGa, mmol/L | 1.49 (1.07–2.10) | 1.58 (1.09–2.11) | 1.50 (1.07–2.11) | 0.847 |
| eGFR, mL/min/1.73 m2 | 81.8±25.8 | 82.7±25.3 | 79.8±27.0 | 0.154 |
| ALT, U/L | 29.8±19.8 | 30.0±19.6 | 29.4±20.4 | 0.672 |
| AST, U/L | 25.1±11.2 | 25.1±11.0 | 25.0±11.8 | 0.901 |
| Albumin, g/L | 44.8±3.2 | 44.8±3.2 | 44.7±3.3 | 0.859 |
| Platelets, ×109/L | 261.3±67.1 | 260.9±66.1 | 262.3±69.4 | 0.793 |
|
|
||||
| Medical history, % | ||||
| Hypertension | 83.9 | 84.3 | 83.2 | 0.708 |
| Dyslipidaemia | 95.4 | 95.1 | 96.1 | 0.547 |
| CHD | 18.0 | 18.4 | 17.2 | 0.713 |
| Stroke | 2.0 | 1.7 | 2.6 | 0.405 |
|
|
||||
| Diabetes microvascular complications | ||||
| Diabetes retinopathy, % | 48.2 | 47.6 | 49.6 | 0.610 |
| UACR (A2 or above), % | 48.3 | 47.0 | 51.3 | 0.275 |
| UACRa, mg/mmol | 3.14 (0.81–14.5) | 3.07 (0.76–14.0) | 3.53 (0.88–18.5) | 0.277 |
|
|
||||
| Transient elastography | ||||
| Steatosis, % | 0.390 | |||
| Mild | 10.2 | 9.4 | 12.1 | |
| Moderate | 27.4 | 28.5 | 25.0 | |
| Severe | 62.4 | 62.1 | 62.9 | |
| Liver stiffness, % | 0.998 | |||
| F0/F1 | 40.2 | 40.1 | 40.1 | |
| F2 | 40.3 | 40.4 | 40.1 | |
| F3 | 7.8 | 7.9 | 7.8 | |
| F4 | 11.7 | 11.6 | 12.0 | |
| ≥F3 | 19.5 | 19.5 | 19.8 | 0.910 |
|
|
||||
| Anti-diabetic agents related to NAFLD, % | ||||
| Pioglitazone | 12.6 | 11.4 | 15.1 | 0.159 |
| SGLT2 inhibitors | 15.9 | 15.2 | 17.7 | 0.384 |
| GLP-1RA | 1.3 | 1.7 | 0.4 | 0.297 |
Values are expressed as number (%), mean±standard deviation, or median (interquartile range). Albuminuria category was classified according to urine albumin to creatinine ratio: A1 <3 mg/mmol, A2 3–30 mg/mmol, and A3 >30 mg/mmol.
BMI, body mass index; WC waist circumference; BP, blood pressure; HbA1c, glycated hemoglobin; TC, total cholesterol; HDL-C, high-density lipoprotein cholesterol; LDL-C, low-density lipoprotein cholesterol; TG, triglyceride; eGFR, estimated glomerular filtration rate; ALT, alanine aminotransferase; AST, aspartate transaminase; CHD, coronary heart disease; UACR, urine albumin to creatinine ratio; NAFLD, non-alcoholic fatty liver disease; SGLT2, sodium-glucose co-transporter 2; GLP-1RA, glucagon-like peptide-1 receptor agonist.

Clinical characteristics were significantly different between participants with ≥F3 fibrosis and those without
Table 2
| Variable | All | LS ≥ F3 | P value | |
|---|---|---|---|---|
|
|
||||
| No | Yes | |||
| Number | 534 | 430 | 104 | - |
|
|
||||
| Clinical variable | ||||
| Male sex, % | 49.6 | 48.6 | 53.8 | 0.337 |
| Age, yr | 59.3±10.1 | 59.6±10.0 | 58.0±10.5 | 0.135 |
| Ever smoker, % | 22.7 | 20.7 | 30.8 | 0.028 |
| Duration of diabetes, yr | 16.4±9.0 | 16.5±9.3 | 15.6±7.9 | 0.365 |
| BMI, kg/m2 | 28.6±4.6 | 27.8±4.0 | 32.0±5.3 | <0.001 |
| WC, cm | 97.9±12.1 | 95.6±9.9 | 107.1±15.7 | <0.001 |
| Systolic BP, mm Hg | 137±16 | 137±17 | 138±16 | 0.397 |
| Diastolic BP, mm Hg | 79±10 | 79±10 | 80±9 | 0.279 |
|
|
||||
| Medical history, % | ||||
| Hypertension | 84.3 | 84.7 | 82.7 | 0.622 |
| Dyslipidaemia | 95.1 | 95.6 | 93.3 | 0.326 |
| CHD | 18.4 | 18.6 | 17.3 | 0.759 |
| Stroke | 1.7 | 1.9 | 1.0 | 0.523 |
|
|
||||
| Biochemical variable | ||||
| HbA1c, % | 7.7±1.2 | 7.6±1.2 | 7.7±1.3 | 0.462 |
| TC, mmol/L | 4.06±0.81 | 4.07±0.83 | 3.99±0.71 | 0.334 |
| HDL-C, mmol/L | 1.17±0.29 | 1.19±0.29 | 1.08±0.30 | 0.001 |
| LDL-C, mmol/L | 2.09±0.69 | 2.11±0.70 | 2.02±0.64 | 0.239 |
| TGa, mmol/L | 1.48 (1.08–2.11) | 1.42 (1.07–2.04) | 1.66 (1.19–2.40) | 0.032 |
| ALT, U/L | 30.0±19.6 | 26.9±17.1 | 43.0±23.8 | <0.001 |
| AST, U/L | 25.1±11.0 | 22.9±8.7 | 34.4±14.2 | <0.001 |
| eGFR, mL/min/1.73 m2 | 82.7±25.3 | 82.7±25.5 | 83.0±24.7 | 0.920 |
| Albumin, g/L | 44.8±3.2 | 44.8±3.1 | 44.6±3.3 | 0.460 |
| Platelets, ×109/L | 261.0±66.1 | 266.0±65.9 | 242.0±63.5 | 0.001 |
|
|
||||
| Transient elastography | ||||
| CAP | 314.0±41.0 | 306.0±38.2 | 344.0±38.5 | <0.001 |
|
|
||||
| Diabetes microvascular complications | ||||
| Diabetes retinopathy, % | 47.6 | 45.8 | 54.8 | 0.102 |
| UACR category ≥A2, % | 47.0 | 43.3 | 62.5 | <0.001 |
| UACRa, mg/mmol | 3.07 (0.76–14.0) | 2.55 (0.59–11.3) | 6.55 (1.88–27.6) | <0.001 |
|
|
||||
| Anti-diabetic medications related to NAFLD, % | ||||
| Pioglitazone | 11.4 | 10.7 | 14.4 | 0.284 |
| SGLT2 inhibitors | 15.2 | 15.1 | 15.4 | 0.945 |
| GLP-1RA | 1.7 | 1.4 | 2.9 | 0.290 |
|
|
||||
| Fibrosis scores | ||||
| APRIa | 0.24 (0.18–0.32) | 0.22 (0.17–0.28) | 0.35 (0.27–0.49) | <0.001 |
| FIB-4a | 1.06 (0.80–1.44) | 1.03 (0.77–1.40) | 1.27 (0.92–1.67) | <0.001 |
| NFS | −1.04±1.22 | −1.15±1.21 | −0.59±1.15 | <0.001 |
Values are expressed as mean±standard deviation or median (interquartile range). Albuminuria category was classified according to urine albumin to creatinine ratio: A1 <3 mg/mmol, A2 3–30 mg/mmol, and A3 >30 mg/mmol.
LS, liver stiffness; BMI, body mass index; WC waist circumference; BP, blood pressure; CHD, coronary heart disease; HbA1c, glycated hemoglobin; TC, total cholesterol; HDL-C, high-density lipoprotein cholesterol; LDL-C, low-density lipoprotein cholesterol; TG, triglyceride; ALT, alanine aminotransferase; AST, aspartate transaminase; eGFR, estimated glomerular filtration rate; CAP, controlled attenuation parameter; UACR, urine albumin to creatinine ratio; NAFLD, non-alcoholic fatty liver disease; SGLT2, sodium-glucose co-transporter 2; GLP-1RA, glucagon-like peptide-1 receptor agonist; APRI, aspartate aminotransferase-to-platelet ratio index; FIB-4, fibrosis-4; NFS, NAFLD fibrosis score.
Conventional non-invasive fibrosis scores had overall suboptimal correlation with LS measurements
Table 3
| Variable | Liver stiffness, kPa | |
|---|---|---|
|
|
||
| r | P value | |
| Clinical variable | ||
| Age, yr | −0.07 | 0.125 |
| BMI, kg/m2 | 0.40 | <0.001 |
| WC, cm | 0.42 | <0.001 |
| Duration of diabetes, yr | −0.04 | 0.326 |
| Systolic BP, mm Hg | 0.07 | 0.109 |
| Diastolic BP, mm Hg | 0.05 | 0.250 |
|
|
||
| Biochemical variable | ||
| HbA1c, % | 0.09 | 0.033 |
| TC, mmol/L | −0.09 | 0.044 |
| HDL-C, mmol/L | −0.16 | <0.001 |
| LDL-C, mmol/L | −0.12 | 0.008 |
| TGa, mmol/L | 0.13 | 0.002 |
| ALT, U/L | 0.42 | <0.001 |
| AST, U/L | 0.47 | <0.001 |
| eGFR, mL/min/1.73 m2 | −0.01 | 0.845 |
| Albumin, g/L | 0.02 | 0.633 |
| Platelets, ×109/L | −0.13 | 0.003 |
| UACRa, mg/mmol | 0.18 | <0.001 |
|
|
||
| Transient elastography | ||
| CAP | 0.40 | <0.001 |
|
|
||
| Fibrosis scores | ||
| APRIa | 0.43 | <0.001 |
| NFS | 0.15 | <0.001 |
| FIB-4a | 0.17 | <0.001 |
BMI, body mass index; WC waist circumference; BP, blood pressure; HbA1c, glycated hemoglobin; TC, total cholesterol; HDL-C, high-density lipoprotein cholesterol; LDL-C, low-density lipoprotein cholesterol; TG, triglyceride; ALT, alanine aminotransferase; AST, aspartate transaminase; eGFR, estimated glomerular filtration rate; UACR, urine albumin to creatinine ratio; CAP, controlled attenuation parameter; APRI, aspartate aminotransferase-to-platelet ratio index; FIB-4, fibrosis-4; NFS, non-alcoholic fatty liver disease (NAFLD) fibrosis score.
DFS to identify those who would have AF or cirrhosis on TE
Table 4
The derivation analysis also included age, ever smoker, BMI, AST, alanine aminotransferase, HDL-C, triglyceride, platelet count, and albuminuria category. Variables were selected in DFS based on Akaike information criteria.
Table 5
| High DFS cut-offa | Low DFS cut-offb | Optimal DFS cut-offc | |
|---|---|---|---|
| AUROC of DFS (95% CI) | 0.85 (0.77–0.93) | ||
| Cut-off value | 0.3 | 0.1 | 0.2 |
| PPV, % | 54.9 | 35.1 | 45.0 |
| NPV, % | 90.6 | 96.8 | 95.0 |
| Accuracy, % | 84.1 | 68.8 | 79.2 |
| Sensitivity, % | 58.1 | 90.0 | 80.8 |
| Specificity, % | 90.0 | 58.1 | 78.8 |
DFS was more accurate than conventional scores for identifying the risk of AF on TE in patients with type 2 diabetes
Fig. 1
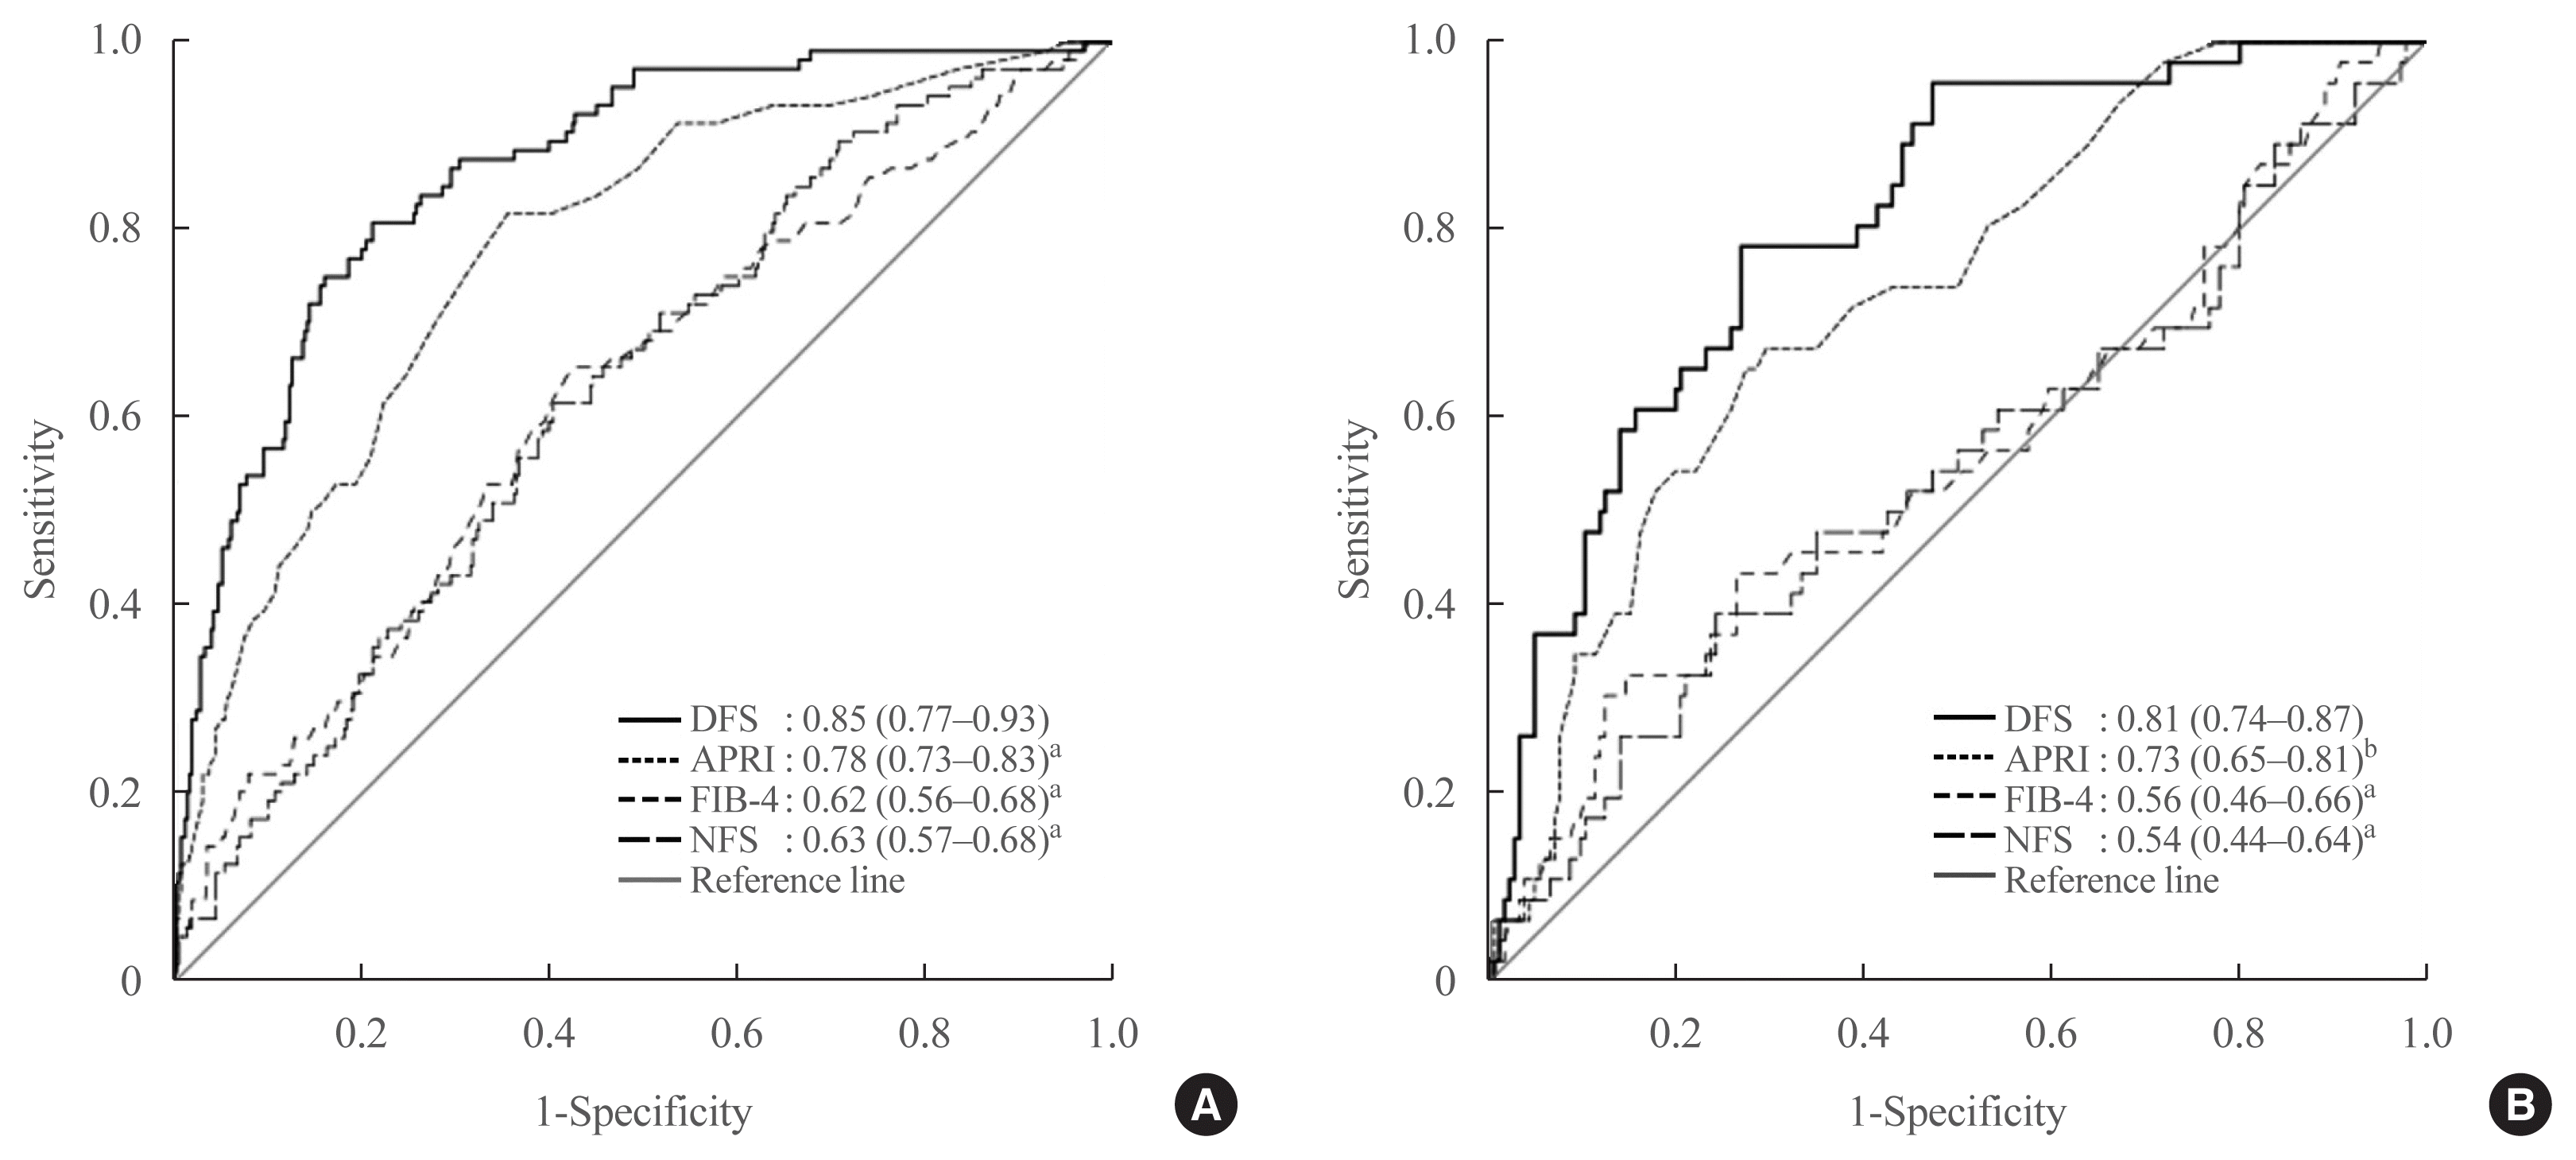

Table 6
Table 7

 XML Download