Journal List > Endocrinol Metab > v.35(4) > 1516079006

Jeong, Byun, Noh, Kim, Chung, Park, and Kim: Reference Ranges of Serum Insulin-Like Growth Factor-I and Insulin-Like Growth Factor Binding Protein-3: Results from a Multicenter Study in Healthy Korean Adults

Abstract

Insulin-like growth factor-I (IGF-I) plays a pivotal role in the diagnosis and treatment of growth hormone (GH) excess or deficiency. The GH study group of the Korean Endocrine Society aims to establish the Korean reference ranges of serum IGF-I and insulin-like growth factor binding protein-3 (IGFBP-3) and assess the relationship between IGF-I and IGFBP-3 and clinical parameters. Fasting serum was collected from healthy Korean adults at health promotion centers of five hospitals nationwide. Serum IGF-I and IGFBP-3 were measured via an immunoradiometric assay using a DSL kit (Diagnostic Systems Laboratories). Serum samples from 354 subjects (180 male, 174 female) were analyzed based on sex at 10-year intervals from 21 to 70 years. IGF-I levels were inversely correlated with age. After adjustment of age, the IGF-I/IGFBP-3 ratio was significantly negatively associated with blood pressure and free thyroxine and positively associated with weight, hemoglobin, creatinine, alanine transferase, fasting glucose, and thyroid stimulating hormone. Therefore, age- and sex-specific reference ranges of serum IGF-I and IGFBP-3 can be efficient in evaluating GH excess or deficiency in Korean population.

INTRODUCTION

The insulin-like growth factor-I (IGF-I) (termed since 1978) with activity similar to insulin was initially reported in 1972 as a sulfation factor secreted by liver, mediating the stimulating effect of growth hormone (GH) [1]. Serum IGF-I plays a pivotal role in somatotropic axis disorders in both adolescents and adults [1]. In blood circulation, over 75% of IGF-I is bound to the insulin-like growth factor binding protein-3 (IGFBP-3). Higher levels of IGFBP-3 increase the binding capacity of IGF-I, but also decrease the circulating IGF-I bioavailability [2]. Therefore, the molar ratio between IGF-I and IGFBP-3 reflects the biologically active free IGF-I [3].
Circulating levels of IGF-I extensively depend on genetic factors and age [3,4] and are also affected by sex, anthropometric indices, physical activity, exogenous sex hormones, smoking, and nutritional status [57]. Measuring serum IGF-I and IGFBP-3 is essential for diagnosis and monitoring of treatment responses in GH deficiency such as hypopituitarism, growth hormone-releasing hormone (GHRH) receptor mutation, or GH insensitivity [8] and GH excess such as acromegaly or gigantism [9]. Recently many countries reported the reference range of IGF-I [4,5]; however, no study has evaluated IGF-I reference ranges in Korean population.
We aimed to identify the reference ranges for serum IGF-I and IGFBP-3 and to assess the relationship between IGF-I, IGFBP-3, and IGF-I/IGFBP-3 molar ratio and clinical parameters in Korean adult (21 to 70 years) population.

METHODS

Study subjects

The study was conducted by the GH study group of the Korean Endocrine Society between 2004 and 2006. In total, 354 healthy Koreans (180 men, 174 women), aged 21 to 70 years, with a body mass index (BMI) ≥18.5 and ≤30 kg/m2 were selected from five hospitals in South Korea; Hallym University Hangang Sacred Heart Hospital (Seoul), Inje University Ilsan Paik Hospital (Goyang), Seoul Metropolitan Government Seoul National University Boramae Medical Center (Seoul), Ajou University Medical Center (Suwon), Jeonbuk National University Hospital (Jeonju). Exclusion criteria were: (1) pregnancy; (2) history of diabetes mellitus, hypertension, thyroid dysfunction, and malignancy; (3) renal, hepatic, and pituitary disease; (4) previous or current drug treatments for medical illness; (5) malignancy; and (6) malnutrition. The information about medical history and menopause state were taken from interview of study subjects and review of medical records. Menopause was defined the state of which women who have not experienced any menstrual flow for a minimum of 12 months assuming that they have a uterus and are not pregnant or lactating in 40s or 50s women, or women have a history of hysterectomy and follicle stimulating hormone (FSH) >40 mIU/mL, or women underwent bilateral oophorectomy.
This study was approved by the Institutional Review Board of the Hallym University Hangang Sacred Heart Hospital (IRB No. 2003-007). All participants provided written informed consent.

Measurements

Blood samples were collected after overnight fasting. Thereafter, 1 mL serum was collected in two tubes each, stored at −70°C, and was further evaluated in the endocrinology laboratory of Kyung Hee University Hospital. The IGF-I and IGFBP-3 levels were measured via immunoradiometric assay using a DSL kit (Diagnostic Systems Laboratories, Webster, TX, USA). The biochemical data of study participants were collected from the results of each health promotion center by investigators. Clinical data for liver, kidney, thyroid function, lipid, and glucose metabolism were analyzed for their correlations with IGF-I and IGFBP-3 levels.

Statistical analysis

To determine the consistency of the mean IGF-I values by age group, we confirmed intraclass correlation coefficient (ICC) between means of reference’s data from DSL kit and our samples, and modeled IGF-I and IGFBP-3 values to least square means and 95% confidence interval via generalized additive model (GAM) and quantile regression. The correlation strength between the variables and IGF-I and IGFBP-3 and the molar ratio was calculated by Pearson’s correlation coefficient (r). The P value of 0.05 was considered statistically significant, and was measured using the R3.6.1 program (https://cran.r-project.org) and R packages (irr, psych, gam, quantreg, and ggplot2).

RESULTS

The baseline clinical characteristics of subjects

The baseline characteristics of 354 study subjects with normal liver, kidney, thyroid function test, and lipid profile are listed in Supplemental Table S1. The mean age was 45 years (46 male, 44 female) and the mean BMI was 22.93 kg/m2.

The reference ranges of serum IGF-I and IGFBP-3

The mean and standard deviation of serum IGF-I and IGFBP-3 levels according to age are summarized in Table 1. The participants were divided based on sex into groups at 10-year intervals from 21 to 70 years. The serum IGF-I levels were lower in age dependent manner, whereas the mean IGFBP-3 levels were not (Table 1, Supplemental Fig. S1). In particular, among subjects aged 40 to 60 years, the IGF-I level of postmenopausal women without hormonal replacement therapy (HRT) was significantly lower than those of premenopausal women and men (188.60±109.89 ng/mL vs. 279.40±127.85 ng/mL vs. 281.64±136.57 ng/mL, P<0.0001). Also, the IGF-I levels of postmenopausal women with HRT were very high. Therefore, we excluded the data of two postmenopausal women who had been treated with HRT and analyzed the reference ranges of serum IGF-I and IGFBP-3.
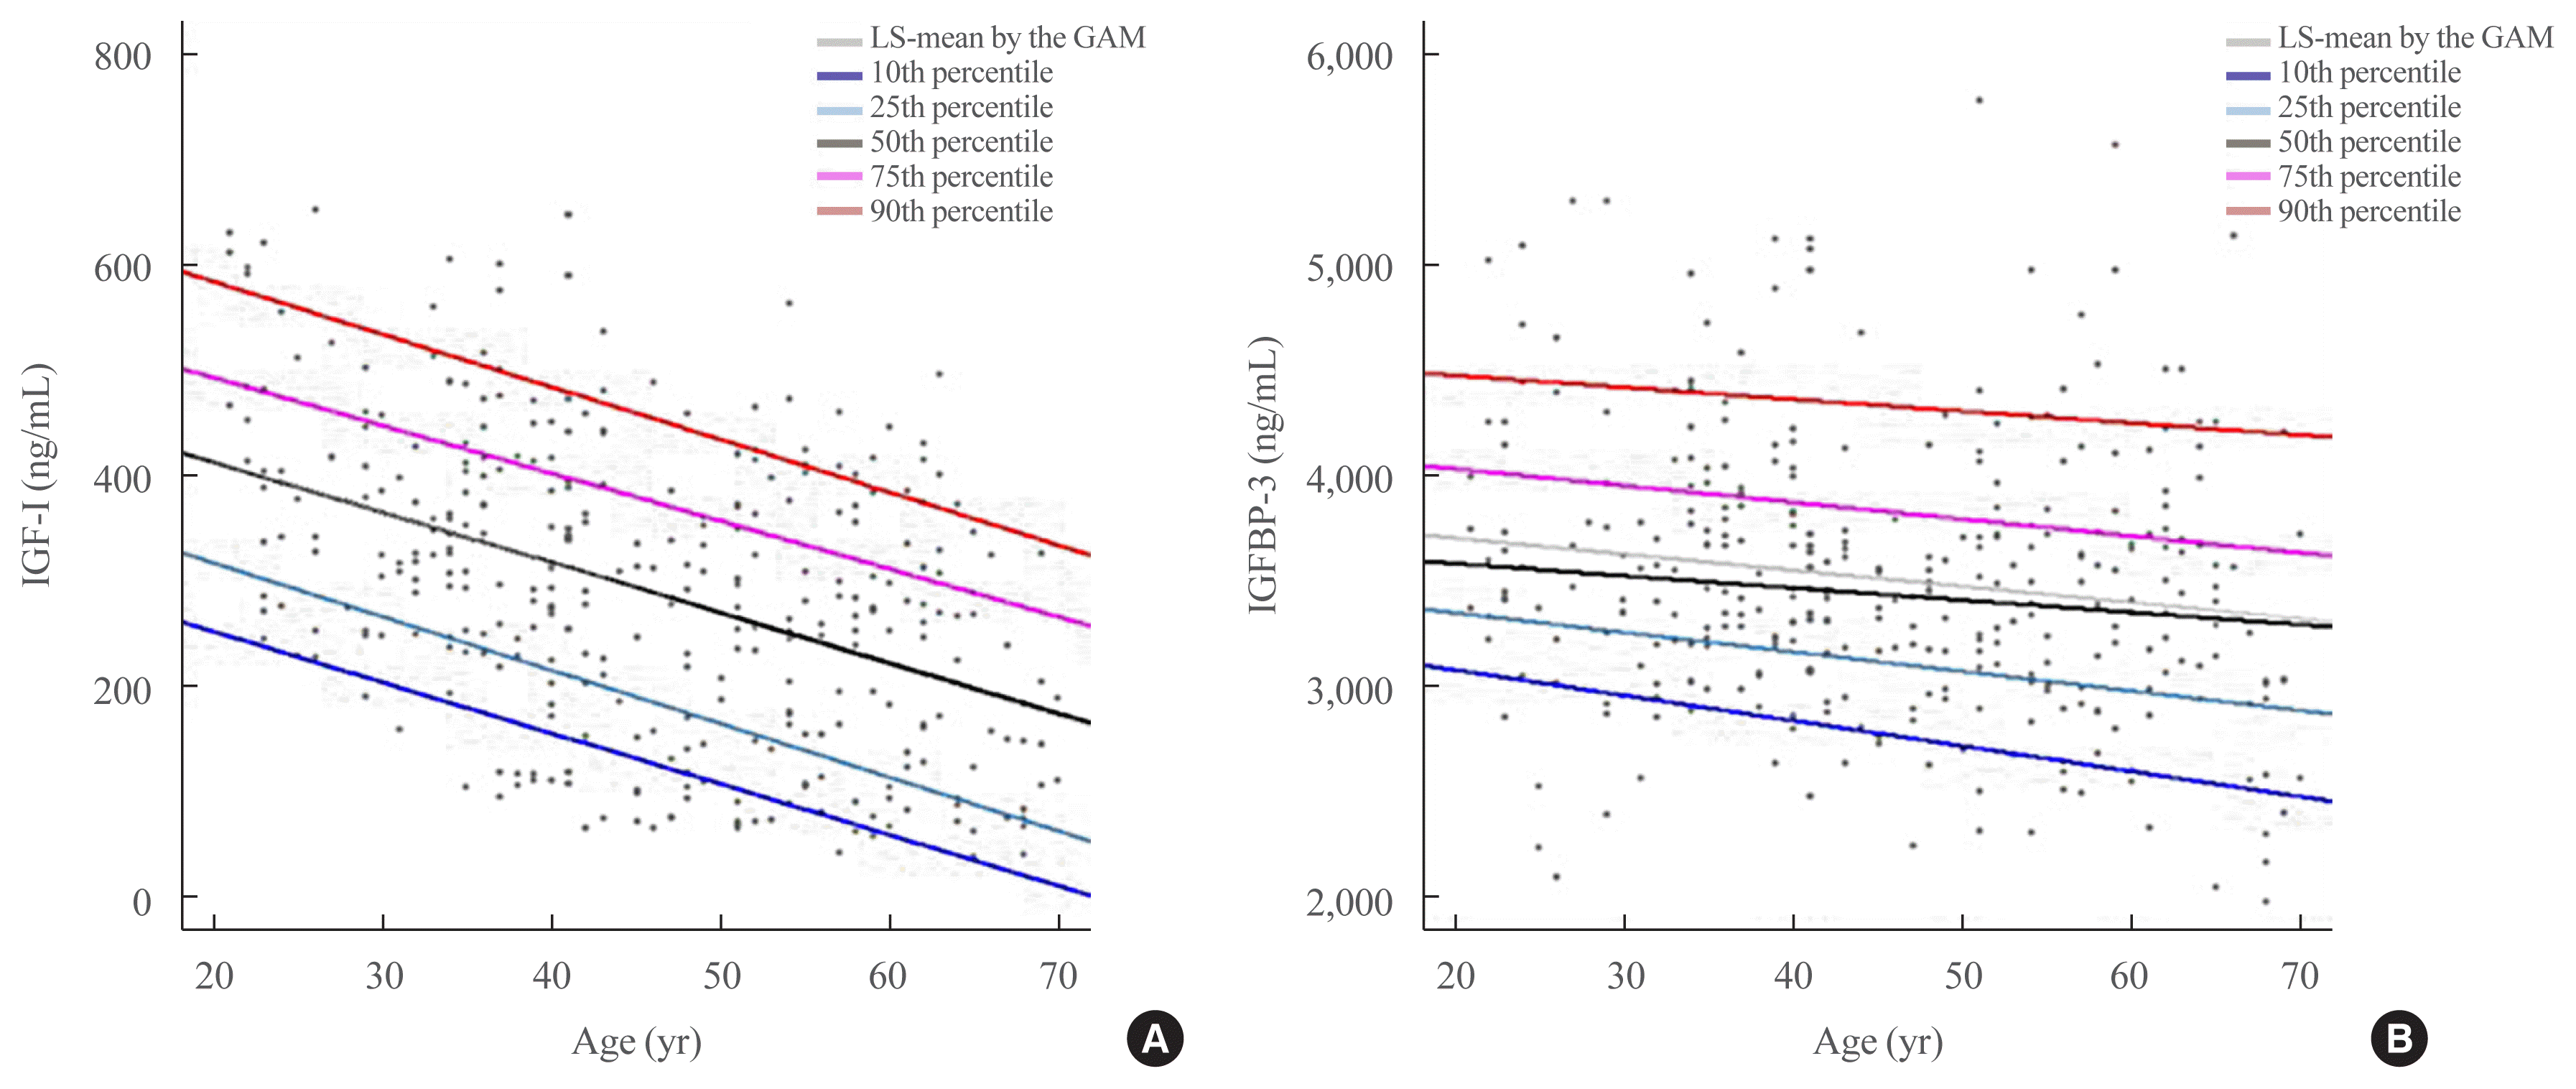
Furthermore, we compared the IGF-1 and IGFBP-3 concentrations between our samples and reference’s data provided by DSL. The ICC was 0.97 (Supplemental Fig. S2). The estimated mean and percentiles for both sexes at 10-year increments are as illustrated in Fig. 1 and Supplemental Table S2.

The correlation between serum IGF-I/IGFBP-3 and clinical parameters

IGF-I levels were inversely correlated with age in both sexes (men: r=−0.34, P<0.001; and women: r=−0.50, P<0.001). The correlation of serum IGF-I and IGFBP-3 and the IGF-I/IGFBP-3 ratio with the clinical parameters was analyzed after adjustment of age. Systolic and diastolic blood pressure and free thyroxine (FT4) were inversely associated with IGF-I values; however, weight, BMI, hemoglobin (Hb), creatinine (Cr), alanine transferase (ALT), fasting glucose, and high density lipoprotein cholesterol (HDL-C) were positively correlated with IGF-I (Supplemental Table S3).
The values of serum IGFBP-3 were inversely associated with age, but the relationship was not statistically significant in men (men: r=−0.049, P=0.5225; and women: r=−0.2293, P=0.0029). After adjustment of age, BMI, and fasting blood glucose were positively associated with IGFBP-3 (r=0.1641, P<0.001 and r=0.3425, P<0.001). Systolic and diastolic blood pressure and FT4 were negatively associated with IGFBP-3 (r=−0.1321, P=0.0171; r=−0.2315, P<0.001; r=−0.3651, P<0.001) (Supplemental Table S4).
The relationship between the IGF-I/IGFBP-3 molar ratio and variables is listed in Supplemental Table S5. After adjustment of age, systolic and diastolic blood pressure and FT4 revealed significant negative correlations with IGF-I/IGFBP-3 ratio; however, weight, Hb, Cr, ALT, fasting glucose, HDL-C, and thyroid stimulating hormone were positively correlated (Supplemental Table S5).

DISCUSSION

We report the reference values of IGF-I and IGFBP-3 in healthy Korean adults which are significantly influenced by clinical variables, including age, blood pressure, fasting blood glucose, lipid profile, and FT4. The IGF-I and IGF-I/IGFBP-3 ratio decreased with increasing age, as reported previously [35]. Recently the normal reference ranges for serum IGF-I levels were established in large sample of Chinese adults [5]. The serum IGF-I levels were significantly influenced by age, BMI, and geographical region. It did not differ depending on sex except in the 60 to 64 year old age group [5]. Other studies also showed postmenopausal women presented lower IGF-I level compared to premenopausal women of same age [6,7], which was in accordance with our study results. The estrogen-dependent stimulatory effect on the GH/IGF-I axis induces IGF-I synthesis [7]. Hypertension is associated with low serum IGF-I levels in our study. This was consistent with results of Italian observational exploratory study [10]. They suggested that deficiency of vasodilator effect of IGF-I might be associated with hypertension. In adults with type 1 diabetes, IGF-I and IGFBP-3 levels were lower than those in the control group [11]. In patients with type 2 diabetes, IGF-I level was in a normal range; however, it was significantly lower in the insulin administered group compared with control group [11,12]; however, nondiabetic obese subjects presented increased level of free IGF-I [12]. In the present study, both IGF-I and IGFBP-3 were positively correlated with fasting glucose. IGF-I decreased during short-term fasting and caloric and protein restriction [13]. Caloric restriction does not affect IGFBP-3 or IGFBP-3 proteolytic activity [13,14]; therefore, reduced serum IGF-I during fasting is due to decreased IGF-I production rather than increased IGF-I turnover [2]. In the present study, IGF-I and IGF-I/IGFBP-3 molar ratios were positively associated with the weight, BMI, Hb, fasting glucose, and ALT level which reflect body composition and nutritional status. Thyroid function was associated with the IGFs and their binding proteins, while GH and IGF-I stimulated peripheral conversion of thyroxine (T4) to triiodothyronine [15,16]. A previous study reported that IGF-I level was positively correlated with FT4 [17]. In this study, IGF-I, IGFBP-3, and molar ratio were correlated with FT4.
This study has certain limitations. First, immunoradiometric assay was performed which was not imported after 2007; whereas, recently chemiluminescence immunoassay is preferred. Second, despite nationwide distribution from Seoul and Gyeonggi-do to the southern part of Korea, the study subjects from health promotions centers were recruited. Therefore, the participants were limited. Third, as this study was performed 15 years ago, it is presumed that the IGF level may have changed with the nutrition status.
In conclusion, we conducted a study on IGF-I and IGFBP-3 with healthy Korean adults to treat GH-excess or deficiency. Further studies are warranted to provide Korean reference ranges through further larger multicenter studies using a chemiluminescence immunoassay.

SUPPLEMENTARY MATERIAL

Supplemental Table S1
Baseline Characteristics of Korean Healthy Study Subjects
enm-2020-785-suppl1.pdf
Supplemental Table S2
The Estimated Mean and Percentiles of IGF-I and IGFBP-3 for Both Sexes at 10 Years Increments
enm-2020-785-suppl2.pdf
Supplemental Table S3
Correlation of Insulin-Like Growth Factor-I with Variables
enm-2020-785-suppl3.pdf
Supplemental Table S4
Correlation of Insulin-Like Growth Factor Binding Protein-3 with Variables
enm-2020-785-suppl4.pdf
Supplemental Table S5
Correlation of Insulin-Like Growth Factor-I/Insulin-Like Growth Factor Binding Protein-3 with Clinical Parameters
enm-2020-785-suppl5.pdf
Supplemental Fig S1
Graph presents the mean±standard deviation of (A) insulin-like growth factor-I (IGF-I) and (B) insulin-like growth factor binding protein-3 (IGFBP-3) by 10-year intervals of age group in males (black bar) and females (gray bar).
enm-2020-785-suppl6.pdf
Supplemental Fig S2
Individual points and confidence interval for insulin-like growth factor-I (IGF-I). Intraclass correlation coefficient (ICC) between reference mean (red line) and sample mean (black line) was 0.94.
enm-2020-785-suppl7.pdf

Notes

CONFLICTS OF INTEREST

No potential conflict of interest relevant to this article was reported.

AUTHOR CONTRIBUTIONS

Conception or design: I.K.J., S.W.K. Acquisition, analysis, or interpretation of data: I.K.J., J.K.B., J.N., S.W.K., Y.S.C., T.S.P., S.W.K. Drafting the work or revising: I.K.J. Final approval of the manuscript: I.K.J., S.W.K.

ACKNOWLEDGMENTS

We would like to thank Su Jin Jeong (Part of Statistics Support, Medical Science Research Institute, Kyung Hee University Medical Center) for statistical analysis and Ho Kang Chang for measurements of IGF-I and IGFBP-3 (Endocrinology laboratory, Kyung Hee University Medical Center). This study was supported by grants from GH study group of Korean Endocrine Society.

REFERENCES

1. Hyun SE, Lee BC, Suh BK, Chung SC, Ko CW, Kim HS, et al. Reference values for serum levels of insulin-like growth factor-I and insulin-like growth factor binding protein-3 in Korean children and adolescents. Clin Biochem. 2012; 45:16–21.
crossref
2. Baxter RC, Binoux MA, Clemmons DR, Conover CA, Drop SL, Holly JM, et al. Recommendations for nomenclature of the insulin-like growth factor binding protein superfamily. Endocrinology. 1998; 139:4036.
crossref
3. Juul A, Bang P, Hertel NT, Main K, Dalgaard P, Jorgensen K, et al. Serum insulin-like growth factor-I in 1030 healthy children, adolescents, and adults: relation to age, sex, stage of puberty, testicular size, and body mass index. J Clin Endocrinol Metab. 1994; 78:744–52.
crossref
4. Bidlingmaier M, Friedrich N, Emeny RT, Spranger J, Wolthers OD, Roswall J, et al. Reference intervals for insulin-like growth factor-1 (igf-i) from birth to senescence: results from a multicenter study using a new automated chemiluminescence IGF-I immunoassay conforming to recent international recommendations. J Clin Endocrinol Metab. 2014; 99:1712–21.
crossref
5. Zhu H, Xu Y, Gong F, Shan G, Yang H, Xu K, et al. Reference ranges for serum insulin-like growth factor I (IGF-I) in healthy Chinese adults. PLoS One. 2017; 12:e0185561.
crossref
6. Romagnoli E, Minisola S, Carnevale V, Rosso R, Pacitti MT, Scarda A, et al. Circulating levels of insulin-like growth factor binding protein 3 (IGFBP-3) and insulin-like growth factor I (IGF-I) in perimenopausal women. Osteoporos Int. 1994; 4:305–8.
crossref
7. Dawson-Hughes B, Stern D, Goldman J, Reichlin S. Regulation of growth hormone and somatomedin-C secretion in postmenopausal women: effect of physiological estrogen replacement. J Clin Endocrinol Metab. 1986; 63:424–32.
crossref
8. Granada ML, Murillo J, Lucas A, Salinas I, Llopis MA, Castells I, et al. Diagnostic efficiency of serum IGF-I, IGF-binding protein-3 (IGFBP-3), IGF-I/IGFBP-3 molar ratio and urinary GH measurements in the diagnosis of adult GH deficiency: importance of an appropriate reference population. Eur J Endocrinol. 2000; 142:243–53.
crossref
9. Juul A, Main K, Blum WF, Lindholm J, Ranke MB, Skakkebaek NE. The ratio between serum levels of insulin-like growth factor (IGF)-I and the IGF binding proteins (IGFBP-1, 2 and 3) decreases with age in healthy adults and is increased in acromegalic patients. Clin Endocrinol (Oxf). 1994; 41:85–93.
crossref
10. Colao A, Di Somma C, Cascella T, Pivonello R, Vitale G, Grasso LF, et al. Relationships between serum IGF1 levels, blood pressure, and glucose tolerance: an observational, exploratory study in 404 subjects. Eur J Endocrinol. 2008; 159:389–97.
crossref
11. Jehle PM, Jehle DR, Mohan S, Bohm BO. Serum levels of insulin-like growth factor system components and relationship to bone metabolism in type 1 and type 2 diabetes mellitus patients. J Endocrinol. 1998; 159:297–306.
crossref
12. Frystyk J, Skjaerbaek C, Vestbo E, Fisker S, Orskov H. Circulating levels of free insulin-like growth factors in obese subjects: the impact of type 2 diabetes. Diabetes Metab Res Rev. 1999; 15:314–22.
crossref
13. Smith WJ, Underwood LE, Clemmons DR. Effects of caloric or protein restriction on insulin-like growth factor-I (IGF-I) and IGF-binding proteins in children and adults. J Clin Endocrinol Metab. 1995; 80:443–9.
crossref
14. Bang P, Brismar K, Rosenfeld RG, Hall K. Fasting affects serum insulin-like growth factors (IGFs) and IGF-binding proteins differently in patients with noninsulin-dependent diabetes mellitus versus healthy nonobese and obese subjects. J Clin Endocrinol Metab. 1994; 78:960–7.
crossref
15. Hussain MA, Schmitz O, Jorgensen JO, Christiansen JS, Weeke J, Schmid C, et al. Insulin-like growth factor I alters peripheral thyroid hormone metabolism in humans: comparison with growth hormone. Eur J Endocrinol. 1996; 134:563–7.
crossref
16. Jorgensen JO, Moller J, Laursen T, Orskov H, Christiansen JS, Weeke J. Growth hormone administration stimulates energy expenditure and extrathyroidal conversion of thyroxine to triiodothyronine in a dose-dependent manner and suppresses circadian thyrotrophin levels: studies in GH-deficient adults. Clin Endocrinol (Oxf). 1994; 41:609–14.
crossref
17. Mitchell ML, Hermos RJ, Feingold M, Moses AC. The relationship of insulin-like growth factor-I to total thyroxine in normal and low birth weight infants. Pediatr Res. 1989; 25:336–8.
crossref

Fig. 1
Individual points and percentiles of (A) insulin-like growth factor-I (IGF-I) and (B) insulin-like growth factor binding protein-3 (IGFBP-3) by age group. Curves presented the least squares (LS) means of 10th, 25th, 50th (median), 75th, and 90th percentile of IGF-I and IGFBP-3 calculated by the generalized additive model (GAM) and quantile regression.
enm-2020-785f1.gif
Table 1
Reference Ranges of IGF-I and IGFBP-3 in Healthy Korean Adults
Age, yr Male (n=180) Female (n=172) Reference


No. Mean SD Min Max No. Mean SD Min Max Mean −2SD Mean Mean +2SD
IGF-I, ng/mL 21–30 25 386.42 114.58 189.00 596.00 26 408.26 131.10 227.00 651.00 162.8 443.0 723.2
31–40 44 324.64 112.82 102.50 575.00 44 330.76 128.58 94.00 604.00 115.3 325.1 534.9
41–50 35 282.34 153.44 64.00 646.00 34a 283.70a 125.50a 70.00 536.00 80.9 261.7 442.4
9a,b 194.39a 113.14a 74.00 384.00
51–60 49 281.14 124.79 64.50 562.00 36a 269.64a 138.77a 66.50 464.00 61.5 236.0 410.4
25a,b 186.64a 111.00a 41.00 419.00
61–70 27 214.26 112.23 37.00 429.00 32a 205.07a 129.37a 34.00 495.00 48.7 208.8 368.8

IGFBP-3, ng/mL 21–30 25 3,350.29 514.36 2,232.50 4,292.50 26 3,837.43 840.27 2,091.50 5,297.50 1,965.8 4,236.6 6,507.3
31–40 44 3,506.39 549.26 2,562.50 4,948.50 44 3,745.17 510.40 2,985.00 5,112.50 1,693.0 3,493.0 5,293.0
41–50 35 3,354.80 443.49 2,473.00 4,674.50 34 3,514.76 654.17 2,727.50 5,118.00 2,158.0 3,152.0 4,146.0
9b 3,238.33 590.98 2,239.00 4,136.50
51–60 48 3,473.66 637.91 2,304.00 4,970.50 35 3,316.41 393.13 2,892.50 4,130.00 2,088.0 2,966.0 3,844.0
25b 3,594.50 888.44 2,314.50 5,772.00
61–70 27 3,272.83 671.64 2,048.50 4,502.00 32 3,469.78 684.81 1,975.00 5,135.00

IGF-I, insulin-like growth factor-I; IGFBP-3, insulin-like growth factor binding protein-3; SD, standard deviation.

a We excluded the data of two postmenopausal women who had been treated with hormonal replacement therapy;

b Postmenopausal state.

TOOLS
Similar articles